Powerpoint Templates and Google slides for Groups
Save Your Time and attract your audience with our fully editable PPT Templates and Slides.
-
 Bmw group current assets 2014-18
This is a professionally designed visual chart for BMW Group Current Assets 2014 to 18. This is part of our Data and Statistics products selection, and you will need a Paid account to download the actual report with accurate data and sources. Downloaded report will contain the editable graph with accurate data, an excel table with the actual data, the exact source of the data and the release date. This slide provides a graph of Current Assets in JPY millions of the company BMW Group from the years 2014 to 18. Download it immediately and use it for your business.
-
 Bmw group current liabilities 2014-18
This is a professionally designed visual chart for BMW Group Current Liabilities 2014 to 18. This is part of our Data and Statistics products selection, and you will need a Paid account to download the actual report with accurate data and sources. Downloaded report will contain the editable graph with accurate data, an excel table with the actual data, the exact source of the data and the release date. This slide provides a graph of Current Liabilities in JPY millions of the company BMW Group from the years 2014 to 18. Download it immediately and use it for your business.
-
 Bmw group ebit 2014-18
This is a professionally designed visual chart for BMW Group EBIT 2014 to 18. This is part of our Data and Statistics products selection, and you will need a Paid account to download the actual report with accurate data and sources. Downloaded report will contain the editable graph with accurate data, an excel table with the actual data, the exact source of the data and the release date. This slide provides a graph of EBIT in and millions along with Percentage of Revenue of the company BMW Group from the years 2014 to 18. Download it immediately and use it for your business.
-
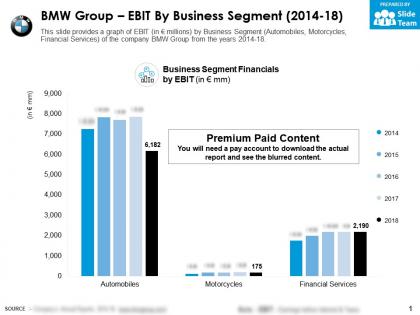 Bmw group ebit by business segment 2014-18
This is a professionally designed visual chart for BMW Group EBIT By Business Segment 2014 to 18. This is part of our Data and Statistics products selection, and you will need a Paid account to download the actual report with accurate data and sources. Downloaded report will contain the editable graph with accurate data, an excel table with the actual data, the exact source of the data and the release date. This slide provides a graph of EBIT in JPY millions by Business Segment Automobiles, Motorcycles, Financial Services of the company BMW Group from the years 2014 to 18. Download it immediately and use it for your business.
-
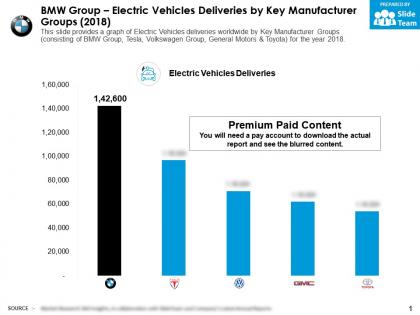 Bmw group electric vehicles deliveries by key manufacturer groups 2018
This is a professionally designed visual chart for BMW Group Electric Vehicles Deliveries By Key Manufacturer Groups 2018. This is part of our Data and Statistics products selection, and you will need a Paid account to download the actual report with accurate data and sources. Downloaded report will contain the editable graph with accurate data, an excel table with the actual data, the exact source of the data and the release date. This slide provides a graph of Electric Vehicles deliveries worldwide by Key Manufacturer Groups consisting of BMW Group, Tesla, Volkswagen Group, General Motors and Toyota for the year 2018. Download it immediately and use it for your business.
-
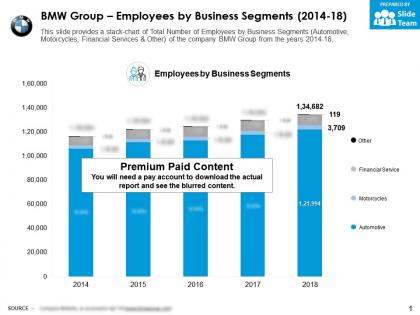 Bmw group employees by business segments 2014-18
This is a professionally designed visual chart for BMW Group Employees By Business Segments 2014 to 18. This is part of our Data and Statistics products selection, and you will need a Paid account to download the actual report with accurate data and sources. Downloaded report will contain the editable graph with accurate data, an excel table with the actual data, the exact source of the data and the release date. This slide provides a stack chart of Total Number of Employees by Business Segments Automotive, Motorcycles, Financial Services and Other of the company BMW Group from the years 2014 to 18. Download it immediately and use it for your business.
-
 Bmw group enterprise value 2014-18
This is a professionally designed visual chart for BMW Group Enterprise Value 2014 to 18. This is part of our Data and Statistics products selection, and you will need a Paid account to download the actual report with accurate data and sources. Downloaded report will contain the editable graph with accurate data, an excel table with the actual data, the exact source of the data and the release date. This slide provides a graph of Enterprise Value in JPY billions of the company BMW Group from the years 2014 to 18. Download it immediately and use it for your business.
-
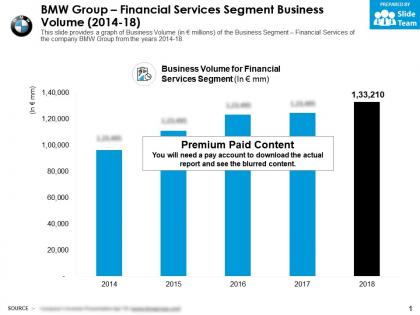 Bmw group financial services segment business volume 2014-18
This is a professionally designed visual chart for BMW Group Financial Services Segment Business Volume 2014 to 18. This is part of our Data and Statistics products selection, and you will need a Paid account to download the actual report with accurate data and sources. Downloaded report will contain the editable graph with accurate data, an excel table with the actual data, the exact source of the data and the release date. This slide provides a graph of Business Volume in JPY millions of the Business Segment Financial Services of the company BMW Group from the years 2014 to 18. Download it immediately and use it for your business.
-
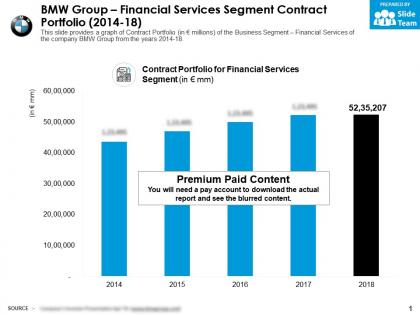 Bmw group financial services segment contract portfolio 2014-18
This is a professionally designed visual chart for BMW Group Financial Services Segment Contract Portfolio 2014 to 18. This is part of our Data and Statistics products selection, and you will need a Paid account to download the actual report with accurate data and sources. Downloaded report will contain the editable graph with accurate data, an excel table with the actual data, the exact source of the data and the release date. This slide provides a graph of Contract Portfolio in JPY millions of the Business Segment Financial Services of the company BMW Group from the years 2014 to 18. Download it immediately and use it for your business.
-
 Bmw group financial services segment credit loss ratio 2014-18
This is a professionally designed visual chart for BMW Group Financial Services Segment Credit Loss Ratio 2014 to 18. This is part of our Data and Statistics products selection, and you will need a Paid account to download the actual report with accurate data and sources. Downloaded report will contain the editable graph with accurate data, an excel table with the actual data, the exact source of the data and the release date. This slide provides a graph of Credit Loss Ratio in Percentage of the Business Segment Financial Services of the company BMW Group from the years 2014 to 18. Download it immediately and use it for your business.
-
 Bmw group financial services segment penetration rate 2014-18
This is a professionally designed visual chart for BMW Group Financial Services Segment Penetration Rate 2014 to 18. This is part of our Data and Statistics products selection, and you will need a Paid account to download the actual report with accurate data and sources. Downloaded report will contain the editable graph with accurate data, an excel table with the actual data, the exact source of the data and the release date. This slide provides a graph of Penetration Rate in Percentage of the Business Segment Financial Services of the company BMW Group from the years 2014 to 18. Download it immediately and use it for your business.
-
 Bmw group financial services segment roe 2014-18
This is a professionally designed visual chart for BMW Group Financial Services Segment Roe 2014 to 18. This is part of our Data and Statistics products selection, and you will need a Paid account to download the actual report with accurate data and sources. Downloaded report will contain the editable graph with accurate data, an excel table with the actual data, the exact source of the data and the release date. This slide provides a graph of ROE in Percentage of the Business Segment Financial Services of the company BMW Group from the years 2014 to 18. Download it immediately and use it for your business.
-
 Bmw group financials services segment by revenue and ebit 2014-18
This is a professionally designed visual chart for BMW Group Financials Services Segment By Revenue And EBIT 2014 to 18. This is part of our Data and Statistics products selection, and you will need a Paid account to download the actual report with accurate data and sources. Downloaded report will contain the editable graph with accurate data, an excel table with the actual data, the exact source of the data and the release date. This slide provides a graph of Revenue and EBIT in JPY millions of the Business Segment Financial Services of the company BMW Group from the years 2014 to 18. Download it immediately and use it for your business.
-
 Bmw group fixed assets 2014-18
This is a professionally designed visual chart for BMW Group Fixed Assets 2014 to 18. This is part of our Data and Statistics products selection, and you will need a Paid account to download the actual report with accurate data and sources. Downloaded report will contain the editable graph with accurate data, an excel table with the actual data, the exact source of the data and the release date. This slide provides a graph of Fixed Assets in JPY millions of the company BMW Group from the years 2014 to 18. Download it immediately and use it for your business.
-
 Bmw group global market share by number of cars produced 2010-18
This is a professionally designed visual chart for BMW Group Global Market Share By Number Of Cars Produced 2010 to 18. This is part of our Data and Statistics products selection, and you will need a Paid account to download the actual report with accurate data and sources. Downloaded report will contain the editable graph with accurate data, an excel table with the actual data, the exact source of the data and the release date. This slide provides a graph of Global Market Share in Percentage by number of cars produced of the company BMW Group from the years 2010 to 18. Download it immediately and use it for your business.
-
 Bmw group gross profit 2014-18
This is a professionally designed visual chart for BMW Group Gross Profit 2014 to 18. This is part of our Data and Statistics products selection, and you will need a Paid account to download the actual report with accurate data and sources. Downloaded report will contain the editable graph with accurate data, an excel table with the actual data, the exact source of the data and the release date. This slide provides a graph of Gross Profit in JPY millions along with Percentage of Revenue of the company BMW Group from the years 2014 to 18. Download it immediately and use it for your business.
-
 Bmw group investment in property plant and equipment ppe 2014-18
This is a professionally designed visual chart for BMW Group Investment In Property Plant And Equipment PPE 2014 to 18. This is part of our Data and Statistics products selection, and you will need a Paid account to download the actual report with accurate data and sources. Downloaded report will contain the editable graph with accurate data, an excel table with the actual data, the exact source of the data and the release date. This slide provides a graph of Investment in Property, plant and equipment PPE in JPY millions of the company BMW Group from the years 2014 to 18. Download it immediately and use it for your business.
-
 Bmw group key automobile markets 2018
This is a professionally designed visual chart for BMW Group Key Automobile Markets 2018. This is part of our Data and Statistics products selection, and you will need a Paid account to download the actual report with accurate data and sources. Downloaded report will contain the editable graph with accurate data, an excel table with the actual data, the exact source of the data and the release date. This slide provides a pie chart of Key Automobile Markets consisting of China, US, Germany, UK, France etc. in Percentage of the company BMW Group for the year 2018. Download it immediately and use it for your business.
-
 Bmw group key motorcycle markets 2018
This is a professionally designed visual chart for BMW Group Key Motorcycle Markets 2018. This is part of our Data and Statistics products selection, and you will need a Paid account to download the actual report with accurate data and sources. Downloaded report will contain the editable graph with accurate data, an excel table with the actual data, the exact source of the data and the release date. This slide provides a pie-chart of Key Motorcycle Markets consisting of US, Germany, UK, France etc. in Percentage of the company BMW Group for the year 2018. Download it immediately and use it for your business.
-
 Bmw group long term liabilities 2014-18
This is a professionally designed visual chart for BMW Group Long Term Liabilities 2014 to 18. This is part of our Data and Statistics products selection, and you will need a Paid account to download the actual report with accurate data and sources. Downloaded report will contain the editable graph with accurate data, an excel table with the actual data, the exact source of the data and the release date. This slide provides a graph of Long term Liabilities in JPY millions of the company BMW Group from the years 2014 to 18. Download it immediately and use it for your business.
-
 Bmw group market share by geography 2019
This is a professionally designed visual chart for BMW Group Market Share By Geography 2019. This is part of our Data and Statistics products selection, and you will need a Paid account to download the actual report with accurate data and sources. Downloaded report will contain the editable graph with accurate data, an excel table with the actual data, the exact source of the data and the release date. This slide provides a geographical graph of Market Share in Percentage in key countries including Germany, UK, Spain, USA, China, Russia, Japan etc. along with World Average for the year 2019. Download it immediately and use it for your business.
-
 Bmw group motorcycle segment roce 2014-18
This is a professionally designed visual chart for BMW Group Motorcycle Segment ROCE 2014 to 18. This is part of our Data and Statistics products selection, and you will need a Paid account to download the actual report with accurate data and sources. Downloaded report will contain the editable graph with accurate data, an excel table with the actual data, the exact source of the data and the release date. This slide provides a graph of Motorcycles Segment ROCE in Percentage of the company BMW Group from the years 2014 to 18. Download it immediately and use it for your business.
-
 Bmw group motorcycles segment deliveries 2014-18
This is a professionally designed visual chart for BMW Group Motorcycles Segment Deliveries 2014 to 18. This is part of our Data and Statistics products selection, and you will need a Paid account to download the actual report with accurate data and sources. Downloaded report will contain the editable graph with accurate data, an excel table with the actual data, the exact source of the data and the release date. This slide provides a graph of Motorcycles Segment Deliveries of the company BMW Group from the years 2014 to 18. Download it immediately and use it for your business.
-
 Bmw group motorcycles segment ebit 2014-18
This is a professionally designed visual chart for BMW Group Motorcycles Segment EBIT 2014 to 18. This is part of our Data and Statistics products selection, and you will need a Paid account to download the actual report with accurate data and sources. Downloaded report will contain the editable graph with accurate data, an excel table with the actual data, the exact source of the data and the release date. This slide provides a graph of Motorcycles Segment EBIT in JPY millions along with margin in Percentage of the company BMW Group from the years 2014 to 18. Download it immediately and use it for your business.
-
 Bmw group motorcycles segment production 2014-18
This is a professionally designed visual chart for BMW Group Motorcycles Segment Production 2014 to 18. This is part of our Data and Statistics products selection, and you will need a Paid account to download the actual report with accurate data and sources. Downloaded report will contain the editable graph with accurate data, an excel table with the actual data, the exact source of the data and the release date. This slide provides a graph of Motorcycles Segment Production of the company BMW Group from the years 2014 to 18. Download it immediately and use it for your business.
-
 Bmw group motorcycles segment revenue 2014-18
This is a professionally designed visual chart for BMW Group Motorcycles Segment Revenue 2014 to 18. This is part of our Data and Statistics products selection, and you will need a Paid account to download the actual report with accurate data and sources. Downloaded report will contain the editable graph with accurate data, an excel table with the actual data, the exact source of the data and the release date. This slide provides a graph of Motorcycles Segment Revenue in JPY millions of the company BMW Group from the years 2014 to 18. Download it immediately and use it for your business.
-
 Bmw group net income 2014-18
This is a professionally designed visual chart for BMW Group Net Income 2014 to 18. This is part of our Data and Statistics products selection, and you will need a Paid account to download the actual report with accurate data and sources. Downloaded report will contain the editable graph with accurate data, an excel table with the actual data, the exact source of the data and the release date. This slide provides a graph of Net Income in JPY millions along with Percentage of Revenue and CAGR in Percentage of the company BMW Group from the years 2014 to 18. Download it immediately and use it for your business.
-
 Bmw group net revenue 2014-18
This is a professionally designed visual chart for BMW Group Net Revenue 2014 to 18. This is part of our Data and Statistics products selection, and you will need a Paid account to download the actual report with accurate data and sources. Downloaded report will contain the editable graph with accurate data, an excel table with the actual data, the exact source of the data and the release date. This slide provides a graph of Net Revenue in JPY millions along with CAGR in Percentage of the company BMW Group from the years 2014 to 18. Download it immediately and use it for your business.
-
 Bmw group r and d expenses 2014-18
This is a professionally designed visual chart for BMW Group R And D Expenses 2014 to 18. This is part of our Data and Statistics products selection, and you will need a Paid account to download the actual report with accurate data and sources. Downloaded report will contain the editable graph with accurate data, an excel table with the actual data, the exact source of the data and the release date.This slide provides a graph of Research and Development Expenses in JPY millions along with Percentage of Revenue of the company BMW Group from the years 2014 to 18. Download it immediately and use it for your business.
-
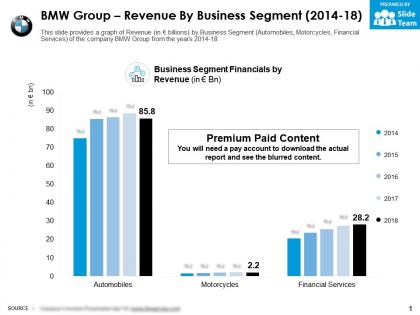 Bmw group revenue by business segment 2014-18
This is a professionally designed visual chart for BMW Group Revenue By Business Segment 2014 to 18. This is part of our Data and Statistics products selection, and you will need a Paid account to download the actual report with accurate data and sources. Downloaded report will contain the editable graph with accurate data, an excel table with the actual data, the exact source of the data and the release date. This slide provides a graph of Revenue in JPY billions by Business Segment Automobiles, Motorcycles, Financial Services of the company BMW Group from the years 2014 to 18 . Download it immediately and use it for your business.
-
 Bmw group revenue by countries 2015-18
This is a professionally designed visual chart for BMW Group Revenue By Countries 2015 to 18. This is part of our Data and Statistics products selection, and you will need a Paid account to download the actual report with accurate data and sources. Downloaded report will contain the editable graph with accurate data, an excel table with the actual data, the exact source of the data and the release date. This slide provides a stack chart of Revenue in JPY millions by Countries Germany, China, USA, Rest of Europe, Rest of Asia, Rest of the Americas and other regions of the company BMW Group from the years 2015 to 18. Download it immediately and use it for your business.
-
 Bmw group revenue by region 2014-18
This is a professionally designed visual chart for BMW Group Revenue By Region 2014 to 18. This is part of our Data and Statistics products selection, and you will need a Paid account to download the actual report with accurate data and sources. Downloaded report will contain the editable graph with accurate data, an excel table with the actual data, the exact source of the data and the release date. This slide provides a stack chart of Revenue in Percentage by Region Europe, Africa, Asia and Oceania and Americas of the company BMW Group from the years 2014 to 18. Download it immediately and use it for your business.
-
 Bmw group sales of electrified vehicles 2013-19
This is a professionally designed visual chart for BMW Group Sales Of Electrified Vehicles 2013 to 19. This is part of our Data and Statistics products selection, and you will need a Paid account to download the actual report with accurate data and sources. Downloaded report will contain the editable graph with accurate data, an excel table with the actual data, the exact source of the data and the release date. This slide gives the information about the Sales of Electrified Vehicles of the company BMW Group, as how the sales had exponentially increased from the years 2013 to 2019. Download it immediately and use it for your business.
-
 Bmw group selling and administrative expenses 2014-18
This is a professionally designed visual chart for BMW Group Selling And Administrative Expenses 2014 to 18. This is part of our Data and Statistics products selection, and you will need a Paid account to download the actual report with accurate data and sources. Downloaded report will contain the editable graph with accurate data, an excel table with the actual data, the exact source of the data and the release date. This slide provides a graph of Selling and Administrative Expenses in JPY millions along with Percentage of Revenue of the company BMW Group from the years 2014 to 18. Download it immediately and use it for your business.
-
 Bmw group shareholders equity 2014-18
This is a professionally designed visual chart for BMW Group Shareholders Equity 2014 to 18. This is part of our Data and Statistics products selection, and you will need a Paid account to download the actual report with accurate data and sources. Downloaded report will contain the editable graph with accurate data, an excel table with the actual data, the exact source of the data and the release date. This slide provides a graph of Shareholders Equity in JPY millions of the company BMW Group from the years 2014 to 18. Download it immediately and use it for your business.
-
 Bmw group top automobile companies ebit comparison 2018
This is a professionally designed visual chart for BMW Group Top Automobile Companies EBIT Comparison 2018. This is part of our Data and Statistics products selection, and you will need a Paid account to download the actual report with accurate data and sources. Downloaded report will contain the editable graph with accurate data, an excel table with the actual data, the exact source of the data and the release date. This slide provides EBIT Earnings before interest and taxes in JPY millions comparison with Key Competitors Volkswagen, Daimler, Hyundai and Fiat with BMW Group for the year 2018. Download it immediately and use it for your business.
-
 Bmw group top automobile companies employees comparison 2018
This is a professionally designed visual chart for BMW Group Top Automobile Companies Employees Comparison 2018. This is part of our Data and Statistics products selection, and you will need a Paid account to download the actual report with accurate data and sources. Downloaded report will contain the editable graph with accurate data, an excel table with the actual data, the exact source of the data and the release date. This slide provides Employees comparison with Key Competitors Volkswagen, Daimler, Hyundai and Fiat with BMW Group for the year 2018. Download it immediately and use it for your business.
-
 Bmw group top automobile companies r and d expenditure comparison 2018
This is a professionally designed visual chart for BMW Group Top Automobile Companies R And D Expenditure Comparison 2018. This is part of our Data and Statistics products selection, and you will need a Paid account to download the actual report with accurate data and sources. Downloaded report will contain the editable graph with accurate data, an excel table with the actual data, the exact source of the data and the release date. This slide provides Research and Development Expenditure in JPY millions comparison with Key Competitors Volkswagen, Daimler, Hyundai and Fiat with BMW Group for the year 2018. Download it immediately and use it for your business.
-
 Bmw group top automobile companies revenue comparison 2018
This is a professionally designed visual chart for BMW Group Top Automobile Companies Revenue Comparison 2018. This is part of our Data and Statistics products selection, and you will need a Paid account to download the actual report with accurate data and sources. Downloaded report will contain the editable graph with accurate data, an excel table with the actual data, the exact source of the data and the release date. This slide provides Revenue in JPY millions comparison with Key Competitors Volkswagen, Daimler, Hyundai and Fiat with BMW Group for the year 2018. Download it immediately and use it for your business.
-
 Bmw group total assets 2014-18
This is a professionally designed visual chart for BMW Group Total Assets 2014 to 18. This is part of our Data and Statistics products selection, and you will need a Paid account to download the actual report with accurate data and sources. Downloaded report will contain the editable graph with accurate data, an excel table with the actual data, the exact source of the data and the release date. This slide provides a graph of Total Assets in JPY millions of the company BMW Group from the years 2014 to 18. Download it immediately and use it for your business.
-
 Bmw group total employees 2014-18
This is a professionally designed visual chart for BMW Group Total Employees 2014 to 18. This is part of our Data and Statistics products selection, and you will need a Paid account to download the actual report with accurate data and sources. Downloaded report will contain the editable graph with accurate data, an excel table with the actual data, the exact source of the data and the release date. This slide provides a graph of Total Number of Employees of the company BMW Group from the years 2014 to 18. Download it immediately and use it for your business.
-
 Bmw group total liabilities and equity 2014-18
This is a professionally designed visual chart for BMW Group Total Liabilities And Equity 2014 to 18. This is part of our Data and Statistics products selection, and you will need a Paid account to download the actual report with accurate data and sources. Downloaded report will contain the editable graph with accurate data, an excel table with the actual data, the exact source of the data and the release date. This slide provides a graph of Total Liabilities and Equity in JPY millions of the company BMW Group from the years 2014 to 18. Download it immediately and use it for your business.
-
 Bmw group working capital 2014-18
This is a professionally designed visual chart for BMW Group Working Capital 2014 to 18. This is part of our Data and Statistics products selection, and you will need a Paid account to download the actual report with accurate data and sources. Downloaded report will contain the editable graph with accurate data, an excel table with the actual data, the exact source of the data and the release date. This slide provides a graph of Working Capital in JPY millions of the company BMW Group from the years 2014 to 18. Download it immediately and use it for your business.
-
 Bmw group key milestones 1916-2019
The information presented in this slide has been researched by our team of professional business analysts. This is part of our Company Profiles products selection, and you will need a Paid account to download the actual report with accurate data and sources. Downloaded report will be in Powerpoint and will contain the actual editable slides with the actual data and sources for each data. This slide shows the Key Milestones and Achievements of the company BMW Group during the period from 1916 to 2019. Download it immediately and use it for your business.
-
 Prudential group insurance segment earning contribution and premium 2017-2018
This is a professionally designed visual chart for Prudential Group Insurance Segment Earning Contribution And Premium 2017 to 2018. This is part of our Data and Statistics products selection, and you will need a Paid account to download the actual report with accurate data and sources. Downloaded report will contain the editable graph with accurate data, an excel table with the actual data, the exact source of the data and the release date. This slide shows the earning contribution to prudential and earned premiums and fees of Group Insurance segment of Prudential Financial Inc. for the year 2017 to 2018. Download it immediately and use it for your business.
-
 Daimler group csr activities 2018
The information presented in this slide has been researched by our team of professional business analysts. This is part of our Company Profiles products selection, and you will need a Paid account to download the actual report with accurate data and sources. Downloaded report will be in Powerpoint and will contain the actual editable slides with the actual data and sources for each data. This slide shows Daimler Group CSR Corporate Social Responsibility w.r.t to the environment for the year 2018. Download it immediately and use it for your business.
-
 Daimler group cash and cash equivalent at end of period 2014-18
This is a professionally designed visual chart for Daimler Group Cash And Cash Equivalent At End Of Period 2014 to 18. This is part of our Data and Statistics products selection, and you will need a Paid account to download the actual report with accurate data and sources. Downloaded report will contain the editable graph with accurate data, an excel table with the actual data, the exact source of the data and the release date. This slide shows Daimler Group Cash and Cash Equivalent at year end from the years 2014 to 2018. Download it immediately and use it for your business.
-
 Daimler group cash flow from financing activities 2014-18
This is a professionally designed visual chart for Daimler Group Cash Flow From Financing Activities 2014 to 18. This is part of our Data and Statistics products selection, and you will need a Paid account to download the actual report with accurate data and sources. Downloaded report will contain the editable graph with accurate data, an excel table with the actual data, the exact source of the data and the release date. This slide shows Daimler Group Cash Flow From Financing Activities from the years 2014 to 2018. Download it immediately and use it for your business.
-
 Daimler group cash flow from investing activities 2014-18
This is a professionally designed visual chart for Daimler Group Cash Flow From Investing Activities 2014 to 18. This is part of our Data and Statistics products selection, and you will need a Paid account to download the actual report with accurate data and sources. Downloaded report will contain the editable graph with accurate data, an excel table with the actual data, the exact source of the data and the release date. This slide shows Daimler Group Cash flow from investing Activities from the years 2014 to 2018. Download it immediately and use it for your business.
-
 Daimler group cash flow from operating activities 2014-18
This is a professionally designed visual chart for Daimler Group Cash Flow From Operating Activities 2014 to 18. This is part of our Data and Statistics products selection, and you will need a Paid account to download the actual report with accurate data and sources. Downloaded report will contain the editable graph with accurate data, an excel table with the actual data, the exact source of the data and the release date. This slide shows Daimler Group Cash Flow From Operating Activities for the years 2014 to 2018. Download it immediately and use it for your business.
-
 Daimler group competitors ebit comparison 2018
This is a professionally designed visual chart for Daimler Group Competitors Ebit Comparison 2018. This is part of our Data and Statistics products selection, and you will need a Paid account to download the actual report with accurate data and sources. Downloaded report will contain the editable graph with accurate data, an excel table with the actual data, the exact source of the data and the release date. This slide shows Daimler Group Competitors BMW, Volkswagen, Hyundai and Fiat Revenue Comparison for the year 2018. Download it immediately and use it for your business.
-
 Daimler group competitors employee comparison 2018
This is a professionally designed visual chart for Daimler Group Competitors Employee Comparison 2018. This is part of our Data and Statistics products selection, and you will need a Paid account to download the actual report with accurate data and sources. Downloaded report will contain the editable graph with accurate data, an excel table with the actual data, the exact source of the data and the release date. This slide shows Daimler Group Competitors BMW, Volkswagen, Hyundai and Fiat Employee Comparison for the year 2018. Download it immediately and use it for your business.
-
 Daimler group competitors research and development expenditure comparison 2018
This is a professionally designed visual chart for Daimler Group Competitors Research And Development Expenditure Comparison 2018. This is part of our Data and Statistics products selection, and you will need a Paid account to download the actual report with accurate data and sources. Downloaded report will contain the editable graph with accurate data, an excel table with the actual data, the exact source of the data and the release date. This slide shows Daimler Group Competitors BMW, Volkswagen, Hyundai and Fiat R and D Expenses Comparison for the year 2018. Download it immediately and use it for your business.
-
 Daimler group competitors revenue comparison 2018
This is a professionally designed visual chart for Daimler Group Competitors Revenue Comparison 2018. This is part of our Data and Statistics products selection, and you will need a Paid account to download the actual report with accurate data and sources. Downloaded report will contain the editable graph with accurate data, an excel table with the actual data, the exact source of the data and the release date. This slide shows Daimler Group Competitors BMW, Volkswagen, Hyundai and Fiat Revenue Comparison for the year 2018. Download it immediately and use it for your business.
-
 Daimler group cost of sales 2014-18
This is a professionally designed visual chart for Daimler Group Cost Of Sales 2014 to 18. This is part of our Data and Statistics products selection, and you will need a Paid account to download the actual report with accurate data and sources. Downloaded report will contain the editable graph with accurate data, an excel table with the actual data, the exact source of the data and the release date. This slide shows Daimler Group AG Cost of Sales from the years 2014 to 2018. Download it immediately and use it for your business.
-
 Daimler group current liabilities 2014-18
This is a professionally designed visual chart for Daimler Group Current Liabilities 2014 to 18. This is part of our Data and Statistics products selection, and you will need a Paid account to download the actual report with accurate data and sources. Downloaded report will contain the editable graph with accurate data, an excel table with the actual data, the exact source of the data and the release date. This slide shows Daimler group Current Liabilities from the years 2014 to 2018. Download it immediately and use it for your business.
-
 Daimler group dividend per share 2014-18
This is a professionally designed visual chart for Daimler Group Dividend Per Share 2014 to 18. This is part of our Data and Statistics products selection, and you will need a Paid account to download the actual report with accurate data and sources. Downloaded report will contain the editable graph with accurate data, an excel table with the actual data, the exact source of the data and the release date. This slide shows Daimler Group Dividend per share from the years 2014 to 2018 JPY PER SHARE. Download it immediately and use it for your business.
-
 Daimler group ebit by divisions 2014-2018
This is a professionally designed visual chart for Daimler Group Ebit By Divisions 2014 to 2018. This is part of our Data and Statistics products selection, and you will need a Paid account to download the actual report with accurate data and sources. Downloaded report will contain the editable graph with accurate data, an excel table with the actual data, the exact source of the data and the release date. This slide shows Daimler Group EBIT earnings before interest and taxes by Divisions from the years 2014 to 18. Download it immediately and use it for your business.
-
 Daimler group enterprise value 2014-18
This is a professionally designed visual chart for Daimler Group Enterprise Value 2014 to 18. This is part of our Data and Statistics products selection, and you will need a Paid account to download the actual report with accurate data and sources. Downloaded report will contain the editable graph with accurate data, an excel table with the actual data, the exact source of the data and the release date. This slide shows the enterprise value of Daimler Group from 2014 to 2018. Download it immediately and use it for your business.
-
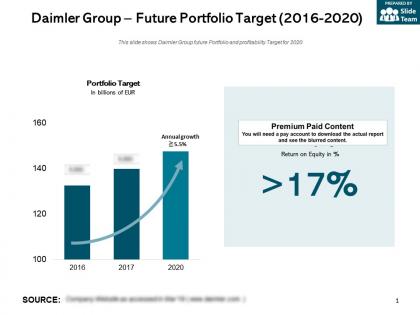 Daimler group future portfolio target 2016-2020
This is a professionally designed visual chart for Daimler Group Future Portfolio Target 2016 to 2020. This is part of our Data and Statistics products selection, and you will need a Paid account to download the actual report with accurate data and sources. Downloaded report will contain the editable graph with accurate data, an excel table with the actual data, the exact source of the data and the release date. This slide shows Daimler Group future Portfolio and profitability Target for 2020. Download it immediately and use it for your business.


