Powerpoint Templates and Google slides for Group.
Save Your Time and attract your audience with our fully editable PPT Templates and Slides.
-
 Field of bachelors degree first major by age groups and subjects for population 25 years and over us 2017
Presenting this set of slides with name - Field Of Bachelors Degree First Major By Age Groups And Subjects For Population 25 Years And Over US 2017. Field Of Bachelors Degree For First Major By Age Groups And Subjects For The Population 25 Years And Over In The U.S For 2017. This is part of our Data and Statistics products selection, and you will need a Paid account to download the actual report with accurate data. Downloaded report will contain the actual editable graph with the actual data, an excel table with the actual data, the exact source of the data and the release date. This Graph Shows The Total Population 25 Years And Over With A Bachelors Degree Or Higher Categorized Into Various Age Groups I.E. 25-39 Yrs, 40-64 Yrs, 65 Yrs, And Over And Subjects Science And Engineering, Science And Engineering Related Fields, Business, Education, Arts, Humanities And Others In The U.S For The Year 2017. It covers topic Field Of Bachelors Degree For First Major for region USA and is for date range 2017. Download it immediately and use it for your business.
-
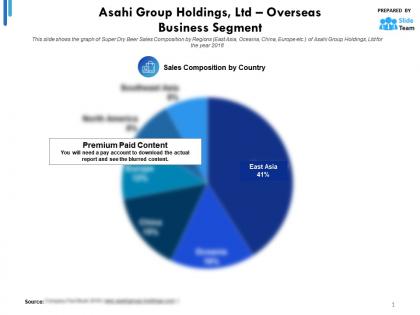 Asahi group holdings ltd overseas business segment
This is a professionally designed visual chart for Asahi Group Holdings Ltd Overseas Business Segment. This is part of our Data and Statistics products selection, and you will need a Paid account to download the actual report with accurate data and sources. Downloaded report will contain the editable graph with accurate data, an excel table with the actual data, the exact source of the data and the release date. This slide shows the graph of Super Dry Beer Sales Composition by Regions East Asia, Oceania, China, Europe etc. of Asahi Group Holdings, Ltd for the year 2018. Download it immediately and use it for your business.
-
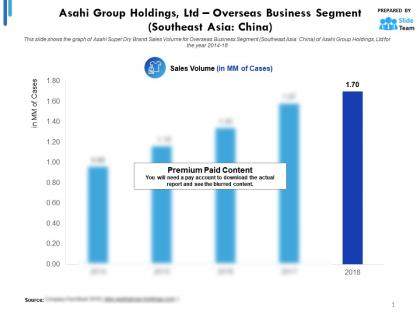 Asahi group holdings ltd statistic 1 overseas business segment southeast asia china
This is a professionally designed visual chart for Asahi Group Holdings Ltd Statistic 1 Overseas Business Segment Southeast Asia China. This is part of our Data and Statistics products selection, and you will need a Paid account to download the actual report with accurate data and sources. Downloaded report will contain the editable graph with accurate data, an excel table with the actual data, the exact source of the data and the release date. This slide shows the graph of Asahi Super Dry Brand Sales Volume for Overseas Business Segment Southeast Asia, China of Asahi Group Holdings, Ltd for the year 2014 to 18. Download it immediately and use it for your business.
-
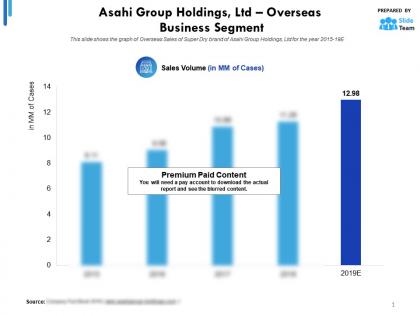 Asahi group holdings ltd statistic 1 overseas business segment
This is a professionally designed visual chart for Asahi Group Holdings Ltd Statistic 1 Overseas Business Segment. This is part of our Data and Statistics products selection, and you will need a Paid account to download the actual report with accurate data and sources. Downloaded report will contain the editable graph with accurate data, an excel table with the actual data, the exact source of the data and the release date. This slide shows the graph of Overseas Sales of Super Dry brand of Asahi Group Holdings, Ltd for the year 2015 to 19E. Download it immediately and use it for your business.
-
 Asahi group holdings ltd cash and cash equivalents at end of year 2014-2018
This is a professionally designed visual chart for Asahi Group Holdings Ltd Cash And Cash Equivalents At End Of Year 2014 to 2018. This is part of our Data and Statistics products selection, and you will need a Paid account to download the actual report with accurate data and sources. Downloaded report will contain the editable graph with accurate data, an excel table with the actual data, the exact source of the data and the release date. This slide provides a graph of Cash and Cash Equivalents in JPY Bn of Asahi Group Holdings, Ltd, for the years 2014 to 18 at the end of each year. Download it immediately and use it for your business.
-
 Asahi group holdings ltd cash flow from financing activities 2014-2018
This is a professionally designed visual chart for Asahi Group Holdings Ltd Cash Flow From Financing Activities 2014 to 2018. This is part of our Data and Statistics products selection, and you will need a Paid account to download the actual report with accurate data and sources. Downloaded report will contain the editable graph with accurate data, an excel table with the actual data, the exact source of the data and the release date. This slide provides a graph of cash flow from financing activities in JPY Bn of Asahi Group Holdings, Ltd, for the years 2014 to 18. Download it immediately and use it for your business.
-
 Asahi group holdings ltd statistic 1 alcohol beverages business segment
This is a professionally designed visual chart for Asahi Group Holdings Ltd Statistic 1 Alcohol Beverages Business Segment. This is part of our Data and Statistics products selection, and you will need a Paid account to download the actual report with accurate data and sources. Downloaded report will contain the editable graph with accurate data, an excel table with the actual data, the exact source of the data and the release date. This slide provides a graph of revenue split of Alcohol Beverages Business Segment by container type bottle, can, keg of Asahi Group Holdings, Ltd for the years 2014 to 18. Download it immediately and use it for your business.
-
 Asahi group holdings ltd statistic 1 food business segment
This is a professionally designed visual chart for Asahi Group Holdings Ltd Statistic 1 Food Business Segment. This is part of our Data and Statistics products selection, and you will need a Paid account to download the actual report with accurate data and sources. Downloaded report will contain the editable graph with accurate data, an excel table with the actual data, the exact source of the data and the release date. This slide provides the graph of market share candy tablet market, baby food market, instant miso soup of Asahi Group Holdings, Ltd in Japanese market for the year 2018. Download it immediately and use it for your business.
-
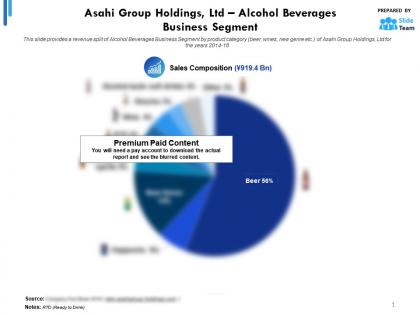 Asahi group holdings ltd statistic 2 alcohol beverages business segment
This is a professionally designed visual chart for Asahi Group Holdings Ltd Statistic 2 Alcohol Beverages Business Segment. This is part of our Data and Statistics products selection, and you will need a Paid account to download the actual report with accurate data and sources. Downloaded report will contain the editable graph with accurate data, an excel table with the actual data, the exact source of the data and the release date. This slide provides a revenue split of Alcohol Beverages Business Segment by product category beer, wines, new genre etc. of Asahi Group Holdings, Ltd for the years 2014 to 18. Download it immediately and use it for your business.
-
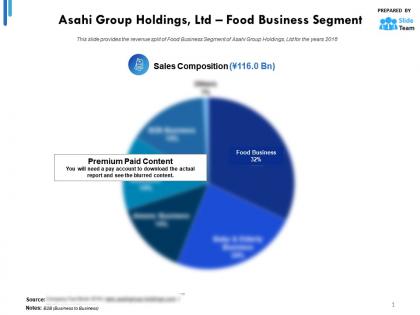 Asahi group holdings ltd statistic 2 food business segment
This is a professionally designed visual chart for Asahi Group Holdings Ltd Statistic 2 Food Business Segment. This is part of our Data and Statistics products selection, and you will need a Paid account to download the actual report with accurate data and sources. Downloaded report will contain the editable graph with accurate data, an excel table with the actual data, the exact source of the data and the release date. Asahi Group Holdings Ltd Statistic 3 Food Business Segment This slide provides the revenue split of Food Business Segment of Asahi Group Holdings, Ltd for the years 2018. Download it immediately and use it for your business.
-
 Asahi group holdings ltd statistic 3 alcohol beverages business segment
This is a professionally designed visual chart for Asahi Group Holdings Ltd Statistic 3 Alcohol Beverages Business Segment. This is part of our Data and Statistics products selection, and you will need a Paid account to download the actual report with accurate data and sources. Downloaded report will contain the editable graph with accurate data, an excel table with the actual data, the exact source of the data and the release date. This slide provides a graph of revenue in JPY Bn and core operating profit margin of Alcohol Beverages Business Segment of Asahi Group Holdings, Ltd for the years 2014 to 18. Download it immediately and use it for your business.
-
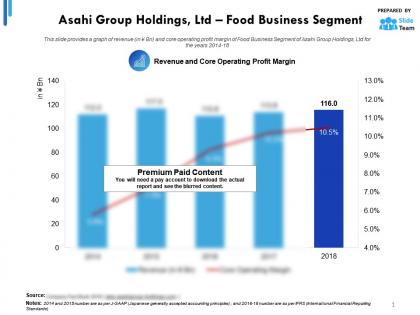 Asahi group holdings ltd statistic 3 food business segment
This is a professionally designed visual chart for Asahi Group Holdings Ltd Statistic 3 Food Business Segment. This is part of our Data and Statistics products selection, and you will need a Paid account to download the actual report with accurate data and sources. Downloaded report will contain the editable graph with accurate data, an excel table with the actual data, the exact source of the data and the release date. This slide provides a graph of revenue in JPY Bn and core operating profit margin of Food Business Segment of Asahi Group Holdings, Ltd for the years 2014 to 18. Download it immediately and use it for your business.
-
 Asahi group holdings ltd cash flow from investing activities 2014-2018
This is a professionally designed visual chart for Asahi Group Holdings Ltd Cash Flow From Investing Activities 2014 to 2018. This is part of our Data and Statistics products selection, and you will need a Paid account to download the actual report with accurate data and sources. Downloaded report will contain the editable graph with accurate data, an excel table with the actual data, the exact source of the data and the release date. This slide provides a graph of cash flow from investing activities in JPY Bn of Asahi Group Holdings, Ltd for the years 2014 to 18. Download it immediately and use it for your business.
-
 Asahi group holdings ltd cash flow from operating activities 2014-2018
This is a professionally designed visual chart for Asahi Group Holdings Ltd Cash Flow From Operating Activities 2014 to 2018. This is part of our Data and Statistics products selection, and you will need a Paid account to download the actual report with accurate data and sources. Downloaded report will contain the editable graph with accurate data, an excel table with the actual data, the exact source of the data and the release date. This slide provides a graph of cash flow from operating activities major activities in JPY Bn of Asahi Group Holdings, Ltd for the years 2014 to 18. Download it immediately and use it for your business.
-
 Asahi group holdings ltd core operating profit and margin 2014-2018
This is a professionally designed visual chart for Asahi Group Holdings Ltd Core Operating Profit And Margin 2014 to 2018. This is part of our Data and Statistics products selection, and you will need a Paid account to download the actual report with accurate data and sources. Downloaded report will contain the editable graph with accurate data, an excel table with the actual data, the exact source of the data and the release date. This slide provides a graph of Core operating profit in JPY Bn and core operating margin in percent of Asahi Group Holdings, Ltd for the years 2014 to 18. Download it immediately and use it for your business.
-
 Asahi group holdings ltd cost of sales 2014-2018
This is a professionally designed visual chart for Asahi Group Holdings Ltd Cost Of Sales 2014 to 2018. This is part of our Data and Statistics products selection, and you will need a Paid account to download the actual report with accurate data and sources. Downloaded report will contain the editable graph with accurate data, an excel table with the actual data, the exact source of the data and the release date. This slide provides a graph of cost of sales in JPY Bn of Asahi Group Holdings, Ltd for the years 2014 to 18. Download it immediately and use it for your business.
-
 Asahi group holdings ltd current assets 2014-2018
This is a professionally designed visual chart for Asahi Group Holdings Ltd Current Assets 2014 to 2018. This is part of our Data and Statistics products selection, and you will need a Paid account to download the actual report with accurate data and sources. Downloaded report will contain the editable graph with accurate data, an excel table with the actual data, the exact source of the data and the release date. This slide provides a graph of current assets cash, bill receivable, inventory etc. in JPY Bn, of Asahi Group Holdings, Ltd for the years 2014 to 18. Download it immediately and use it for your business.
-
 Asahi group holdings ltd current liabilities 2014-2018
This is a professionally designed visual chart for Asahi Group Holdings Ltd Current Liabilities 2014 to 2018. This is part of our Data and Statistics products selection, and you will need a Paid account to download the actual report with accurate data and sources. Downloaded report will contain the editable graph with accurate data, an excel table with the actual data, the exact source of the data and the release date. This slide provides a graph of current liabilities short-term liabilities in JPY Bn of Asahi Group Holdings, Ltd for the years 2014 to 18. Download it immediately and use it for your business.
-
 Asahi group holdings ltd ebitda 2014-2018
This is a professionally designed visual chart for Asahi Group Holdings Ltd EBITDA 2014 to 2018. This is part of our Data and Statistics products selection, and you will need a Paid account to download the actual report with accurate data and sources. Downloaded report will contain the editable graph with accurate data, an excel table with the actual data, the exact source of the data and the release date. This slide provides a graph of EBITDA Earning before Interest, Tax, Depreciation and amortization in JPY Bn of Asahi Group Holdings, Ltd for the years 2014 to 18. Download it immediately and use it for your business.
-
 Asahi group holdings ltd fixed assets 2014-2018
This is a professionally designed visual chart for Asahi Group Holdings Ltd Fixed Assets 2014 to 2018. This is part of our Data and Statistics products selection, and you will need a Paid account to download the actual report with accurate data and sources. Downloaded report will contain the editable graph with accurate data, an excel table with the actual data, the exact source of the data and the release date. This slide provides a graph of fixed assets plant, machinery, goodwill, building etc. in JPY Bn, of Asahi Group Holdings, Ltd for the years 2014 to 18. Download it immediately and use it for your business.
-
 Asahi group holdings ltd gross profit and margin 2014-2018
This is a professionally designed visual chart for Asahi Group Holdings Ltd Gross Profit And Margin 2014 to 2018. This is part of our Data and Statistics products selection, and you will need a Paid account to download the actual report with accurate data and sources. Downloaded report will contain the editable graph with accurate data, an excel table with the actual data, the exact source of the data and the release date. This slide provides a graph of gross profit in JPY Bn and gross margin in percent of Asahi Group Holdings, Ltd for the years 2014 to 18. Download it immediately and use it for your business.
-
 Asahi group holdings ltd inventory turnover 2014-2018
This is a professionally designed visual chart for Asahi Group Holdings Ltd Inventory Turnover 2014 to 2018. This is part of our Data and Statistics products selection, and you will need a Paid account to download the actual report with accurate data and sources. Downloaded report will contain the editable graph with accurate data, an excel table with the actual data, the exact source of the data and the release date. This slide shows graph of inventory turnover ratio of Asahi Group Holdings, Ltd for the years 2014 to 18. Download it immediately and use it for your business.
-
 Asahi group holdings ltd investment in pp and e 2014-2018
This is a professionally designed visual chart for Asahi Group Holdings Ltd Investment In PP And E 2014 to 2018. This is part of our Data and Statistics products selection, and you will need a Paid account to download the actual report with accurate data and sources. Downloaded report will contain the editable graph with accurate data, an excel table with the actual data, the exact source of the data and the release date. This slide provides a graph of Asahi Group Holdings, Ltds investment in PP and E Property, Plant and Equipment in JPY Bn for the years 2014 to 18. Download it immediately and use it for your business.
-
 Asahi group holdings ltd key ratios 2014-2018
This is a professionally designed visual chart for Asahi Group Holdings Ltd Key Ratios 2014 to 2018. This is part of our Data and Statistics products selection, and you will need a Paid account to download the actual report with accurate data and sources. Downloaded report will contain the editable graph with accurate data, an excel table with the actual data, the exact source of the data and the release date. This slide shows key ratios profitability, liquidity, management etc. of Asahi Group Holdings, Ltd for the years 2014 to 18. Download it immediately and use it for your business.
-
 Asahi group holdings ltd long term debts liabilities 2014-2018
This is a professionally designed visual chart for Asahi Group Holdings Ltd Long Term Debts Liabilities 2014 to 2018. This is part of our Data and Statistics products selection, and you will need a Paid account to download the actual report with accurate data and sources. Downloaded report will contain the editable graph with accurate data, an excel table with the actual data, the exact source of the data and the release date. This slide provides a graph of long term debts liabilities in JPY Bn of Asahi Group Holdings, Ltd for the years 2014 to 18. Download it immediately and use it for your business.
-
 Asahi group holdings ltd net profit and margin 2014-2018
This is a professionally designed visual chart for Asahi Group Holdings Ltd Net Profit And Margin 2014 to 2018. This is part of our Data and Statistics products selection, and you will need a Paid account to download the actual report with accurate data and sources. Downloaded report will contain the editable graph with accurate data, an excel table with the actual data, the exact source of the data and the release date. This slide provides a graph of net profit in JPY Bn and net margin in percent of Asahi Group Holdings, Ltd for the years 2014 to 18. Download it immediately and use it for your business.
-
 Asahi group holdings ltd operating profit by business segments 2016-2018
This is a professionally designed visual chart for Asahi Group Holdings Ltd Operating Profit By Business Segments 2016 to 2018. This is part of our Data and Statistics products selection, and you will need a Paid account to download the actual report with accurate data and sources. Downloaded report will contain the editable graph with accurate data, an excel table with the actual data, the exact source of the data and the release date. This slide provides a graph of operating Income of business segments Alcohol beverages, Soft Drinks, Food, and Overseas of Asahi Group Holdings, Ltd for the years 2016 to 18. Download it immediately and use it for your business.
-
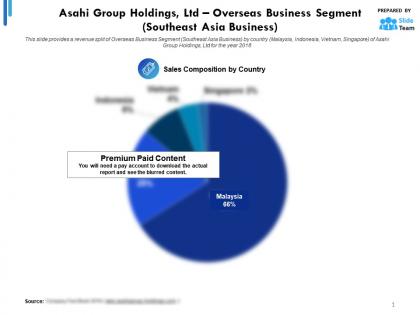 Asahi group holdings ltd overseas business segment southeast asia business
This is a professionally designed visual chart for Asahi Group Holdings Ltd Overseas Business Segment Southeast Asia Business. This is part of our Data and Statistics products selection, and you will need a Paid account to download the actual report with accurate data and sources. Downloaded report will contain the editable graph with accurate data, an excel table with the actual data, the exact source of the data and the release date. This slide provides a revenue split of Overseas Business Segment Southeast Asia Business by country Malaysia, Indonesia, Vietnam, Singapore of Asahi Group Holdings, Ltd for the year 2018. Download it immediately and use it for your business.
-
 Asahi group holdings ltd research and development expenses 2013-2018
This is a professionally designed visual chart for Asahi Group Holdings Ltd Research And Development Expenses 2013 to 2018. This is part of our Data and Statistics products selection, and you will need a Paid account to download the actual report with accurate data and sources. Downloaded report will contain the editable graph with accurate data, an excel table with the actual data, the exact source of the data and the release date. This slide provides a graph of Research and Development Expenses in JPY Bn of Asahi Group Holdings, Ltd for the years 2013 to 18. Download it immediately and use it for your business.
-
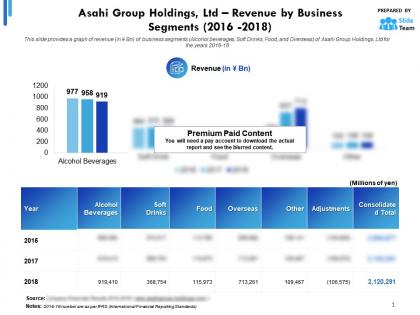 Asahi group holdings ltd revenue by business segments 2016-2018
This is a professionally designed visual chart for Asahi Group Holdings Ltd Revenue By Business Segments 2016 to 2018. This is part of our Data and Statistics products selection, and you will need a Paid account to download the actual report with accurate data and sources. Downloaded report will contain the editable graph with accurate data, an excel table with the actual data, the exact source of the data and the release date. This slide provides a graph of revenue in JPY Bn of business segments Alcohol beverages, Soft Drinks, Food and Overseas of Asahi Group Holdings, Ltd for the years 2016 to 18. Download it immediately and use it for your business.
-
 Asahi group holdings ltd shareholder equity 2014-2018
This is a professionally designed visual chart for Asahi Group Holdings Ltd Shareholder Equity 2014 to 2018. This is part of our Data and Statistics products selection, and you will need a Paid account to download the actual report with accurate data and sources. Downloaded report will contain the editable graph with accurate data, an excel table with the actual data, the exact source of the data and the release date. This slide provides a graph of Shareholder Equity Total Equity in JPY Bn of Asahi Group Holdings, Ltd for the years 2014 to 18. Download it immediately and use it for your business.
-
 Asahi group holdings ltd soft drinks business segment
This is a professionally designed visual chart for Asahi Group Holdings Ltd Soft Drinks Business Segment. This is part of our Data and Statistics products selection, and you will need a Paid account to download the actual report with accurate data and sources. Downloaded report will contain the editable graph with accurate data, an excel table with the actual data, the exact source of the data and the release date. This slide provides a sales volume of Soft Drinks Business Segment by container type Can, PET bottles, Glass Bottles etc. of Asahi Group Holdings, Ltd for the years 2014 to 18. Download it immediately and use it for your business.
-
 Asahi group holdings ltd statistic 1 overseas business europe italy netherlands and uk
This is a professionally designed visual chart for Asahi Group Holdings Ltd Statistic 1 Overseas Business Europe Italy Netherlands And UK. This is part of our Data and Statistics products selection, and you will need a Paid account to download the actual report with accurate data and sources. Downloaded report will contain the editable graph with accurate data, an excel table with the actual data, the exact source of the data and the release date. This slide provides a graph of revenue in JPY MM and core operating profit margin of Overseas Business Europe-Italy, Netherlands and UK of Asahi Group Holdings, Ltd for the years 2014 to 18. Download it immediately and use it for your business.
-
 Asahi group holdings ltd statistic 1 overseas business europe poland czech slovakia romania hungary
This is a professionally designed visual chart for Asahi Group Holdings Ltd Statistic 1 Overseas Business Europe Poland Czech Slovakia Romania Hungary. This is part of our Data and Statistics products selection, and you will need a Paid account to download the actual report with accurate data and sources. Downloaded report will contain the editable graph with accurate data, an excel table with the actual data, the exact source of the data and the release date. This slide provides a graph of revenue in JPY MM and core operating profit margin of Overseas Business Europe-Poland, Czech, Slovakia, Romania, Hungary of Asahi Group Holdings, Ltd for the years 2014 to 18. Download it immediately and use it for your business.
-
 Asahi group holdings ltd statistic 1 soft drinks business segment
This is a professionally designed visual chart for Asahi Group Holdings Ltd Statistic 1 Soft Drinks Business Segment. This is part of our Data and Statistics products selection, and you will need a Paid account to download the actual report with accurate data and sources. Downloaded report will contain the editable graph with accurate data, an excel table with the actual data, the exact source of the data and the release date. This slide provides a sales volume of Soft Drinks Business Segment by marketing channel vending machines, Convenience stores, supermarkets etc. of Asahi Group Holdings, Ltd for the years 2014 to 18. Download it immediately and use it for your business.
-
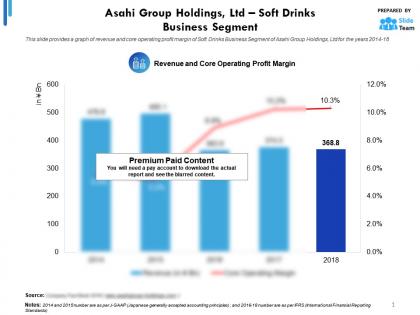 Asahi group holdings ltd statistic 2 soft drinks business segment
This is a professionally designed visual chart for Asahi Group Holdings Ltd Statistic 2 Soft Drinks Business Segment. This is part of our Data and Statistics products selection, and you will need a Paid account to download the actual report with accurate data and sources. Downloaded report will contain the editable graph with accurate data, an excel table with the actual data, the exact source of the data and the release date. This slide provides a graph of revenue and core operating profit margin of Soft Drinks Business Segment of Asahi Group Holdings, Ltd for the years 2014 to 18. Download it immediately and use it for your business.
-
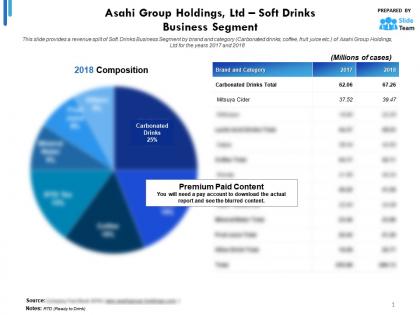 Asahi group holdings ltd statistic 3 soft drinks business segment
This is a professionally designed visual chart for Asahi Group Holdings Ltd Statistic 3 Soft Drinks Business Segment. This is part of our Data and Statistics products selection, and you will need a Paid account to download the actual report with accurate data and sources. Downloaded report will contain the editable graph with accurate data, an excel table with the actual data, the exact source of the data and the release date. This slide provides a revenue split of Soft Drinks Business Segment by brand and category Carbonated drinks, coffee, fruit juice etc. of Asahi Group Holdings, Ltd for the years 2017 to 2018. Download it immediately and use it for your business.
-
 Asahi group holdings ltd total assets 2014-2018
This is a professionally designed visual chart for Asahi Group Holdings Ltd Total Assets 2014 to 2018. This is part of our Data and Statistics products selection, and you will need a Paid account to download the actual report with accurate data and sources. Downloaded report will contain the editable graph with accurate data, an excel table with the actual data, the exact source of the data and the release date. This slide provides a graph of Total Assets Fixed and Current in JPY Bn of Asahi Group Holdings, Ltd for the years 2014 to 18. Download it immediately and use it for your business.
-
 Asahi group holdings ltd total liabilities and equity 2014-2018
This is a professionally designed visual chart for Asahi Group Holdings Ltd Total Liabilities And Equity 2014 to 2018. This is part of our Data and Statistics products selection, and you will need a Paid account to download the actual report with accurate data and sources. Downloaded report will contain the editable graph with accurate data, an excel table with the actual data, the exact source of the data and the release date. This slide provides a graph of Total Liabilities and Equity in JPY Bn of Asahi Group Holdings, Ltd for the years 2014 to 18. Download it immediately and use it for your business.
-
 Asahi group holdings ltd total revenue 2014-2018
This is a professionally designed visual chart for Asahi Group Holdings Ltd Total Revenue 2014 to 2018. This is part of our Data and Statistics products selection, and you will need a Paid account to download the actual report with accurate data and sources. Downloaded report will contain the editable graph with accurate data, an excel table with the actual data, the exact source of the data and the release date. This slide provides a graph of Revenue in JPY Bn along with CAGR in percent of Asahi Group Holdings, Ltd for the years 2014 to 18. Download it immediately and use it for your business.
-
 Asahi group holdings ltd trade receivables turnover 2014-2018
This is a professionally designed visual chart for Asahi Group Holdings Ltd Trade Receivables Turnover 2014 to 2018. This is part of our Data and Statistics products selection, and you will need a Paid account to download the actual report with accurate data and sources. Downloaded report will contain the editable graph with accurate data, an excel table with the actual data, the exact source of the data and the release date. This slide shows the graph of trade receivables turnover ratio of Asahi Group Holdings, Ltd for the years 2014 to 18. Download it immediately and use it for your business.
-
 Asahi group holdings ltd working capital 2014-2018
This is a professionally designed visual chart for Asahi Group Holdings Ltd Working Capital 2014 to 2018. This is part of our Data and Statistics products selection, and you will need a Paid account to download the actual report with accurate data and sources. Downloaded report will contain the editable graph with accurate data, an excel table with the actual data, the exact source of the data and the release date. This slide provides a graph of working capital in JPY Bn of Asahi Group Holdings, Ltd for the years 2014 to 18. Download it immediately and use it for your business.
-
 Asahi group retail sales share in sugar confectionery market japan 2014-18
This is a professionally designed visual chart for Asahi Group Retail Sales Share In Sugar Confectionery Market Japan 2014 to 18. This is part of our Data and Statistics products selection, and you will need a Paid account to download the actual report with accurate data and sources. Downloaded report will contain the editable graph with accurate data, an excel table with the actual data, the exact source of the data and the release date. This slide provides the graph of Asahi Group Holdings, Ltds retail sales share percent in Sugar Confectionery Market for the years 2014 to 18. Download it immediately and use it for your business.
-
 Bmw group automobile production by plant 2018
This is a professionally designed visual chart for BMW Group Automobile Production By Plant 2018. This is part of our Data and Statistics products selection, and you will need a Paid account to download the actual report with accurate data and sources. Downloaded report will contain the editable graph with accurate data, an excel table with the actual data, the exact source of the data and the release date. This slide depicts the Business Segment Automobile Production by Plant consisting of Germany, South Africa, China, UK etc. of the company BMW Group for the year 2018. Download it immediately and use it for your business.
-
 Bmw group automotive segment deliveries 2014-18
This is a professionally designed visual chart for BMW Group Automotive Segment Deliveries 2014 to 18. This is part of our Data and Statistics products selection, and you will need a Paid account to download the actual report with accurate data and sources. Downloaded report will contain the editable graph with accurate data, an excel table with the actual data, the exact source of the data and the release date. This slide provides a graph of Automotive Segment Deliveries in millions of the company BMW Group from the years 2014 to 18. Download it immediately and use it for your business.
-
 Bmw group automotive segment ebit 2014-18
This is a professionally designed visual chart for BMW Group Automotive Segment EBIT 2014 to 18. This is part of our Data and Statistics products selection, and you will need a Paid account to download the actual report with accurate data and sources. Downloaded report will contain the editable graph with accurate data, an excel table with the actual data, the exact source of the data and the release date. This slide provides a graph of Automotive Segment EBIT in JPY millions along with margin in Percentage of the company BMW Group from the years 2014 to 18. Download it immediately and use it for your business.
-
 Bmw group automotive segment fleet emissions 2014-18
This is a professionally designed visual chart for BMW Group Automotive Segment Fleet Emissions 2014 to 18. This is part of our Data and Statistics products selection, and you will need a Paid account to download the actual report with accurate data and sources. Downloaded report will contain the editable graph with accurate data, an excel table with the actual data, the exact source of the data and the release date. This slide provides a graph of Automotive Segment Fleet Emissions in g CO2 km of the company BMW Group from the years 2014 to 18. Download it immediately and use it for your business.
-
 Bmw group automotive segment production forecast 2018-2022
This is a professionally designed visual chart for BMW Group Automotive Segment Production Forecast 2018 to 2022. This is part of our Data and Statistics products selection, and you will need a Paid account to download the actual report with accurate data and sources. Downloaded report will contain the editable graph with accurate data, an excel table with the actual data, the exact source of the data and the release date. This slide provides a graph of Automotive Segment Production in millions and showing the forecast for the year 2022 of the company BMW Group. Download it immediately and use it for your business.
-
 Bmw group automotive segment production volume 2014-18
This is a professionally designed visual chart for BMW Group Automotive Segment Production Volume 2014 to 18. This is part of our Data and Statistics products selection, and you will need a Paid account to download the actual report with accurate data and sources. Downloaded report will contain the editable graph with accurate data, an excel table with the actual data, the exact source of the data and the release date. This slide provides a stack chart showing the Automotive Segment Production Volume categorized by BMW, MINI and Rolls-Royce of the company BMW Group from the years 2014 to 18. Download it immediately and use it for your business.
-
 Bmw group automotive segment revenue 2014-18
This is a professionally designed visual chart for BMW Group Automotive Segment Revenue 2014 to 18. This is part of our Data and Statistics products selection, and you will need a Paid account to download the actual report with accurate data and sources. Downloaded report will contain the editable graph with accurate data, an excel table with the actual data, the exact source of the data and the release date. This slide provides a graph of Automotive Segment Revenue in JPY millions of the company BMW Group from the years 2014 to 18. Download it immediately and use it for your business.
-
 Bmw group automotive segment roce 2014-18
This is a professionally designed visual chart for BMW Group Automotive Segment ROCE 2014 to 18. This is part of our Data and Statistics products selection, and you will need a Paid account to download the actual report with accurate data and sources. Downloaded report will contain the editable graph with accurate data, an excel table with the actual data, the exact source of the data and the release date. This slide provides a graph of Automotive Segment RoCE in Percentage of the company BMW Group from the years 2014 to 18. Download it immediately and use it for your business.
-
 Bmw group automotive segment sales volume 2014-18
This is a professionally designed visual chart for BMW Group Automotive Segment Sales Volume 2014 to 18. This is part of our Data and Statistics products selection, and you will need a Paid account to download the actual report with accurate data and sources. Downloaded report will contain the editable graph with accurate data, an excel table with the actual data, the exact source of the data and the release date. This slide provides a stack chart showing the Automotive Segment Sales Volume categorized by BMW, MINI and Rolls-Royce of the company BMW Group from the years 2014 to 18. Download it immediately and use it for your business.
-
 Bmw group automotive segment sales volume by region 2017-2018
This is a professionally designed visual chart for BMW Group Automotive Segment Sales Volume By Region 2017 to 2018. This is part of our Data and Statistics products selection, and you will need a Paid account to download the actual report with accurate data and sources. Downloaded report will contain the editable graph with accurate data, an excel table with the actual data, the exact source of the data and the release date. This slide provides a pie chart showing the Automotive Segment Sales Volume by Region including Americas, Europe, Mainland China etc. in Percentage of the company BMW Group for the years 2017 to 2018. Download it immediately and use it for your business.
-
 Bmw group bmw and mini outlets in china 2018
This is a professionally designed visual chart for BMW Group BMW And Mini Outlets In China 2018. This is part of our Data and Statistics products selection, and you will need a Paid account to download the actual report with accurate data and sources. Downloaded report will contain the editable graph with accurate data, an excel table with the actual data, the exact source of the data and the release date. This slide depicts the BMW and MINI outlets in China of the company BMW Group for the year 2018. Download it immediately and use it for your business.
-
 Bmw group capital expenditure 2014-18
This is a professionally designed visual chart for BMW Group Capital Expenditure 2014 to 18. This is part of our Data and Statistics products selection, and you will need a Paid account to download the actual report with accurate data and sources. Downloaded report will contain the editable graph with accurate data, an excel table with the actual data, the exact source of the data and the release date. This slide provides a graph of Capital Expenditure in JPY millions of the company BMW Group from the years 2014 to 18. Download it immediately and use it for your business.
-
 Bmw group cash and cash equivalents at the end of the period 2014-18
This is a professionally designed visual chart for BMW Group Cash And Cash Equivalents At The End Of The Period 2014 to 18. This is part of our Data and Statistics products selection, and you will need a Paid account to download the actual report with accurate data and sources. Downloaded report will contain the editable graph with accurate data, an excel table with the actual data, the exact source of the data and the release date. This slide provides a graph of Cash and cash equivalents, at the end of the period in JPY million of the company BMW Group from the years 2014 to 18. Download it immediately and use it for your business.
-
 Bmw group cash flow from financing activities 2014-18
This is a professionally designed visual chart for BMW Group Cash Flow From Financing Activities 2014 to 18. This is part of our Data and Statistics products selection, and you will need a Paid account to download the actual report with accurate data and sources. Downloaded report will contain the editable graph with accurate data, an excel table with the actual data, the exact source of the data and the release date. This slide provides a graph of Cash Flow from Financing Activities in JPY millions of the company BMW Group from the years 2014 to 18. Download it immediately and use it for your business.
-
 Bmw group cash flow from investing activities 2014-18
This is a professionally designed visual chart for BMW Group Cash Flow From Investing Activities 2014 to 18. This is part of our Data and Statistics products selection, and you will need a Paid account to download the actual report with accurate data and sources. Downloaded report will contain the editable graph with accurate data, an excel table with the actual data, the exact source of the data and the release date. This slide provides a graph of Cash Flow from Investing Activities in JPY millions of the company BMW Group from the years 2014 to 18. Download it immediately and use it for your business.
-
 Bmw group cash flow from operating activities 2014-18
This is a professionally designed visual chart for BMW Group Cash Flow From Operating Activities 2014 to 18. This is part of our Data and Statistics products selection, and you will need a Paid account to download the actual report with accurate data and sources. Downloaded report will contain the editable graph with accurate data, an excel table with the actual data, the exact source of the data and the release date. This slide provides a graph of Cash Flow from Operating Activities in JPY millions of the company BMW Group from the years 2014 to 18. Download it immediately and use it for your business.
-
 Bmw group cost of sales 2014-18
This is a professionally designed visual chart for BMW Group Cost Of Sales 2014 to 18. This is part of our Data and Statistics products selection, and you will need a Paid account to download the actual report with accurate data and sources. Downloaded report will contain the editable graph with accurate data, an excel table with the actual data, the exact source of the data and the release date. This slide provides a graph of Cost of Sales in JPY millions of the company BMW Group from the years 2014 to 18. Download it immediately and use it for your business.


