Powerpoint Templates and Google slides for Graphing
Save Your Time and attract your audience with our fully editable PPT Templates and Slides.
-
 90 day timeline with circular graphics in middle powerpoint presentation slides
This deck comprises a total of a twelve of 90 Day Timeline With Circular Graphics In Middle Powerpoint Presentation Slides slides with each slide explained in detail. The slide is easily available in both 4:3 and 16:9 aspect ratio. The template is compatible with Google Slides, which makes it accessible at once. Modify the colors, fonts, font size, and font types of the slide as per the requirements. Can be changed into various formats like PDF, JPG, and PNG.
-
 4 Scenario Circular Graphic Shaped Curved Edges Petal Multisized
This complete deck can be used to present to your team. It has PPT slides on various topics highlighting all the core areas of your business needs. This complete deck focuses on 4 Scenario Circular Graphic Shaped Curved Edges Petal Multisized and has professionally designed templates with suitable visuals and appropriate content. This deck consists of total of twelve slides. All the slides are completely customizable for your convenience. You can change the colour, text and font size of these templates. You can add or delete the content if needed. Get access to this professionally designed complete presentation by clicking the download button below.
-
 Market graph sales volume banking contribution consumer goods
Introduce your topic and host expert discussion sessions with this Market Graph Sales Volume Banking Contribution Consumer Goods. This template is designed using high-quality visuals, images, graphics, etc, that can be used to showcase your expertise. Different topics can be tackled using the twelve slides included in this template. You can present each topic on a different slide to help your audience interpret the information more effectively. Apart from this, this PPT slideshow is available in two screen sizes, standard and widescreen making its delivery more impactful. This will not only help in presenting a birds-eye view of the topic but also keep your audience engaged. Since this PPT slideshow utilizes well-researched content, it induces strategic thinking and helps you convey your message in the best possible manner. The biggest feature of this design is that it comes with a host of editable features like color, font, background, etc. So, grab it now to deliver a unique presentation every time.
-
 Up Graph Business Performance Arrow Profitability Enhancement
If you require a professional template with great design, then this Up Graph Business Performance Arrow Profitability Enhancement is an ideal fit for you. Deploy it to enthrall your audience and increase your presentation threshold with the right graphics, images, and structure. Portray your ideas and vision using twelve slides included in this complete deck. This template is suitable for expert discussion meetings presenting your views on the topic. With a variety of slides having the same thematic representation, this template can be regarded as a complete package. It employs some of the best design practices, so everything is well-structured. Not only this, it responds to all your needs and requirements by quickly adapting itself to the changes you make. This PPT slideshow is available for immediate download in PNG, JPG, and PDF formats, further enhancing its usability. Grab it by clicking the download button.
-
 Industrial Robots V2 Performance Tracking Dashboard Ppt Ideas Graphic Images
This slide shows the dashboard to keep a regular track of the performance of industrial robots. The purpose of this slide is to provide a graphical representation of robots performance to enhance the accuracy and effectiveness of these machines. Deliver an outstanding presentation on the topic using this Industrial Robots V2 Performance Tracking Dashboard Ppt Ideas Graphic Images. Dispense information and present a thorough explanation of Industrial Robots Performance, Tracking Dashboard, Graphical Representation using the slides given. This template can be altered and personalized to fit your needs. It is also available for immediate download. So grab it now.
-
 Fj eight staged circular bar graph style diagram powerpoint template
Presenting fj eight staged circular bar graph style diagram powerpoint template. Eight staged circular bar graph diagram and icons has been used to design this PPT diagram. This PPT diagram contains the concept of business result analysis. Use this PPT diagram for business and marketing related presentations.
-
 Cp eight staged business pie graph and icons powerpoint template
Presenting cp eight staged business pie graph and icons powerpoint template. Eight staged business pie graph and icons has been used to craft this power point template diagram. This PPT diagram contains the concept of result analysis and marketing strategy. Use this PPT diagram for business and marketing related presentations.
-
 En graphic of data processing diagram powerpoint template
Presenting en graphic of data processing diagram powerpoint template. This Power Point template diagram has been crafted with graphic of data [processing diagram. This PPT diagram contains the concept of data process flow representation. Use this PPT diagram for business and finance related presentations.
-
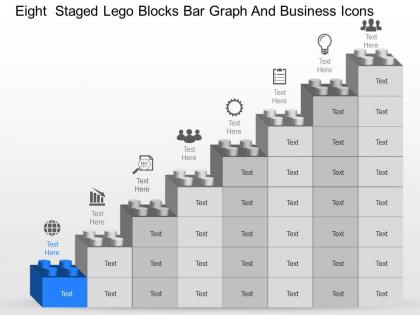 Eight staged lego blocks bar graph and business icons powerpoint template slide
We are proud to present our eight staged lego blocks bar graph and business icons powerpoint template slide. Eight staged Lego blocks and bar graph diagram has been used to craft this power point template diagram. This PPT diagram contains the concept of business result analysis. Use this PPT diagram for business and marketing related presentations.
-
 Mb eight staged bar graph with icons sales planning powerpoint template slide
Presenting mb eight staged bar graph with icons sales planning powerpoint template slide. Eight staged bar graph and icons has been used to craft this power point template diagram. This PPT diagram contains the concept of sales planning. Use this PPT diagram for sales and business related presentation.
-
 Seven staged pie graph for business application flat powerpoint design
We are proud to present our seven staged pie graph for business application flat powerpoint design. Seven staged pie graph has been used to craft this power point template diagram. This PPT diagram contains the concept of business application. Use this PPT diagram for business and marketing related presentations.
-
 Puzzle graphics for interpretation guidelines 6 stages flow chart business powerpoint templates
We are proud to present our puzzle graphics for interpretation guidelines 6 stages flow chart business powerpoint templates. This puzzle diagram is a graphical representation of a process. Steps in a process are shown with these puzzle shapes. It helps you to reassure the faith of your workers and get them to back you all the way.
-
 Powerpoint graphics business of 3d distribution data pie chart 6 stages slides
We are proud to present our powerpoint graphics business of 3d distribution data pie chart 6 stages slides. Business PowerPoint Diagram is a collection of pie diagrams. Use this diagram for presentations related to marketing research, consumer marketing research, business-to-business, marketing research, qualitative marketing research, quantitative marketing research, etc.
-
 3d colorful business concept 7 stages powerpoint templates graphics slides 0712
This circle diagram is a useful graphic which helps in divide information in 7 categories and create correlations.
-
 3d puzzle structure 7 stages powerpoint templates graphics slides 0712
The 3D Puzzle structure is by all means a good idea for business presentations highlighting most various aspects
-
 3d round moving process 6 stages powerpoint templates graphics slides 0712
Use these graphics for most important events during the event identification and analysis stage.
-
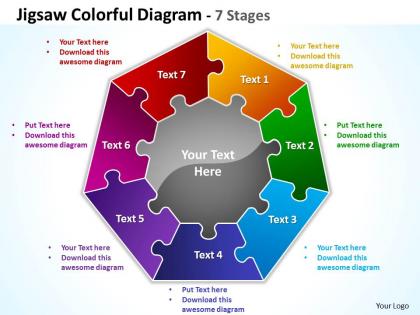 Jigsaw colorful diagram 7 stages powerpoint templates graphics slides 0712
You can use these diagrams also for explaining the solution of more general problems
-
 Life cycle process 7 stages powerpoint templates graphics slides 0712
This diagram has the unique ability to explain route cause analysis.
-
 Linear nonstop process 7 stages powerpoint templates graphics slides 0712
Linear Diagram for Microsoft PowerPoint to visualize current projects within a certain time or periodical section
-
 Production process 7 stages powerpoint templates graphics slides 0712
This diagram is a wonderful graphics to focus on directions of many business production processes
-
 3d rotation chart 7 stages powerpoint diagrams presentation slides graphics 0912
Use this chart to show a progression or a sequence of stages, tasks, or events in a circular flow. Emphasizes the interconnected pieces.
-
 7 factors of organizational change powerpoint diagrams presentation slides graphics 0912
You can begin creating a presentation by using this pre-designed diagram, and move on to custom-designing them in time.
-
 Business operation chart 7 stages powerpoint diagrams presentation slides graphics 0912
Use this graphics as key element in streamlining your plans.In fact, your plan may be more successful if it is not
-
 Circular balanced layout 7 stages powerpoint diagrams presentation slides graphics 0912
use this chart for an effective way of displaying information you can edit text, color, shade and style as per you need.
-
 Circular input process 7 stages powerpoint diagrams presentation slides graphics 0912
This simple & clean circular diagram is a nice little element to add to your next corporate design project.
-
 Circular study picture 7 stages powerpoint diagrams presentation slides graphics 0912
The various components of national income and expenditure such as saving, investment, taxation, government expenditure, exports, imports etc. can be shown in this diagram.
-
 Rounded arrow action 7 stages powerpoint diagrams presentation slides graphics 0912
This Chart can be used to display the system of an organization in terms of relationships among personnel or departments
-
 Round cycle chart 7 stages powerpoint diagrams presentation slides graphics 0912
Use it to represent a series of interconnected ideas. Use this diagram to explain complex and difficult business strategic planning & staff development.
-
 Seven topics chart powerpoint diagrams presentation slides graphics 0912
Use these circle charts to make your team understand different topics.
-
 3d circular arrows process smartart 7 stages ppt slides diagrams templates powerpoint info graphics
These high quality, editable pre-designed 3d circular arrows process smartart 7 stages ppt slides diagrams templates powerpoint info graphics powerpoint slides and powerpoint templates have been carefully created by our professional team to help you impress your audience. Each graphic in every powerpoint slide is vector based and is 100% editable in powerpoint.
-
 3d pyramid cone diagram 7 levels split separated slides diagrams templates powerpoint info graphics
These high quality, editable pre-designed 3d pyramid cone diagram 7 levels split separated slides diagrams templates powerpoint info graphics powerpoint slides and powerpoint templates have been carefully created by our professional team to help you impress your audience. Each graphic in every powerpoint slide is vector based and is 100% editable in powerpoint.
-
 7 different views on issue inward facing arrows ppt slides diagrams templates powerpoint info graphics
These high quality, editable pre-designed 7 different views on issue inward facing arrows ppt slides diagrams templates powerpoint info graphics powerpoint slides and powerpoint templates have been carefully created by our professional team to help you impress your audience. Each graphic in every powerpoint slide is vector based and is 100% editable in powerpoint.
-
 Sales and marketing funnel diagram style 1 slides diagrams templates powerpoint info graphics
These high quality, editable pre-designed sales and marketing funnel diagram style 1 slides diagrams templates powerpoint info graphics powerpoint slides and powerpoint templates have been carefully created by our professional team to help you impress your audience. Each graphic in every powerpoint slide is vector based and is 100% editable in powerpoint.
-
 Wheel diagram ppt slides presentation diagrams templates powerpoint info graphics
These high quality, editable pre-designed wheel diagram ppt slides presentation diagrams templates powerpoint info graphics powerpoint slides and powerpoint templates have been carefully created by our professional team to help you impress your audience. Each graphic in every powerpoint slide is vector based and is 100% editable in powerpoint.
-
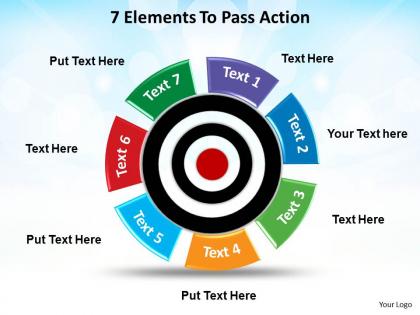 7 elements to pass action with bullseye in center powerpoint diagram templates graphics 712
These high quality, editable pre-designed 7 elements to pass action with bullseye in center powerpoint diagram templates graphics 712 powerpoint slides and powerpoint templates have been carefully created by our professional team to help you impress your audience. Each graphic in every powerpoint slide is vector based and is 100% editable in powerpoint.
-
 7 sources hexagon powerpoint diagram templates graphics 712
These high quality, editable pre-designed 7 sources hexagon powerpoint diagram templates graphics 712 powerpoint slides and powerpoint templates have been carefully created by our professional team to help you impress your audience. Each graphic in every powerpoint slide is vector based and is 100% editable in powerpoint.
-
 7 stream conference powerpoint diagram templates graphics 712
These high quality, editable pre-designed 7 stream conference powerpoint diagram templates graphics 712 powerpoint slides and powerpoint templates have been carefully created by our professional team to help you impress your audience. Each graphic in every powerpoint slide is vector based and is 100% editable in powerpoint.
-
 Circling chart 6 degrees with arrows connected powerpoint diagram templates graphics 712
These high quality, editable pre-designed circling chart 6 degrees with arrows connected powerpoint diagram templates graphics 712 powerpoint slides and powerpoint templates have been carefully created by our professional team to help you impress your audience. Each graphic in every powerpoint slide is vector based and is 100% editable in powerpoint.
-
 Concepts of circular procedure 7 stages powerpoint diagram templates graphics 712
These high quality, editable pre-designed concepts of circular procedure 7 Stages powerpoint diagram templates graphics 712 powerpoint slides and powerpoint templates have been carefully created by our professional team to help you impress your audience. Each graphic in every powerpoint slide is vector based and is 100% editable in powerpoint.
-
 Oval arrows 7 points powerpoint diagram templates graphics 712
These high quality, editable pre-designed oval arrows 7 points powerpoint diagram templates graphics 712 powerpoint slides and powerpoint templates have been carefully created by our professional team to help you impress your audience. Each graphic in every powerpoint slide is vector based and is 100% editable in powerpoint.
-
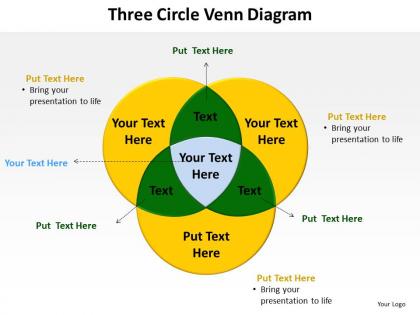 Three circle venn diagram to educate children and show overlap powerpoint diagram templates graphics 712
These high quality, editable pre-designed three circle venn diagram to educate children and show overlap powerpoint diagram templates graphics 712 powerpoint slides and powerpoint templates have been carefully created by our professional team to help you impress your audience. Each graphic in every powerpoint slide is vector based and is 100% editable in powerpoint.
-
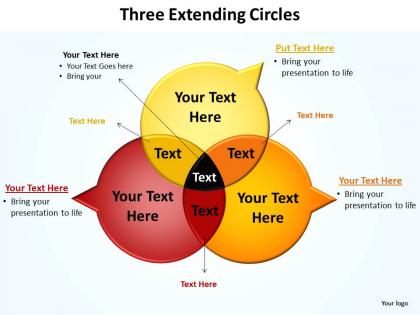 Three extending circles shown as venn diagrams with pointers powerpoint diagram templates graphics 712
These high quality, editable pre-designed three extending circles shown as venn diagrams with pointers powerpoint diagram templates graphics 712 powerpoint slides and powerpoint templates have been carefully created by our professional team to help you impress your audience. Each graphic in every powerpoint slide is vector based and is 100% editable in powerpoint.
-
 3d graphical example of 5 stages flow chart cycle network powerpoint slides
Use this diagram to describe data processes. You can use this diagram to assist in data analysis or show the flow of information for a process. This is an excellent communication tool for analysts to model processes and functional requirements.
-
 Stacked blue graphics 6 stages
This template is skillfully designed and is completely editable to suit all the needs and requirements of the user. The color of the font, its size, style, and all other elements can be customized according to the user's desire The text in the PPT placeholder can be replaced with the desired information making this template highly flexible and adaptable as well. This template is also compatible with various Microsoft versions and formats like Google Slides, JPG, PDF, etc so the user will face no issue in saving it in the format of his choice.
-
 6 step in a pyramid diagram slides presentation diagrams templates powerpoint info graphics
We are proud to present our 6 step in a pyramid diagram slides presentation diagrams templates powerpoint info graphics. Our business Power Point Templates Are Aesthetically Designed To Attract Attention. We Guarantee That They Will Grab All The Eyeballs You Need. Our shapes Power Point Templates Are Specially Created By A Professional Team With Vast Experience. They Diligently Strive To Come Up With The Right Vehicle For Your Brilliant Ideas.
-
 Circular process 6 concepts powerpoint diagram templates graphics 712
We are proud to present our circular process 6 concepts powerpoint diagram templates graphics 712. Our business Power Point Templates Are The Chords Of Your Song. String Them Along And Provide The Lilt To Your Views. Our process Power Point Templates Help You Pinpoint Your Timelines. Highlight The Reasons For Your Deadlines With Their Use.
-
 1013 busines ppt diagram circular graphics to show 6 stages powerpoint template
We are proud to present our 1013 busines ppt diagram circular graphics to show 6 stages powerpoint template. Timeline Crunches Are A Fact Of Life. Meet All Deadlines Using Our Arrows Power Point Templates. Connect The Dots Using Our Business Power Point Templates. Fan Expectations As The Whole Picture Emerges.
-
 0620 management consulting companies 6 stages info graphic technical illustration ppt backgrounds for slides
We are proud to present our 0620 management consulting companies 6 stages info graphic technical illustration ppt backgrounds for slides. Whatever the nuance you want to project. We have a Strategy Powerpoint Templates that will get it across. Create a connection with your audience using our Process Powerpoint Templates. Transfer your depth of knowledge clearly across to them.
-
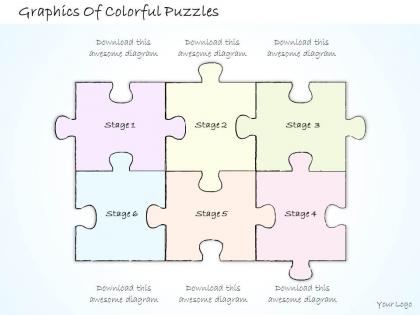 2502 business ppt diagram graphics of colorful puzzles powerpoint template
We are proud to present our 2502 business ppt diagram graphics of colorful puzzles powerpoint template. Our 2502 Business Ppt diagram Graphics Of Colorful Puzzles Powerpoint Template Power Point Templates Will Generate And Maintain The Level Of Interest You Desire. They Will Create The Impression You Want To Imprint On Your Audience. Our puzzles Power Point Templates Are Effectively Color Coded To Priorities Your Plans. They Automatically Highlight The Sequence Of Events You Desire.
-
 1814 business ppt diagram 5 staged business info graphics diagram powerpoint template
Presentation template attuned well with Google slides. Alter the PPT diagram by addition of business label. One click download and simple to transform into JPEG and PDF document. Precise and easy to comprehend information. Top quality PowerPoint slide. Preference to present design in standard and widescreen display view. PowerPoint design can be downloaded with different nodes and stages. Perfect for marketing professionals, business process control team, superintendents and strategists experts.
-
 1814 business ppt diagram 3 staged venn graphics for business powerpoint template
We are proud to present our 1814 business ppt diagram 3 staged venn graphics for business powerpoint template. A three staged Venn diagram graphic is used in this Business Power Point template. To define three different stages of any business process use this template in your presentation.
-
 Seven staged colored infographics with news mail microscope bar graph flat powerpoint design
Extravagant PPT design patterns for providing the incredible concept realization useful for different business experts from diverse sectors, An exclusive extent of malleable PPT icons and designs , Rearrange able magnitude and intensity for the Presentation images or icons, Flexibility to customize the same into divergent configurations like PDF or JPG , unaffected high resolution Presentation graphics .
-
 Belarus Ppt Professional Graphics Download Belarus With Pin Points
This PPT deck displays eleven slides with in depth research. Our topic oriented Belarus Ppt Professional Graphics Download Belarus With Pin Points presentation deck is a helpful tool to plan, prepare, document and analyse the topic with a clear approach. We provide a ready to use deck with all sorts of relevant topics subtopics templates, charts and graphs, overviews, analysis templates. Outline all the important aspects without any hassle. It showcases of all kind of editable templates infographs for an inclusive and comprehensive Belarus Ppt Professional Graphics Download Belarus With Pin Points presentation. Professionals, managers, individual and team involved in any company organization from any field can use them as per requirement.
-
 Employee Experience Ppt Inspiration Graphics Download Rapid Technological Change
It covers all the important concepts and has relevant templates which cater to your business needs. This complete deck has PPT slides on Employee Experience Ppt Inspiration Graphics Download Rapid Technological Change with well suited graphics and subject driven content. This deck consists of total of eleven slides. All templates are completely editable for your convenience. You can change the colour, text and font size of these slides. You can add or delete the content as per your requirement. Get access to this professionally designed complete deck presentation by clicking the download button below.
-
 Population Icon Demographic Segregation Arrow Graph Displaying
It has PPT slides covering wide range of topics showcasing all the core areas of your business needs. This complete deck focuses on Population Icon Demographic Segregation Arrow Graph Displaying and consists of professionally designed templates with suitable graphics and appropriate content. This deck has total of eleven slides. Our designers have created customizable templates for your convenience. You can make the required changes in the templates like colour, text and font size. Other than this, content can be added or deleted from the slide as per the requirement. Get access to this professionally designed complete deck PPT presentation by clicking the download button below.
-
 Stop Start Continue Change Process Organizational Measurable Performance Square Graphic
This complete deck can be used to present to your team. It has PPT slides on various topics highlighting all the core areas of your business needs. This complete deck focuses on Stop Start Continue Change Process Organizational Measurable Performance Square Graphic and has professionally designed templates with suitable visuals and appropriate content. This deck consists of total of eleven slides. All the slides are completely customizable for your convenience. You can change the colour, text and font size of these templates. You can add or delete the content if needed. Get access to this professionally designed complete presentation by clicking the download button below.
-
 Six Questions Circular Teamwork Solution Management Circles Arrow Graphics
It covers all the important concepts and has relevant templates which cater to your business needs. This complete deck has PPT slides on Six Questions Circular Teamwork Solution Management Circles Arrow Graphics with well suited graphics and subject driven content. This deck consists of total of eleven slides. All templates are completely editable for your convenience. You can change the colour, text and font size of these slides. You can add or delete the content as per your requirement. Get access to this professionally designed complete deck presentation by clicking the download button below.
-
 Year Over Year Growth Business Graph Revenue Operation Organization Strategy Location Comparison
This complete presentation has PPT slides on wide range of topics highlighting the core areas of your business needs. It has professionally designed templates with relevant visuals and subject driven content. This presentation deck has total of eleven slides. Get access to the customizable templates. Our designers have created editable templates for your convenience. You can edit the colour, text and font size as per your need. You can add or delete the content if required. You are just a click to away to have this ready-made presentation. Click the download button now.
-
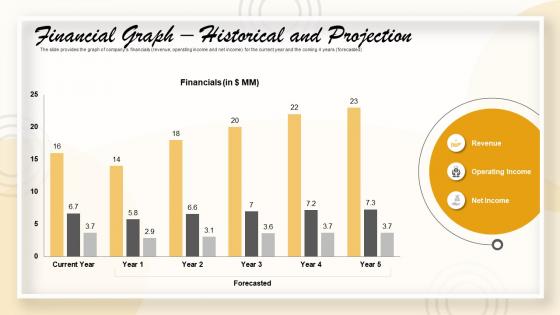 Pitch deck to raise funding from short term financial graph historical and projection
The slide provides the graph of companys financials revenue, operating income and net income for the current year and the coming 4 years forecasted Deliver an outstanding presentation on the topic using this Pitch Deck To Raise Funding From Short Term Financial Graph Historical And Projection. Dispense information and present a thorough explanation of Financial Graph Historical And Projection using the slides given. This template can be altered and personalized to fit your needs. It is also available for immediate download. So grab it now.
-
 Shipping vendor scorecard shipping vendor spend scorecard summary in graph
Deliver an outstanding presentation on the topic using this Shipping Vendor Scorecard Shipping Vendor Spend Scorecard Summary In Graph. Dispense information and present a thorough explanation of Shipping Vendor Spend Scorecard Summary In Graph using the slides given. This template can be altered and personalized to fit your needs. It is also available for immediate download. So grab it now.


