Powerpoint Templates and Google slides for Graphing
Save Your Time and attract your audience with our fully editable PPT Templates and Slides.
-
 Nl three staged arrow bar graph idea generation powerpoint template slide
Presenting nl three staged arrow bar graph idea generation powerpoint template slide. Three staged arrow bar graph diagram and icons has been used to craft this power point template diagram. This PPT diagram contains the concept of growth indication and idea generation. Use this PPT diagram for marketing and business related presentation.
-
 Np three staged lego blocks bar graph with icons powerpoint template slide
Presenting np three staged lego blocks bar graph with icons powerpoint template slide. Three staged Lego block, bar graph with icons has been used to craft this power point template diagram. This PPT diagram contains the concept of business planning and result analysis. Use this PPT diagram for marketing and business related presentations.
-
 Ah three staged linear finger pointing graphics powerpoint template slide
Presenting ah three staged linear finger pointing graphics powerpoint template slide. Three staged linear finger pointing graphics has been used to craft this power point template icon diagram. This icon PPT contains the concept of highlighting the main issue. Use this icon template for business and marketing related presentations.
-
 Ups joystick scanner tablet ppt icons graphics
We are proud to present our ups joystick scanner tablet ppt icons graphics. Graphic of UPS,joystick and scanner with tablet icons has been used to craft this power point icon template diagram. This icon template diagram contains the concept of data transfer and power backup. Use this ion template for power and data related presentations.
-
 Go graphic of rubik cube for process flow powerpoint template
Presenting go graphic of rubik cube for process flow powerpoint template. This Power Point template diagram has been crafted with graphic of Rubik cube diagram. This PPT diagram contains the concept of business process flow and data representation. Use this PPT diagram and build an exclusive presentation.
-
 Jc 3 staged venn graphics for business powerpoint template
Presenting jc 3 staged venn graphics for business powerpoint template. This Power Point template diagram has been crafted with graphic of three staged Venn graphics diagram. This PPT diagram contains the concept of business result analysis representation. Use this PPT diagram for business and marketing related presentations.
-
 Id computer with bar growth graph powerpoint template
Presenting id computer with bar growth graph powerpoint template. This Power Point template diagram has been crafted with graphic of computer and bar graph. This PPT diagram contains the concept of growth analysis. Use this PPT diagram for business and technology related presentations.
-
 Download pie graph growth target board modern graphic powerpoint template
Presenting download pie graph growth target board modern graphic powerpoint template. This Power Point template diagram has been crafted with graphic of pie graph and target board. This PPT diagram contains the concept of business target achievement representation. Use this PPT diagram for business and sales related presentations.
-
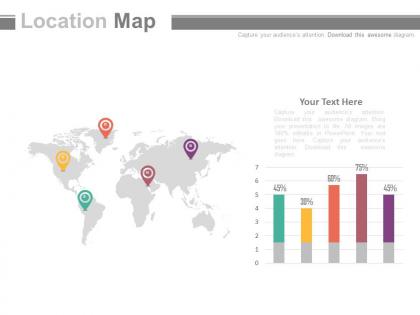 World map with bar graph result analysis powerpoint slides
Presenting world map with bar graph result analysis powerpoint slides. This is a world map with bar graph result analysis powerpoint slides. This is a five stage process. The stages in this process are company location.
-
 Maze diagram for business problem statement powerpoint graphics
Presenting maze diagram for business problem statement powerpoint graphics. This is a maze diagram for business problem statement powerpoint graphics. This is a one stage process. The stages in this process are the problem, problem and solution, problem statement risk mitigation strategies.
-
 Current state future state line graph powerpoint slide deck template
Presenting current state future state line graph powerpoint slide deck template. This is a current state future state line graph powerpoint slide deck template. This is a two stage process. The stages in this process are problem solution, current state future state, before after, challenges solutions, compare, comparison.
-
 Before versus after comparison 4 text boxes powerpoint graphics
Presenting before versus after comparison 4 text boxes powerpoint graphics. This is a before versus after comparison 4 text boxes powerpoint graphics. This is a two stage process. The stages in this process are problem solution, current state future state, before after, challenges solutions, compare, comparison.
-
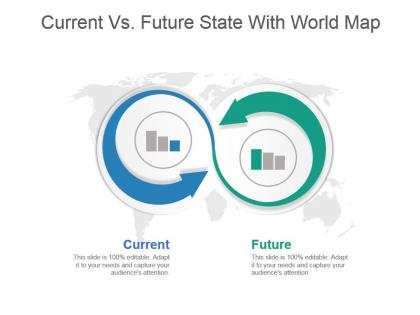 Current vs future state with world map powerpoint slide graphics
Presenting current vs future state with world map PowerPoint slide graphics template. The PPT is professionally made by our designers which can be customized according to your requirements. You only have to replace the dummy text with your original presentation content in the space provided. Our slides can also be personalized by adding your company name and logo in it. The biggest advantage of downloading our slides is that you get to use it in both widescreen and standard screen format and either saving it in a PDF or JPG format too. The slide is fully compatible with Google Slides and can be downloaded fast at the click of a button.
-
 Visual resume ppt sample for graphic designer
Presenting visual resume ppt sample for graphic designer. This is a visual resume ppt sample for graphic designer. This is a one stage process. The stages in this process are keywords visual resume, cv, curriculum vitae, self introduction, about us.
-
 Ecosystem of business image with home people globe graph briefcase image
Presenting this set of slides with name - Ecosystem Of Business Image With Home People Globe Graph Briefcase Image. This is a one stage process. The stages in this process are Environment, Ecosystem, Community.
-
 Trade marketing info graphics
Presenting this set of slides with name - Trade Marketing Info Graphics. This is a six stage process. The stages in this process are Trade Marketing Strategy, Trade Promotion Strategy, Trade Sales Plan.
-
 Business kpi showing employee analysing the graph of companys performance indicator
Presenting this set of slides with name - Business Kpi Showing Employee Analysing The Graph Of Companys Performance Indicator. This is a four stage process. The stages in this process are Business Kpi, Business Dashboard, Business Metrics.
-
 Interdependence team holding hands graphic
Presenting this set of slides with name - Interdependence Team Holding Hands Graphic. This is a four stage process. The stages in this process are Interdependence, Rely On Each Other, Relationship.
-
 Profit patterns with increasing bar graphs showing quarter
Presenting this set of slides with name - Profit Patterns With Increasing Bar Graphs Showing Quarter. This is a three stage process. The stages in this process are Engineering, Procurement And Construction, Construction Management, Engineering, Purchasing And Construction .
-
 Quantitative bar graph chart showing survey respondents
Presenting this set of slides with name - Quantitative Bar Graph Chart Showing Survey Respondents. This is a five stage process. The stages in this process are Quantitative, Financial Analysis, Statistical Modelling.
-
 Business kpi showing graphs key performance indicator in tablets and documents
Presenting this set of slides with name - Business Kpi Showing Graphs Key Performance Indicator In Tablets And Documents. This is a four stage process. The stages in this process are Business Kpi, Business Dashboard, Business Metrics.
-
 Business kpi showing key performance indicator of company through target point and line graph
Presenting this set of slides with name - Business Kpi Showing Key Performance Indicator Of Company Through Target Point And Line Graph. This is a three stage process. The stages in this process are Business Kpi, Business Dashboard, Business Metrics.
-
 Business kpi showing summary of key performance indicator data representation in line graph and pie chart
Presenting this set of slides with name - Business Kpi Showing Summary Of Key Performance Indicator Data Representation In Line Graph And Pie Chart. This is a three stage process. The stages in this process are Business Kpi, Business Dashboard, Business Metrics.
-
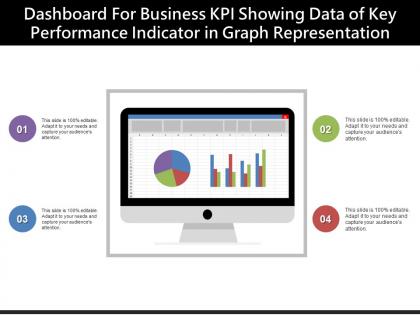 Dashboard for business kpi showing data of key performance indicator in graph representation
Presenting this set of slides with name - Dashboard For Business Kpi Showing Data Of Key Performance Indicator In Graph Representation. This is a four stage process. The stages in this process are Business Kpi, Business Dashboard, Business Metrics.
-
 Employee looking at the graph of business kpi in tablet covering bar graphs and pie charts
Presenting this set of slides with name - Employee Looking At The Graph Of Business Kpi In Tablet Covering Bar Graphs And Pie Charts. This is a four stage process. The stages in this process are Business Kpi, Business Dashboard, Business Metrics.
-
 Graphical representation of business kpi with employee working on data doing calculations
Presenting this set of slides with name - Graphical Representation Of Business Kpi With Employee Working On Data Doing Calculations. This is a four stage process. The stages in this process are Business Kpi, Business Dashboard, Business Metrics.
-
 Summary of key performance showing graphical representation of business kpi in bar graphs and pie charts
Presenting this set of slides with name - Summary Of Key Performance Showing Graphical Representation Of Business Kpi In Bar Graphs And Pie Charts. This is a three stage process. The stages in this process are Business Kpi, Business Dashboard, Business Metrics.
-
 Visualization representation of business kpi data showing chart and graph of financial data
Presenting this set of slides with name - Visualization Representation Of Business Kpi Data Showing Chart And Graph Of Financial Data. This is a four stage process. The stages in this process are Business Kpi, Business Dashboard, Business Metrics.
-
 Facts chart graph report writing and analysis
Presenting this set of slides with name - Facts Chart Graph Report Writing And Analysis. This is a one stage process. The stages in this process are Facts, Factual, Reality.
-
 Facts pie chart graph business report review
Presenting this set of slides with name - Facts Pie Chart Graph Business Report Review. This is a three stage process. The stages in this process are Facts, Factual, Reality.
-
 Project contributors graph of evaluation of contribution over project lifetime in number
Presenting this set of slides with name - Project Contributors Graph Of Evaluation Of Contribution Over Project Lifetime In Number. This is a ten stage process. The stages in this process are Contributor, Writer, Reporter.
-
 Business opportunity and consulting man with bar graph
Presenting this set of slides with name - Business Opportunity And Consulting Man With Bar Graph. This is a four stage process. The stages in this process are Business Opportunity, Business Development.
-
 Drill down bar graph to pie chart
Presenting this set of slides with name - Drill Down Bar Graph To Pie Chart. This is a two stage process. The stages in this process are Drill Down, Hierarchy, Top Downwards.
-
 Drill down bar graph to semi circular pie chart
Presenting this set of slides with name - Drill Down Bar Graph To Semi Circular Pie Chart. This is a two stage process. The stages in this process are Drill Down, Hierarchy, Top Downwards.
-
 Drill down country wise breakdown having bar graph and pie chart
Presenting this set of slides with name - Drill Down Country Wise Breakdown Having Bar Graph And Pie Chart. This is a three stage process. The stages in this process are Drill Down, Hierarchy, Top Downwards.
-
 Drill down month wise pie chart and day wise bar graph
Presenting this set of slides with name - Drill Down Month Wise Pie Chart And Day Wise Bar Graph. This is a two stage process. The stages in this process are Drill Down, Hierarchy, Top Downwards.
-
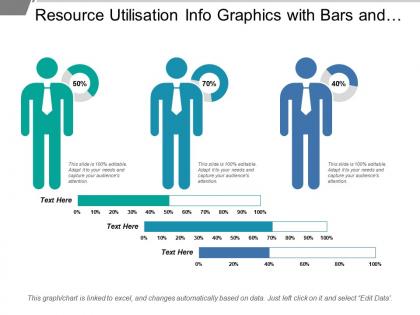 Resource utilisation info graphics with bars and graphs
Presenting this set of slides with name - Resource Utilisation Info Graphics With Bars And Graphs. This is a three stage process. The stages in this process are Resource Management, Resource Utilization, Resource Allocation.
-
 3d graphs business bar chart and pie chart with icons
Presenting this set of slides with name - 3d Graphs Business Bar Chart And Pie Chart With Icons. This is a two stage process. The stages in this process are Paint Brush, Art, Coloring.
-
 Five options business 3d bar graph for data comparison
Presenting this set of slides with name - Five Options Business 3d Bar Graph For Data Comparison. This is a five stage process. The stages in this process are Paint Brush, Art, Coloring.
-
 Hr dashboard employee age breakdown graph donut chart
Presenting this set of slides with name - Hr Dashboard Employee Age Breakdown Graph Donut Chart. This is a four stage process. The stages in this process are Hr Dashboard, Human Resource Dashboard, Hr Kpi.
-
 Hr dashboard shown by humans and bar graphs
Presenting this set of slides with name - Hr Dashboard Shown By Humans And Bar Graphs. This is a three stage process. The stages in this process are Hr Dashboard, Human Resource Dashboard, Hr Kpi.
-
 Percentage comparison showing data comparison through bar graph and line graph
Presenting this set of slides with name - Percentage Comparison Showing Data Comparison Through Bar Graph And Line Graph. This is a four stage process. The stages in this process are Percentage Comparison, Percentage Compare, Percentage Balancing.
-
 Product roadmap timeline 2013 to 2018 graphical representation of technologies powerpoint templates slides
Ready to use template theme which saves time also , Fully customizable Presentation designs, text, font, colors and layout, Unaffected High resolution PPT slides even after customization, Well compatible with all the software’s and Google slides, Graphical visuals to incisively penetrate audience, Convertible into PDF or JPG formats, Easy to replace dummy PPT images with your logo or trademark.
-
 Product roadmap timeline technology bar graph 2013 to 2020 powerpoint templates slides
Use of high-resolution images. Allow instant replacement of the icons or the images. Customize the background, orientation or size of the images or icons. Offered instructions to make changes and modify the slide icons. Useful for the business entrepreneurs, business presenters and the team leaders.
-
 3d business circular process 2 stages powerpoint templates graphics slides 0712
Use these circle diagram to make your team understand complex processes.
-
 Two sided business diagram powerpoint templates graphics slides 0712
This Chart is suitable to present chronological episodes, processes or relationship charts
-
 Two way process circular chart powerpoint templates graphics slides 0712
Complete your presentation and convince your audience with high quality design.
-
 2 contributing causes powerpoint diagrams presentation slides graphics 0912
With the assistance of this Diagram, you can can uncover chains of causal links that will lead you to contributing factors of the problem and allow them to implement effective barriers and solutions.
-
 3d circular approach chart 2 stages powerpoint diagrams presentation slides graphics 0912
3D Circular Chart in red and green color can be helpful on explaining two different approaches for business process
-
 Circular method diagram 2 stages powerpoint diagrams presentation slides graphics 0912
Use this diagram to mention the facts and figures effectively.
-
 Circular process flow diagram 2 stages powerpoint diagrams presentation slides graphics 0912
Use this graphics to show functional areas will be held accountable for achieving performance metrics established for that area.
-
 Global economic circular chart 2 stages powerpoint diagrams presentation slides graphics 0912
This chart makes employees more productive, helping them understand company strategy and structure.
-
 Round annual graph 8 stages powerpoint diagrams presentation slides graphics 0912
This diagram is a graphical illustration of the relationships between and among sets of data, groups of objects that share something in common
-
 Round arrow process 2 stages powerpoint diagrams presentation slides graphics 0912
Round Cycle chart is an effective way of displaying information you can edit text, color, shade and style as per you need.
-
 Half yearly plan shown by pie chart split up powerpoint diagram templates graphics 712
These high quality, editable pre-designed half yearly plan shown by pie chart split up powerpoint diagram templates graphics 712 powerpoint slides and powerpoint templates have been carefully created by our professional team to help you impress your audience. Each graphic in every powerpoint slide is vector based and is 100% editable in powerpoint.
-
 Product roadmap timeline 2d linear graph illustrating future technologies powerpoint templates slides
We are proud to present our product roadmap timeline 2d linear graph illustrating future technologies powerpoint templates slides. This PPT slide is perfect to show future economic, social, technological, and environmental conditions. The mind is always whirring with new ideas. Put them down and present them using our innovative Diagram. Activate the minds of your team with your ideas. Illustrate to them how it will take them to the very top.
-
 Business powerpoint templates blue pieces of strategy puzzle icon graph sales ppt slides
It is all there in bits and pieces. Individual components well researched and understood in their place. Now you need to get it all together to form the complete picture and reach the goal. You have the ideas and plans on how to go about it. Use this template to illustrate your method, piece by piece, and interlock the whole process in the minds of your audience. It is a 16x15 240 pieces 3D Rectangular Jigsaw Puzzle Matrix.
-
 Strategy consultant decay bar graph for business powerpoint templates ppt backgrounds slides 0618
We are proud to present our strategy consultant decay bar graph for business powerpoint templates ppt backgrounds slides 0618. Let our Marketing powerpoint templates give the updraft to your ideas. See them soar to great heights with ease. Timeline crunches are a fact of life. Meet all deadlines using our Strategy powerpoint templates.
-
 Mind map graph chart
This template is skillfully designed and is completely editable to suit all the needs and requirements of the user. The color of the font, its size, style, and all other elements can be customized according to the user's desire The text in the PPT placeholder can be replaced with the desired information making this template highly flexible and adaptable as well. This template is also compatible with various Microsoft versions and formats like Google Slides, JPG, PDF, etc so the user will face no issue in saving it in the format of his choice.
-
 1013 business ppt diagram graphical representation of technologies powerpoint template
We are proud to present our 1013 business ppt diagram graphical representation of technologies powerpoint template. Use this PowerPoint Diagram for business, educational topics, marketing research, technology, etc. This Business Flow diagram consists steps and levels for representation of relationships and structures. Create captivating presentations to deliver comparative and weighted arguments.


