Powerpoint Templates and Google slides for Graphing Data
Save Your Time and attract your audience with our fully editable PPT Templates and Slides.
-
 Global Market Size Graph Of Data Visualization Tools
This slide depicts data visualization market size tools to provide details about interpreting information in visual format. It includes bases such as key drivers, key players, and restraining factors. Presenting our well structured Global Market Size Graph Of Data Visualization Tools. The topics discussed in this slide are Global Data Visualization Tools, Market Size, Key Drivers, Key Players, Restraining Factors. This is an instantly available PowerPoint presentation that can be edited conveniently. Download it right away and captivate your audience.
-
 Graph Illustrating Big Data Analytics Tools In E Commerce
This slide showcases the statistical graph highlighting big data analytics in e-commerce which helps an organization to understand best and most used tool by businesses. It include details such as records customers entire journey, provides in-depth understanding of markets behavior, etc. Introducing our Graph Illustrating Big Data Analytics Tools In E Commerce set of slides. The topics discussed in these slides are E-Commerce Businesses, Key Insights, Key Reasons. This is an immediately available PowerPoint presentation that can be conveniently customized. Download it and convince your audience.
-
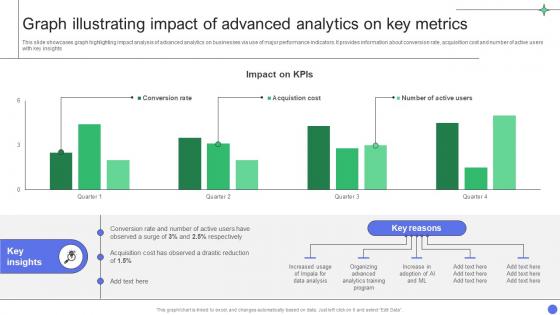 A Comprehensive Guide Graph Illustrating Impact Of Advanced Analytics On Key Metrics Data Analytics SS
This slide showcases graph highlighting impact analysis of advanced analytics on businesses via use of major performance indicators. It provides information about conversion rate, acquisition cost and number of active users with key insights Deliver an outstanding presentation on the topic using this A Comprehensive Guide Graph Illustrating Impact Of Advanced Analytics On Key Metrics Data Analytics SS Dispense information and present a thorough explanation of Drastic Reduction, Analytics Training Program, Data Analysis using the slides given. This template can be altered and personalized to fit your needs. It is also available for immediate download. So grab it now.
-
 Graph Illustrating Impact Of Prescriptive Unlocking The Power Of Prescriptive Data Analytics SS
This slide showcases graph highlighting impact analysis of prescriptive analytics on businesses via use of major performance indicators. It provides information total revenue, inventory levels and labour costs with key insights. Deliver an outstanding presentation on the topic using this Graph Illustrating Impact Of Prescriptive Unlocking The Power Of Prescriptive Data Analytics SS. Dispense information and present a thorough explanation of Labour Costs, Revenue And Inventory Levels, Training Program And Workshops using the slides given. This template can be altered and personalized to fit your needs. It is also available for immediate download. So grab it now.
-
 Graph Showing Organization Data Strategy Framework
This slide illustrates data strategy framework and includes market drivers and key factors. Deliver an outstanding presentation on the topic using this Graph Showing Organization Data Strategy Framework. Dispense information and present a thorough explanation of Foster Innovation, Least Used Method, Market Drivers, Key Factors using the slides given. This template can be altered and personalized to fit your needs. It is also available for immediate download. So grab it now.
-
 Customer Retention Graph For Improved Navigating The Future Of Insurance Data Analytics SS
This slide outlines a graph highlighting trends in user retention of an ecommerce business. It covers details on lost customers, new users gained and net retention rate along with key insights. Present the topic in a bit more detail with this Customer Retention Graph For Improved Navigating The Future Of Insurance Data Analytics SS. Use it as a tool for discussion and navigation on Monthly Net Retention, Insurance Business, Excellent Customer Service. This template is free to edit as deemed fit for your organization. Therefore download it now.
-
 Data Handling Graph Technology Colored Icon In Powerpoint Pptx Png And Editable Eps Format
This colourful PowerPoint icon is perfect for illustrating data handling topics. It features a stack of colourful cubes with a graph and a magnifying glass, ideal for visualizing data analysis and storage.
-
 Data Handling Graph Technology Monotone Icon In Powerpoint Pptx Png And Editable Eps Format
This monotone PowerPoint icon is perfect for representing data handling topics. It features a graph and a magnifying glass, perfect for illustrating data analysis and research. Its a great choice for presentations on data handling, analytics, and research.
-
 Data Validation Graph Colored Icon In Powerpoint Pptx Png And Editable Eps Format
This colourful PowerPoint icon depicts data validation, showing the process of ensuring data accuracy and consistency by verifying and validating it against a set of rules. Its a great visual aid to help explain data validation in presentations.
-
 Data Validation Graph Monotone Icon In Powerpoint Pptx Png And Editable Eps Format
This Monotone PowerPoint Icon is perfect for illustrating data validation. It features a simple, black and white design thats easy to customize and integrate into any presentation. Its a great way to quickly and clearly communicate your message.
-
 Database Marketing Icon Showcasing Graphs On Laptop
Presenting our set of slides with Database Marketing Icon Showcasing Graphs On Laptop This exhibits information on Three stages of the process. This is an easy to edit and innovatively designed PowerPoint template. So download immediately and highlight information on Database Marketing Icon, Showcasing Graphs On Laptop
-
 Data Visualization Graph Chart Colored Icon In Powerpoint Pptx Png And Editable Eps Format
This coloured PowerPoint icon on Graph Chart is a great way to visually represent data. It is easy to customize and can be used to create stunning visuals for presentations. It is a great tool to help you communicate complex information in a simple and effective way.
-
 Data Visualization Graph Chart Monotone Icon In Powerpoint Pptx Png And Editable Eps Format
This Monotone powerpoint icon on Graph Chart is an ideal choice for presentations, reports, and other documents. It is a simple and effective way to visualize data and make it easier to understand. It is a great tool for data analysis and can be used to compare trends, illustrate relationships, and more.
-
 Company Financial Data Growth Analytics Graph
Presenting our set of slides with Company Financial Data Growth Analytics Graph. This exhibits information on three stages of the process. This is an easy to edit and innovatively designed PowerPoint template. So download immediately and highlight information on Company Financial, Data Growth, Analytics Graph.
-
 Data Virtualisation Graph Database Colored Icon In Powerpoint Pptx Png And Editable Eps Format
Enhance your presentations with this eye-catching PowerPoint icon featuring a colourful graph line symbolizing the power of data virtualisation. Perfect for showcasing the benefits and capabilities of this innovative technology in a visually appealing way. Grab your audiences attention and elevate your slides with this vibrant icon.
-
 Data Virtualisation Graph Database Monotone Icon In Powerpoint Pptx Png And Editable Eps Format
This Monotone powerpoint icon features a sleek and modern design of a graph line, representing data virtualisation. It is perfect for presentations and documents related to data management, analytics, and virtualisation. The icon is easily recognizable and adds a professional touch to any visual representation of data virtualisation.
-
 Data Virtualisation Through Graph Line Icon
Introducing our premium set of slides with Data Virtualisation Through Graph Line Icon. Ellicudate the four stages and present information using this PPT slide. This is a completely adaptable PowerPoint template design that can be used to interpret topics like Data Virtualization, Through Graph Line, Icon. So download instantly and tailor it with your information.
-
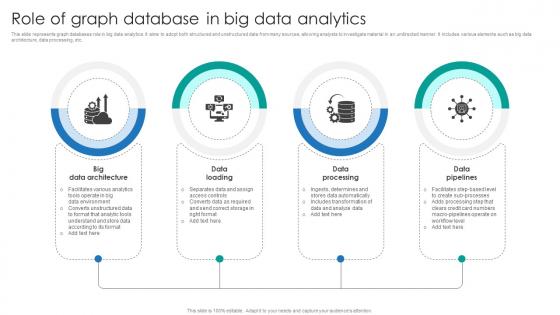 Role Of Graph Database In Big Data Analytics
This slide represents graph databases role in big data analytics. It aims to adopt both structured and unstructured data from many sources, allowing analysts to investigate material in an undirected manner. It includes various elements such as big data architecture, data processing, etc. Presenting our set of slides with Role Of Graph Database In Big Data Analytics. This exhibits information on four stages of the process. This is an easy to edit and innovatively designed PowerPoint template. So download immediately and highlight information on Big Data Architecture, Data Loading, Data Processing.
-
 Graph Icon Representing Data Intelligence Industry Report
Presenting our set of slides with Graph Icon Representing Data Intelligence Industry Report This exhibits information on three stages of the process. This is an easy to edit and innovatively designed PowerPoint template. So download immediately and highlight information on Graph Icon Representing Data, Intelligence Industry Report
-
 Data science and innovation graph ppt slides
Presenting data science and innovation graph ppt slides. This is a data science and innovation graph ppt slides. This is a one stage process. The stages in this process are business value, real time, non real time, very long time, high, low, ds, edw, operation stable, exploratory agile.
-
 Business kpi showing summary of key performance indicator data representation in line graph and pie chart
Presenting this set of slides with name - Business Kpi Showing Summary Of Key Performance Indicator Data Representation In Line Graph And Pie Chart. This is a three stage process. The stages in this process are Business Kpi, Business Dashboard, Business Metrics.
-
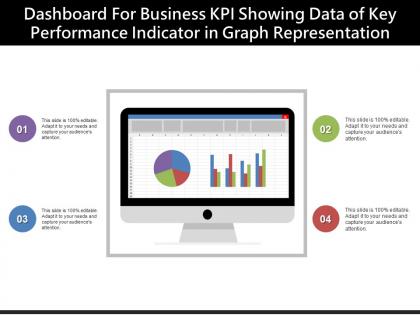 Dashboard for business kpi showing data of key performance indicator in graph representation
Presenting this set of slides with name - Dashboard For Business Kpi Showing Data Of Key Performance Indicator In Graph Representation. This is a four stage process. The stages in this process are Business Kpi, Business Dashboard, Business Metrics.
-
 Visualization representation of business kpi data showing chart and graph of financial data
Presenting this set of slides with name - Visualization Representation Of Business Kpi Data Showing Chart And Graph Of Financial Data. This is a four stage process. The stages in this process are Business Kpi, Business Dashboard, Business Metrics.
-
 Five options business 3d bar graph for data comparison
Presenting this set of slides with name - Five Options Business 3d Bar Graph For Data Comparison. This is a five stage process. The stages in this process are Paint Brush, Art, Coloring.
-
 Percentage comparison showing data comparison through bar graph and line graph
Presenting this set of slides with name - Percentage Comparison Showing Data Comparison Through Bar Graph And Line Graph. This is a four stage process. The stages in this process are Percentage Comparison, Percentage Compare, Percentage Balancing.
-
 0115 data visualization workflow from data access to graphs ppt slide
Entirely adaptable PowerPoint template as convenient with Google slides. Elements of the PPT design i.e. color, text are alterable. Presentation slide quality remains constant even on large screen. Well familiar with the software programs such as JPG and PDF. Pre-designed PowerPoint graphic is accessible with different nodes. Quick download comes with convenience to save for later use. Tailor it with corporation information i.e. company name, logo, image and tag line. Presentation diagram crafted with high quality pixels.
-
 Data visualization survey results reporting via bar graph
Presenting this set of slides with name - Data Visualization Survey Results Reporting Via Bar Graph. This is a one stage process. The stages in this process are Data Visualization, Data Management, Data Representation.
-
 Plot data graph ppt powerpoint presentation gallery maker cpb
Presenting our Plot Data Graph Ppt Powerpoint Presentation Gallery Maker Cpb PowerPoint template design. This PowerPoint slide showcases four stages. It is useful to share insightful information on Plot Data Graph This PPT slide can be easily accessed in standard screen and widescreen aspect ratios. It is also available in various formats like PDF, PNG, and JPG. Not only this, the PowerPoint slideshow is completely editable and you can effortlessly modify the font size, font type, and shapes according to your wish. Our PPT layout is compatible with Google Slides as well, so download and edit it as per your knowledge.
-
 Statistics icon of data analytics using bar graph
Presenting our set of slides with Statistics Icon Of Data Analytics Using Bar Graph. This exhibits information on four stages of the process. This is an easy-to-edit and innovatively designed PowerPoint template. So download immediately and highlight information on Statistics Icon Of Data Analytics Using Bar Graph.
-
 Types graphs data structure ppt powerpoint presentation layouts pictures cpb
Presenting Types Graphs Data Structure Ppt Powerpoint Presentation Layouts Pictures Cpb slide which is completely adaptable. The graphics in this PowerPoint slide showcase five stages that will help you succinctly convey the information. In addition, you can alternate the color, font size, font type, and shapes of this PPT layout according to your content. This PPT presentation can be accessed with Google Slides and is available in both standard screen and widescreen aspect ratios. It is also a useful set to elucidate topics like Types Graphs Data Structure. This well structured design can be downloaded in different formats like PDF, JPG, and PNG. So, without any delay, click on the download button now.
-
 Graphing data ppt powerpoint presentation icon portrait cpb
Presenting our Graphing Data Ppt Powerpoint Presentation Icon Portrait Cpb PowerPoint template design. This PowerPoint slide showcases six stages. It is useful to share insightful information on Graphing Data. This PPT slide can be easily accessed in standard screen and widescreen aspect ratios. It is also available in various formats like PDF, PNG, and JPG. Not only this, the PowerPoint slideshow is completely editable and you can effortlessly modify the font size, font type, and shapes according to your wish. Our PPT layout is compatible with Google Slides as well, so download and edit it as per your knowledge.
-
 Graph Depicting Market Fluctuation Of Data
Introducing our premium set of slides with Graph Depicting Market Fluctuation Of Data. Elucidate the three stages and present information using this PPT slide. This is a completely adaptable PowerPoint template design that can be used to interpret topics like Graph Depicting Market Fluctuation Of Data. So download instantly and tailor it with your information.
-
 Market Graph Representing Data Fluctuations
Introducing our premium set of slides with Market Graph Representing Data Fluctuations. Elucidate the three stages and present information using this PPT slide. This is a completely adaptable PowerPoint template design that can be used to interpret topics like Market Graph Representing Data Fluctuations. So download instantly and tailor it with your information.
-
 Insulation Properties Data Graph Ppt Powerpoint Presentation Ideas Visual Aids Cpb
Presenting Insulation Properties Data Graph Ppt Powerpoint Presentation Ideas Visual Aids Cpb slide which is completely adaptable. The graphics in this PowerPoint slide showcase five stages that will help you succinctly convey the information. In addition, you can alternate the color, font size, font type, and shapes of this PPT layout according to your content. This PPT presentation can be accessed with Google Slides and is available in both standard screen and widescreen aspect ratios. It is also a useful set to elucidate topics like Insulation Properties Data Graph. This well structured design can be downloaded in different formats like PDF, JPG, and PNG. So, without any delay, click on the download button now.
-
 Gather Demographic Data Graph Ppt Powerpoint Presentation Infographic Template Microsoft Cpb
Presenting our Gather Demographic Data Graph Ppt Powerpoint Presentation Infographic Template Microsoft Cpb PowerPoint template design. This PowerPoint slide showcases five stages. It is useful to share insightful information on Gather Demographic Data Graph This PPT slide can be easily accessed in standard screen and widescreen aspect ratios. It is also available in various formats like PDF, PNG, and JPG. Not only this, the PowerPoint slideshow is completely editable and you can effortlessly modify the font size, font type, and shapes according to your wish. Our PPT layout is compatible with Google Slides as well, so download and edit it as per your knowledge.
-
 Diversity Data Ppt Powerpoint Presentation Diagram Graph Charts Cpb
Presenting Diversity Data Ppt Powerpoint Presentation Diagram Graph Charts Cpb slide which is completely adaptable. The graphics in this PowerPoint slide showcase six stages that will help you succinctly convey the information. In addition, you can alternate the color, font size, font type, and shapes of this PPT layout according to your content. This PPT presentation can be accessed with Google Slides and is available in both standard screen and widescreen aspect ratios. It is also a useful set to elucidate topics like Diversity Data. This well structured design can be downloaded in different formats like PDF, JPG, and PNG. So, without any delay, click on the download button now.
-
 Collect Demographic Data Graph Ppt Powerpoint Presentation Infographics Infographics Cpb
Presenting Collect Demographic Data Graph Ppt Powerpoint Presentation Infographics Infographics Cpb slide which is completely adaptable. The graphics in this PowerPoint slide showcase four stages that will help you succinctly convey the information. In addition, you can alternate the color, font size, font type, and shapes of this PPT layout according to your content. This PPT presentation can be accessed with Google Slides and is available in both standard screen and widescreen aspect ratios. It is also a useful set to elucidate topics like Collect Demographic Data Graph. This well structured design can be downloaded in different formats like PDF, JPG, and PNG. So, without any delay, click on the download button now.
-
 Internet shopping safe data graph ppt powerpoint presentation diagrams cpb
Presenting Internet Shopping Safe Data Graph Ppt Powerpoint Presentation Diagrams Cpb slide which is completely adaptable. The graphics in this PowerPoint slide showcase four stages that will help you succinctly convey the information. In addition, you can alternate the color, font size, font type, and shapes of this PPT layout according to your content. This PPT presentation can be accessed with Google Slides and is available in both standard screen and widescreen aspect ratios. It is also a useful set to elucidate topics like Internet Shopping Safe Data Graph. This well structured design can be downloaded in different formats like PDF, JPG, and PNG. So, without any delay, click on the download button now.
-
 Realized Data Rate Return Graph Ppt Powerpoint Presentation Professional Example Cpb
Presenting Realized Data Rate Return Graph Ppt Powerpoint Presentation Professional Example Cpb slide which is completely adaptable. The graphics in this PowerPoint slide showcase four stages that will help you succinctly convey the information. In addition, you can alternate the color, font size, font type, and shapes of this PPT layout according to your content. This PPT presentation can be accessed with Google Slides and is available in both standard screen and widescreen aspect ratios. It is also a useful set to elucidate topics like Realized Data Rate Return Graph. This well-structured design can be downloaded in different formats like PDF, JPG, and PNG. So, without any delay, click on the download button now.
-
 Reinvestment Risk Data Graph Ppt Powerpoint Presentation Portfolio Icon Cpb
Presenting our Reinvestment Risk Data Graph Ppt Powerpoint Presentation Portfolio Icon Cpb PowerPoint template design. This PowerPoint slide showcases four stages. It is useful to share insightful information on Reinvestment Risk Data Graph This PPT slide can be easily accessed in standard screen and widescreen aspect ratios. It is also available in various formats like PDF, PNG, and JPG. Not only this, the PowerPoint slideshow is completely editable and you can effortlessly modify the font size, font type, and shapes according to your wish. Our PPT layout is compatible with Google Slides as well, so download and edit it as per your knowledge.
-
 Sell Data Earn Money Ppt Powerpoint Presentation Diagram Graph Charts Cpb
Presenting Sell Data Earn Money Ppt Powerpoint Presentation Diagram Graph Charts Cpb slide which is completely adaptable. The graphics in this PowerPoint slide showcase four stages that will help you succinctly convey the information. In addition, you can alternate the color, font size, font type, and shapes of this PPT layout according to your content. This PPT presentation can be accessed with Google Slides and is available in both standard screen and widescreen aspect ratios. It is also a useful set to elucidate topics like Sell Data Earn Money. This well-structured design can be downloaded in different formats like PDF, JPG, and PNG. So, without any delay, click on the download button now.
-
 Baseline Data Graph In Powerpoint And Google Slides Cpb
Presenting our Baseline Data Graph In Powerpoint And Google Slides Cpb PowerPoint template design. This PowerPoint slide showcases four stages. It is useful to share insightful information on Baseline Data Graph This PPT slide can be easily accessed in standard screen and widescreen aspect ratios. It is also available in various formats like PDF, PNG, and JPG. Not only this, the PowerPoint slideshow is completely editable and you can effortlessly modify the font size, font type, and shapes according to your wish. Our PPT layout is compatible with Google Slides as well, so download and edit it as per your knowledge.
-
 Data Comparison Graph Of Acquired Customers
This slide illustrates data comparison chart that can help organization to company to compare the customers acquired from different locations and make adjustments in marketing strategies accordingly. It showcases comparison for period of 6 months. Introducing our premium set of slides with Data Comparison Graph Of Acquired Customers. Elucidate the two stages and present information using this PPT slide. This is a completely adaptable PowerPoint template design that can be used to interpret topics like Data Comparison Graph, Acquired Customers. So download instantly and tailor it with your information.
-
 Data Moving Average Statistics Graph In Powerpoint And Google Slides Cpb
Presenting Data Moving Average Statistics Graph In Powerpoint And Google Slides Cpb slide which is completely adaptable. The graphics in this PowerPoint slide showcase three stages that will help you succinctly convey the information. In addition, you can alternate the color, font size, font type, and shapes of this PPT layout according to your content. This PPT presentation can be accessed with Google Slides and is available in both standard screen and widescreen aspect ratios. It is also a useful set to elucidate topics like Data Moving Average Statistics Graph. This well-structured design can be downloaded in different formats like PDF, JPG, and PNG. So, without any delay, click on the download button now.
-
 Advantages Using Graphs Present Data In Powerpoint And Google Slides Cpb
Presenting our Advantages Using Graphs Present Data In Powerpoint And Google Slides Cpb PowerPoint template design. This PowerPoint slide showcases four stages. It is useful to share insightful information on Advantages Using Graphs Present Data This PPT slide can be easily accessed in standard screen and widescreen aspect ratios. It is also available in various formats like PDF, PNG, and JPG. Not only this, the PowerPoint slideshow is completely editable and you can effortlessly modify the font size, font type, and shapes according to your wish. Our PPT layout is compatible with Google Slides as well, so download and edit it as per your knowledge.
-
 Data Mining With Graph Colored Icon In Powerpoint Pptx Png And Editable Eps Format
Give your next presentation a sophisticated, yet modern look with this 100 percent editable Data mining with graph colored icon in powerpoint pptx png and editable eps format. Choose from a variety of customizable formats such as PPTx, png, eps. You can use these icons for your presentations, banners, templates, One-pagers that suit your business needs.
-
 Data Mining With Graph Monotone Icon In Powerpoint Pptx Png And Editable Eps Format
Make your presentation profoundly eye-catching leveraging our easily customizable Data mining with graph monotone icon in powerpoint pptx png and editable eps format. It is designed to draw the attention of your audience. Available in all editable formats, including PPTx, png, and eps, you can tweak it to deliver your message with ease.
-
 Bar Graph Data Colored Icon In Powerpoint Pptx Png And Editable Eps Format
Give your next presentation a sophisticated, yet modern look with this 100 percent editable Bar graph data colored icon in powerpoint pptx png and editable eps format. Choose from a variety of customizable formats such as PPTx, png, eps. You can use these icons for your presentations, banners, templates, One-pagers that suit your business needs.
-
 Bar Graph Data Monotone Icon In Powerpoint Pptx Png And Editable Eps Format
Make your presentation profoundly eye-catching leveraging our easily customizable Bar graph data monotone icon in powerpoint pptx png and editable eps format. It is designed to draw the attention of your audience. Available in all editable formats, including PPTx, png, and eps, you can tweak it to deliver your message with ease.
-
 Data Lineage IT Overview Of Graph Data Lineage Visualization Ppt Presentation Outline Information
This slide gives an overview of graph data lineage visualization that enables business users to view and analyze data lineage to find solutions without technical skills. The search bar feature allows users to search for any data set or property in the database. Introducing Data Lineage IT Overview Of Graph Data Lineage Visualization Ppt Presentation Outline Information to increase your presentation threshold. Encompassed with six stages, this template is a great option to educate and entice your audience. Dispence information on Enables Business, Examine Data, Requiring Technical, using this template. Grab it now to reap its full benefits.
-
 Graph Data Visualization In Powerpoint And Google Slides Cpb
Presenting Graph Data Visualization In Powerpoint And Google Slides Cpb slide which is completely adaptable. The graphics in this PowerPoint slide showcase four stages that will help you succinctly convey the information. In addition, you can alternate the color, font size, font type, and shapes of this PPT layout according to your content. This PPT presentation can be accessed with Google Slides and is available in both standard screen and widescreen aspect ratios. It is also a useful set to elucidate topics like Graph Data Visualization. This well structured design can be downloaded in different formats like PDF, JPG, and PNG. So, without any delay, click on the download button now.
-
 Graphs pie chart image for big data governance
Presenting this set of slides with name Graphs Pie Chart Image For Big Data Governance. This is a one stage process. The stages in this process are Big Data Governance, Analytics, Dashboard. This is a completely editable PowerPoint presentation and is available for immediate download. Download now and impress your audience.
-
 Sales Data Bar Graph And Analytics Icon
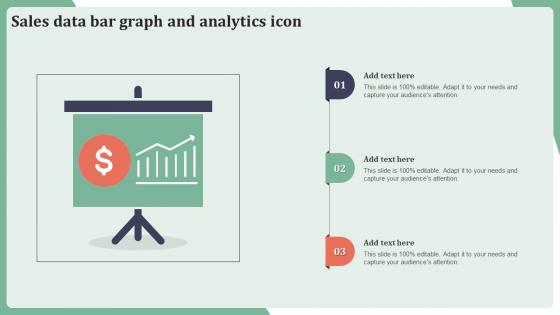
Presenting our set of slides with Sales Data Bar Graph And Analytics Icon. This exhibits information on three stages of the process. This is an easy to edit and innovatively designed PowerPoint template. So download immediately and highlight information on Sales Data Bar Graph, Analytics Icon.
-
 Patient Data Graph Colored Icon In Powerpoint Pptx Png And Editable Eps Format
This coloured powerpoint icon is perfect for promoting offers to your customers. It is eye catching and modern, and will help to draw attention to your message. It is easy to customize and can be used to create a professional presentation.
-
 Patient Data Graph Monotone Icon In Powerpoint Pptx Png And Editable Eps Format
This Monotone PowerPoint icon is perfect for promoting offers. It features a simple, modern design that will help you capture the attention of potential customers. It is easy to customize and can be used for a variety of marketing and promotional purposes. Get creative and use this icon to help you promote your offers.
-
 Data Handling Graph Colored Icon In Powerpoint Pptx Png And Editable Eps Format
This colourful PowerPoint icon is perfect for illustrating data handling concepts. It features a bar graph and a pie chart with different coloured sections, making it ideal for presentations on data analysis and visualisation.
-
 Data Handling Graph Monotone Icon In Powerpoint Pptx Png And Editable Eps Format
This Monotone powerpoint icon is perfect for presentations on data handling. It features a graph with a blue line that curves up and down, representing the ups and downs of data. Its a great visual to help explain data trends and analysis.
-
 Data Analytics Graph Colored Icon In Powerpoint Pptx Png And Editable Eps Format
Give your next presentation a sophisticated, yet modern look with this 100 percent editable Data analytics graph colored icon in powerpoint pptx png and editable eps format. Choose from a variety of customizable formats such as PPTx, png, eps. You can use these icons for your presentations, banners, templates, One-pagers that suit your business needs.
-
 Data Analytics Graph Monotone Icon In Powerpoint Pptx Png And Editable Eps Format
Make your presentation profoundly eye-catching leveraging our easily customizable Data analytics graph monotone icon in powerpoint pptx png and editable eps format. It is designed to draw the attention of your audience. Available in all editable formats, including PPTx, png, and eps, you can tweak it to deliver your message with ease.
-
 Data Lineage And Data Provenance Ppt Powerpoint Presentation Diagram Graph Charts
This slide represents the data lineage and data provenance that represents data flow at summary and detail levels. The components of both concepts include a file transfer protocol server, data staging area, data warehouse, master data, data marts, and so on. Deliver an outstanding presentation on the topic using this Data Lineage And Data Provenance Ppt Powerpoint Presentation Diagram Graph Charts. Dispense information and present a thorough explanation of Data Provenance, Ecommerce Wed Site, Customer Service using the slides given. This template can be altered and personalized to fit your needs. It is also available for immediate download. So grab it now.


