Powerpoint Templates and Google slides for Graph.
Save Your Time and attract your audience with our fully editable PPT Templates and Slides.
-
 Graph Illustrating Helpdesk Solutions For Higher Education
This slide showcases the statistical graph highlighting help desk solutions for higher education department which helps them to manage daily institutional tasks quickly and easily. ITinclude details such as Atlassian, blackboard, bmc software, Ellucian, ivanti, etc. Introducing our Graph Illustrating Helpdesk Solutions For Higher Education set of slides. The topics discussed in these slides are Automates Workflow, Resolves User Issues , Enhances Teams ExpertiseThis is an immediately available PowerPoint presentation that can be conveniently customized. Download ITand convince your audience.
-
 Graph Highlighting Gender Diversity Importance For Innovation Efforts
This slide showcases the statistical graph representing gender diversity importance for business innovation efforts. It include details such as financial director, etc. Introducing our Graph Highlighting Gender Diversity Importance For Innovation Efforts set of slides. The topics discussed in these slides are Key Insights,Management Leaders,Financial Director. This is an immediately available PowerPoint presentation that can be conveniently customized. Download it and convince your audience.
-
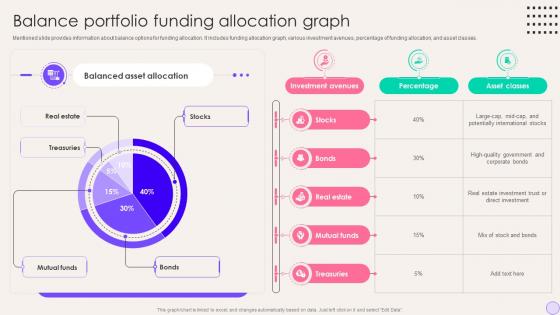 Balance Portfolio Funding Allocation Graph Financial Portfolio Expansion
Mentioned slide provides information about balance options for funding allocation. It includes funding allocation graph, various investment avenues, percentage of funding allocation, and asset classes. Present the topic in a bit more detail with this Balance Portfolio Funding Allocation Graph Financial Portfolio Expansion Use it as a tool for discussion and navigation on Investment Avenues, Percentage, Asset Classes This template is free to edit as deemed fit for your organization. Therefore download it now.
-
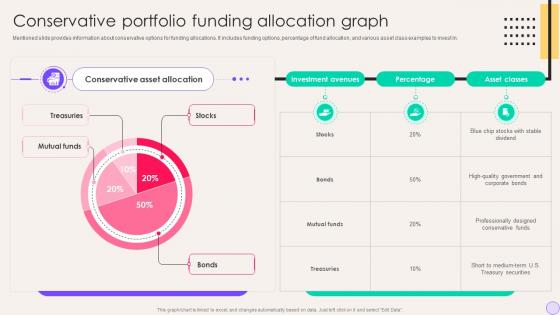 Conservative Portfolio Funding Allocation Graph Financial Portfolio Expansion
Mentioned slide provides information about conservative options for funding allocations. It includes funding options, percentage of fund allocation, and various asset class examples to invest in. Deliver an outstanding presentation on the topic using this Conservative Portfolio Funding Allocation Graph Financial Portfolio Expansion Dispense information and present a thorough explanation of Conservative Asset Allocation, Investment Avenues, Percentage using the slides given. This template can be altered and personalized to fit your needs. It is also available for immediate download. So grab it now.
-
 Graphical Representation Of Lead Source Used By Various Industries
This slide represents graph that provide key insights to various companies about lead sources used and select effective source for lead generation. It includes various sources such as direct mail, trade shows, blogs, PPC, etc. Presenting our well structured Graphical Representation Of Lead Source Used By Various Industries. The topics discussed in this slide are Number Respondents, Marketing Agencies, Generate Most. This is an instantly available PowerPoint presentation that can be edited conveniently. Download it right away and captivate your audience.
-
 Monthly Growth Graph Of Affiliate Partners Affiliate Program To Expand Product Reach
This slide shows graph which can be used to highlight monthly growth rate of affiliate marketing program partners. It also includes quarterly growth rate. Present the topic in a bit more detail with this Monthly Growth Graph Of Affiliate Partners Affiliate Program To Expand Product Reach. Use it as a tool for discussion and navigation on Partner Growth, Affiliate Marketing Program, Quarterly Growth Rate. This template is free to edit as deemed fit for your organization. Therefore download it now.
-
 Global Smartwatch Market Size Graph
This slide shows graph which can be used to highlight or represent current and expected future market share of smartwatchs. It includes information regarding compound annual growth rate, growth drivers and current challenges. Introducing our Global Smartwatch Market Size Graph set of slides. The topics discussed in these slides are Data Privacy, Health And Fitness, Cross Platform Compatibility This is an immediately available PowerPoint presentation that can be conveniently customized. Download it and convince your audience.
-
 Budget For Training Program On Implementation Load Testing Ppt Slides Graphics
This slide shows the cost breakup of a training program on implementation load testing components, such as instructors cost, training material cost, etc. Deliver an outstanding presentation on the topic using this Budget For Training Program On Implementation Load Testing Ppt Slides Graphics. Dispense information and present a thorough explanation of Training Materials Cost, Instructors Cost, Training Cost Distribution using the slides given. This template can be altered and personalized to fit your needs. It is also available for immediate download. So grab it now.
-
 Chatbot Security Survey Results Graph
This slide shows information that organizations can use to understand or evaluate customers confidence in chatbot security, specifically in banking and shopping activities. It includes information regarding customers privacy concerns. Presenting our well structured Chatbot Security Survey Results Graph. The topics discussed in this slide are Key Insights, Online Privacy, Chatbots Banking, Online Shopping. This is an instantly available PowerPoint presentation that can be edited conveniently. Download it right away and captivate your audience.
-
 Statistical Graph Highlighting Business Performance Product Bundling Strategies To Enhance
Mentioned slide displays company revenue and net profit over the years to determine and analyse current business situations. Present the topic in a bit more detail with this Statistical Graph Highlighting Business Performance Product Bundling Strategies To Enhance. Use it as a tool for discussion and navigation on Statistical Graph Highlighting, Business Performance, Current Business Situations. This template is free to edit as deemed fit for your organization. Therefore download it now.
-
 Graphical Cash Flow Analysis By Closing Cash And Change Food Store Business Plan BP SS
The slides highlight the cash flow statement of the company. It represents net cash flow from operating, investing, and financing activities from the year 2023 till 2027. Present the topic in a bit more detail with this Graphical Cash Flow Analysis By Closing Cash And Change Food Store Business Plan BP SS Use it as a tool for discussion and navigation on Cash Flow Analysis, Change During This template is free to edit as deemed fit for your organization. Therefore download it now.
-
 Graphical Representation By Revenue Gross Profit And Ebt Food Store Business Plan BP SS
The slides provide a glimpse of the projected profit and loss statement to visualize the platforms financial performance for the next five years. The key components are total revenue from operations, gross profit, EBITDA, etc. Deliver an outstanding presentation on the topic using this Graphical Representation By Revenue Gross Profit And Ebt Food Store Business Plan BP SS Dispense information and present a thorough explanation of Earnings After Tax, Gross Profit, Total Revenue From Operations using the slides given. This template can be altered and personalized to fit your needs. It is also available for immediate download. So grab it now.
-
 Statistical Graph Illustrating Multivendor Key Market Players
This slide showcases the statistical graph highlighting multiple distributor key market players which helps an organization to understand market patterns for enhancing their business growth. It include detail such as employs customer focused approach, offers loyalty programs, etc. Introducing our Statistical Graph Illustrating Multivendor Key Market Players set of slides. The topics discussed in these slides are Introduces Constant Innovations, Offers Loyalty Programs, Employs Customer Focused Approach. This is an immediately available PowerPoint presentation that can be conveniently customized. Download it and convince your audience.
-
 Graph Representing Fintech Prioritization Areas For Digital Transformation
This slide showcases the statistical graph illustrating financial services prioritization areas for digital intervention which helps an organization to identify potential budget and time resources. It include details such as management reporting and analysis, budgeting, etc. Presenting our well structured Graph Representing Fintech Prioritization Areas For Digital Transformation. The topics discussed in this slide are Employs Robotic Process Automation, Reduces Time By Automating. This is an instantly available PowerPoint presentation that can be edited conveniently. Download it right away and captivate your audience.
-
 Statistical Graph Illustrating Digital Transformation Impact Over Fintech
This slide showcases the statistical graph highlighting digital transformation impacts on financial services which helps an organization to improve and enhance operational efficiency. It include details such as open apis, advances analytics, cloud processing, etc. Presenting our well structured Statistical Graph Illustrating Digital Transformation Impact Over Fintech. The topics discussed in this slide are Digital Transformation Technology, Fintech Industries, Financial Data. This is an instantly available PowerPoint presentation that can be edited conveniently. Download it right away and captivate your audience.
-
 Statistical Graph Illustrating Building Enterprise Security Architecture
This slide showcases the statistical graph highlighting creating enterprise security architecture which helps an organization to create better,secure and safer environment. It include details such as enhances security support,improves team collaboration,etc. Introducing our Statistical Graph Illustrating Building Enterprise Security Architecture set of slides. The topics discussed in these slides are Devops Security,Building Securitys Success,Key Reasons. This is an immediately available PowerPoint presentation that can be conveniently customized. Download it and convince your audience.
-
 Text Analysis Market Size Graph
This slide shows a graph that can be used to highlight or represent the current and expected future market share of text analytics industry. It includes information regarding compound annual growth rates and key growth drivers. Presenting our well structured Text Analysis Market Size Graph. The topics discussed in this slide are Text Analysis Market Size Graph, Compound Annual Growth Rates, Future Market Share. This is an instantly available PowerPoint presentation that can be edited conveniently. Download it right away and captivate your audience.
-
 Quarterly Employee Business Sales Performance Graph
This slide shows graph that can be used by organizations to highlight monthly sales performance of company. It includes sales made by different employee through out the quarter. Presenting our well structured Quarterly Employee Business Sales Performance Graph. The topics discussed in this slide are Key Insights, Highest Sales, New Regions. This is an instantly available PowerPoint presentation that can be edited conveniently. Download it right away and captivate your audience.
-
 Organizational Change Management Measurement Graph
This slide shows results of a survey which was conducted to evaluate whether change management objective is achieved by organizations or not after implementing it. It also includes information regarding various strategies adopted by organizations while change management process. Presenting our well structured Organizational Change Management Measurement Graph. The topics discussed in this slide are Organizations, Met Exceeded Objectives, Use Strategies. This is an instantly available PowerPoint presentation that can be edited conveniently. Download it right away and captivate your audience.
-
 Geofencing Marketing Survey Results Graph
This slide shows results of a location-based marketing survey of digital marketing agencies to identify which sector is mostly benefited from geo-targeted advertisements. It includes sectors such as food and beverage, heath, beauty, fitness, entertainment, etc. Introducing our Geofencing Marketing Survey Results Graph set of slides. The topics discussed in these slides are Digital Marketing Agencies, Geofencing Marketing, Opportunity. This is an immediately available PowerPoint presentation that can be conveniently customized. Download it and convince your audience.
-
 Employee Onboarding Plan Graph By Completion Rate
The purpose of this slide is to showcase the onboarding plan by completion rate which enable timely adjustments to enhance engagement and retention for smooth transition for new hires. Presenting our well structured Employee Onboarding Plan Graph By Completion Rate The topics discussed in this slide are Clear Communication, Mandatory Attendance, Completion Rate This is an instantly available PowerPoint presentation that can be edited conveniently. Download it right away and captivate your audience.
-
 A196 Digital Design Studio Business Plan Graphic Design Industry Market Split BP SS V
The purpose of this slide is to highlight the graphic design market size which includes the world map with largest market and fastest-growing market. It also includes the visual assets used by graphic designers. Present the topic in a bit more detail with this A196 Digital Design Studio Business Plan Graphic Design Industry Market Split BP SS V. Use it as a tool for discussion and navigation on Market Split By Service, Visual Assets, Graphic Designers. This template is free to edit as deemed fit for your organization. Therefore download it now.
-
 Digital Design Studio Business Plan Graphic Design Business Comparative Balance BP SS V
The slides cover the snapshot of the companys financial position at a specific time by showing the details of the assets of the company along with its liabilities and owners capital from the historical year 2023 till the forecasted year 2027. Present the topic in a bit more detail with this Digital Design Studio Business Plan Graphic Design Business Comparative Balance BP SS V. Use it as a tool for discussion and navigation on Assets, Cash, Purchase Of Computer, Shareholders Equity. This template is free to edit as deemed fit for your organization. Therefore download it now.
-
 Digital Design Studio Business Plan Graphic Design Industry Global Market BP SS V
The purpose of this slide is to highlight the market size of the global graphic design industry. It also highlights the primary reasons driving the markets growth including continuous economic growth in developed and developing countries. Present the topic in a bit more detail with this Digital Design Studio Business Plan Graphic Design Industry Global Market BP SS V. Use it as a tool for discussion and navigation on Market Split By Region, Organization Invest, Business Activities. This template is free to edit as deemed fit for your organization. Therefore download it now.
-
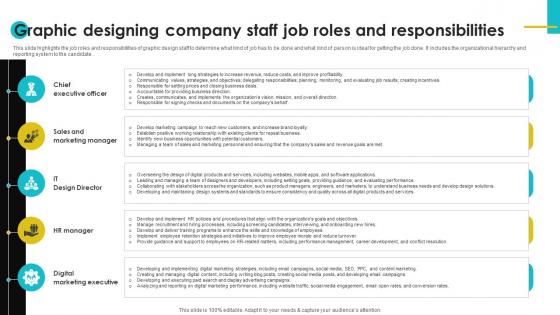 Digital Design Studio Business Plan Graphic Designing Company Staff Job Roles BP SS V
This slide highlights the job roles and responsibilities of graphic design staff to determine what kind of job has to be done and what kind of person is ideal for getting the job done. It includes the organizational hierarchy and reporting system to the candidate. Introducing Digital Design Studio Business Plan Graphic Designing Company Staff Job Roles BP SS V to increase your presentation threshold. Encompassed with Five stages, this template is a great option to educate and entice your audience. Dispence information on Chief Executive Officer, Sales And Marketing Manager, It Design Director, using this template. Grab it now to reap its full benefits.
-
 Digital Design Studio Business Plan Key Market Trends Shaping Graphic Design BP SS V
This slide highlights the key market trends that have the potential to change the current market scenario, as well as ways that the company can stay ahead of competitors. With these trends, the company will look for innovative or new ways of providing its products and services. Introducing Digital Design Studio Business Plan Key Market Trends Shaping Graphic Design BP SS V to increase your presentation threshold. Encompassed with Six stages, this template is a great option to educate and entice your audience. Dispence information on Motion Graphics, Ai-Generated Art, 3d Elements, using this template. Grab it now to reap its full benefits.
-
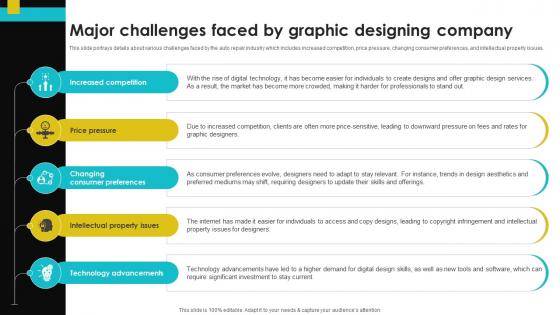 Digital Design Studio Business Plan Major Challenges Faced By Graphic BP SS V
This slide portrays details about various challenges faced by the auto repair industry which includes increased competition, price pressure, changing consumer preferences, and intellectual property issues. Introducing Digital Design Studio Business Plan Major Challenges Faced By Graphic BP SS V to increase your presentation threshold. Encompassed with Five stages, this template is a great option to educate and entice your audience. Dispence information on Increased Competition, Price Pressure, Intellectual Property Issues, using this template. Grab it now to reap its full benefits.
-
 Digital Design Studio Business Plan Projected Cash Flow Statement For Graphic BP SS V
The slides highlight the companys cash flow statement to provide a detailed picture of what happened to a businesss cash during a specified period. It represents net cash flow from operating, investing, and financing activities from the historical year 2023 till the forecasted the year 2027. Present the topic in a bit more detail with this Digital Design Studio Business Plan Projected Cash Flow Statement For Graphic BP SS V. Use it as a tool for discussion and navigation on Net Income, Net Cash Flow From Operating Activities. This template is free to edit as deemed fit for your organization. Therefore download it now.
-
 Digital Design Studio Business Plan Start Up Cost Summary For Graphic Designing BP SS V
This slide provides information about start-up expenditures that incur during the process of establishing a graphic design company, such as start-up ownership, legalities, and other expenses. It will also highlight how the company will utilize its funds. Present the topic in a bit more detail with this Digital Design Studio Business Plan Start Up Cost Summary For Graphic Designing BP SS V. Use it as a tool for discussion and navigation on Cash Buffer Remain For The Business, Fixed Assets, Website Development Cost, License And Permits. This template is free to edit as deemed fit for your organization. Therefore download it now.
-
 Digital Design Studio Business Plan US Graphic Design Market Statistics BP SS V
This slide highlights the United states graphic design market statistics which includes data related to the largest employers, self employed individuals, specialized or customized design services and printing and other support services. Present the topic in a bit more detail with this Digital Design Studio Business Plan US Graphic Design Market Statistics BP SS V. Use it as a tool for discussion and navigation on Us Graphic Design, Market Statistics. This template is free to edit as deemed fit for your organization. Therefore download it now.
-
 Piggery Farming Business Plan Graphical Balance Sheet Analysis By Total Business Assets BP SS
The slides cover the snapshot of the company financial position at a specific time. It shows the assets and liabilities of the company from the year 2023 till the forecasted year 2027. Present the topic in a bit more detail with this Piggery Farming Business Plan Graphical Balance Sheet Analysis By Total Business Assets BP SS. Use it as a tool for discussion and navigation on Graphical Balance Sheet Analysis, Business Assets And Net Worth, Financial Position. This template is free to edit as deemed fit for your organization. Therefore download it now.
-
 Piggery Farming Business Plan Graphical Cash Flow Analysis By Closing Cash And Change BP SS
The slides highlight the cash flow statement of the company. It represents net cash flow from operating, investing, and financing activities from the year 2023 till 2027. Deliver an outstanding presentation on the topic using this Piggery Farming Business Plan Graphical Cash Flow Analysis By Closing Cash And Change BP SS. Dispense information and present a thorough explanation of Graphical Cash Flow Analysis, Cash Flow From Operating, Investing And Financing Activities using the slides given. This template can be altered and personalized to fit your needs. It is also available for immediate download. So grab it now.
-
 Piggery Farming Business Plan Graphical Representation By Revenue Gross Profit And Ebt BP SS
The slides provide a glimpse of the projected profit and loss statement to visualize the platforms financial performance for the next five years. The key components are total revenue from operations, gross profit, EBITDA, etc. Present the topic in a bit more detail with this Piggery Farming Business Plan Graphical Representation By Revenue Gross Profit And Ebt BP SS. Use it as a tool for discussion and navigation on Graphical Representation, Revenue, Gross Profit, Financial Performance. This template is free to edit as deemed fit for your organization. Therefore download it now.
-
 3D Ultrasound Market Share Graph
This slide shows a graph that can be used to highlight or represent the current and expected future market share of 3D ultrasound. It includes information regarding compound annual growth rates, and major growth drivers of industry. Introducing our 3D Ultrasound Market Share Graph set of slides. The topics discussed in these slides are Growth Drivers, Minimally Invasive ProceduresThis is an immediately available PowerPoint presentation that can be conveniently customized. Download it and convince your audience.
-
 Automated Whole Breast Ultrasound Market Graph
This slide shows a graph that can be used to highlight or represent the current and expected future market share of automated whole-breast ultrasound. It includes information regarding compound annual growth rates, growth drivers, and restraints. Presenting our well structured Automated Whole Breast Ultrasound Market Graph The topics discussed in this slide are Growth Drivers, RestraintsThis is an instantly available PowerPoint presentation that can be edited conveniently. Download it right away and captivate your audience.
-
 Ultrasound Equipment Market Share Graph
This slide shows a graph that can be used to highlight or represent the current and expected future market share of ultrasound equipment market by technology. It includes information regarding compound annual growth rates and growth drivers. Introducing our Ultrasound Equipment Market Share Graph set of slides. The topics discussed in these slides are Ultrasound Equipment Marke, Market Share GraphThis is an immediately available PowerPoint presentation that can be conveniently customized. Download it and convince your audience.
-
 Ultrasound Market Share Graph By Regions
This slide shows a graph that can be used to highlight or represent the market share of the ultrasound market in different regions. It includes regions such as North America, Europe, Asia Pacific, Latin America and Middle East and Africa. Presenting our well structured Ultrasound Market Share Graph By Regions The topics discussed in this slide are Graph By Regions, Growth DriversThis is an instantly available PowerPoint presentation that can be edited conveniently. Download it right away and captivate your audience.
-
 Graphical Representation Of Healthcare Quality KPIs
This slide graphically represents comparison of hospital quality KPIs for healthcare services such as patient satisfaction rate, mortality rate, etc. Introducing our Graphical Representation Of Healthcare Quality KPIs set of slides. The topics discussed in these slides are Mortality Rate, Patient Satisfaction RateThis is an immediately available PowerPoint presentation that can be conveniently customized. Download it and convince your audience.
-
 Quality KPI Comparison Graph For Construction Business
This slide graphically compares quality KPIs for various construction businesses including KPIs such as safety incident rate, resource utilization rate, etc. Introducing our Quality KPI Comparison Graph For Construction Business set of slides. The topics discussed in these slides are Construction Quality, Construction BusinessThis is an immediately available PowerPoint presentation that can be conveniently customized. Download it and convince your audience.
-
 Global Curved TV Market Graph
This slide shows a graph that can be used to highlight or represent the current and expected future market share of curved television market. It includes information regarding compound annual growth rates and growth drivers. Introducing our Global Curved TV Market Graph set of slides. The topics discussed in these slides are Enhanced Features, Superior Display, Picture Quality, Growth Drivers. This is an immediately available PowerPoint presentation that can be conveniently customized. Download it and convince your audience.
-
 Global High Definition TV Market Graph
This slide shows a graph that can be used to highlight or represent the current and expected future market share of the high-definition television market. It includes information regarding compound annual growth rates and major growth drivers. Presenting our well structured Global High Definition TV Market Graph. The topics discussed in this slide are Higher Resolutions, Better Color Accuracy, Enhanced Contrast Ratios. This is an instantly available PowerPoint presentation that can be edited conveniently. Download it right away and captivate your audience.
-
 Global Pay TV Market Size Graph
This slide shows a graph that can be used to highlight or represent the current and expected future market share of television market. It includes information regarding compound annual growth rates and growth drivers. Introducing our Global Pay TV Market Size Graph set of slides. The topics discussed in these slides are Reduced Subscription Costs, Rising Trend Of Internet Protocol Television, Market Size Graph. This is an immediately available PowerPoint presentation that can be conveniently customized. Download it and convince your audience.
-
 Global TV Advertising Market Graph
This template shows various statistical information associated with the global television advertising markets size. It includes past, current, and expected industry size. It also involves details compound annual growth rate, growth drivers, etc. Presenting our well structured Global TV Advertising Market Graph. The topics discussed in this slide are Programmatic Advertising, Advertising Market Graph, Compound Annual Growth Rate. This is an instantly available PowerPoint presentation that can be edited conveniently. Download it right away and captivate your audience.
-
 Global TV Market Size Forecasting Graph
This slide shows a graph that can be used to highlight or represent the current and expected future market share of the television market. It includes information regarding compound annual growth rates and major growth drivers. Presenting our well structured Global TV Market Size Forecasting Graph. The topics discussed in this slide are Global TV Market Size, Forecasting Graph, Increase In Consumption, On Demand Content. This is an instantly available PowerPoint presentation that can be edited conveniently. Download it right away and captivate your audience.
-
 TV Service Market Size Graph
This slide shows a graph that can be used to highlight or represent the current and expected future market share of the television service market. It includes information regarding compound annual growth rates, major growth drivers and restraints. Introducing our TV Service Market Size Graph set of slides. The topics discussed in these slides are Technological Developments, Broadcast Sector, Limited Digital Infrastructure, Digital Illiteracy. This is an immediately available PowerPoint presentation that can be conveniently customized. Download it and convince your audience.
-
 Bar graph with seven steps and icons powerpoint template slide
We are proud to present our bar graph with seven steps and icons powerpoint template slide. Graphic of bar graph with seven steps and icons has been used to craft this power point template diagram. This PPT diagram contains the concept of data representation. Use this PPT diagram for business and marketing related presentations.
-
 Graphic with uniqueness concept and icons powerpoint template slide
We are proud to present our graphic with uniqueness concept and icons powerpoint template slide. Graphic of icons has been used to craft this power point template diagram. This PPT diagram contains the concept of uniqueness. Use this PPT diagram for business related presentations.
-
 Mw seven staged bar graph with icons powerpoint template slide
Presenting mw seven staged bar graph with icons powerpoint template slide. Seven staged bar graph and icons has been used to craft this power point template diagram. This PPT diagram contains the concept of business result analysis. Use this PPT diagram for marketing and business related presentation.
-
 Linear graphical illustration of process 5 stages flow chart powerpoint slides
We are proud to present our linear graphical illustration of process 5 stages flow chart powerpoint slides. Use this diagram to form a Market Plan that is simple and effective in that phase of business, market and industry. Energise your team into action. Plug them in with this PowerPoint background design.
-
 Powerpoint graphics business process with 4 stages templates ppt backgrounds for slides
We are proud to present our powerpoint graphics business process with 4 stages templates ppt backgrounds for slides. Develop competitive advantage with our above template. The diagram consists of five triangles stacked in a series of sequence. This image has been conceived to enable you to emphatically communicate your ideas in your Business and Process Flow PPT presentations.
-
 Business powerpoint examples graphical representation stacked diagram 5 stages templates
We are proud to present our business powerpoint examples graphical representation stacked diagram 5 stages templates. Business Flow diagram contains stacked levels for representation of structures. This diagram an be useful for creating visually appealing charts. You can change color, size and orientation of any icon to your liking. Present your views using our innovative slides and be assured of leaving a lasting impression.
-
 Business network diagram graphical illustration of cluster 5 stages powerpoint templates
We are proud to present our business network diagram graphical illustration of cluster 5 stages powerpoint templates. The above template displays a diagram of business network. This diagram can be used to create a graphic display to brainstorm about a topic. Use this template to systematize the generation of ideas based upon a central topic. The structure of our templates allows you to effectively highlight the key issues concerning the growth of your business.
-
 3d puzzle process chart 6 stages powerpoint templates graphics slides 0712
Use this multi dimensional diagram for analyzing Market Conditions.
-
 Balanced cycle process 6 stages powerpoint templates graphics slides 0712
You can find countless advantages in the convenient ready-to-use diagrams
-
 Business development chart powerpoint templates graphics slides 0712
This diagram describes each business process from a conceptual perspective.
-
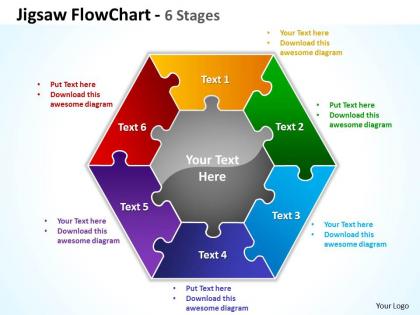 Jigsaw flowchart 6 stages powerpoint templates graphics slides 0712
Display with these 3D puzzle pieces coherences, process steps, sequences, subareas and workflows
-
 Linear mode process 6 stages powerpoint templates graphics slides 0712
It is suitable to visualize chronological sequences, milestones or a corporate history. The structured design of the Timeline Set helps to create a clear overview.
-
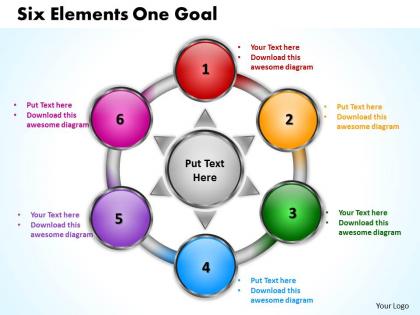 Six elements one goal powerpoint templates graphics slides 0712
This chart visualize the of process steps, re-occurrences and components or of your company structure or product features.
-
 3d puzzle sculpture 6 stages powerpoint diagrams presentation slides graphics 0912
3d Puzzle design is an effective way of jolting down your ideas in the form of diagrams and models.
-
 3d vector chart 6 stages powerpoint diagrams presentation slides graphics 0912
Use this diagram to make a strategy for managing a company?s interactions with customers, clients and sales prospects.


