Powerpoint Templates and Google slides for Graph.
Save Your Time and attract your audience with our fully editable PPT Templates and Slides.
-
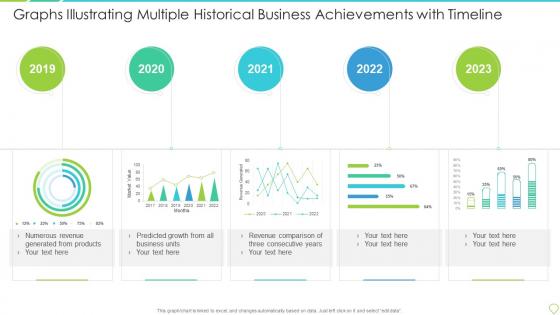 Graphs illustrating multiple historical business achievements with timeline
Introducing our Graphs Illustrating Multiple Historical Business Achievements With Timeline set of slides. The topics discussed in these slides are Revenue, Growth, Business. This is an immediately available PowerPoint presentation that can be conveniently customized. Download it and convince your audience.
-
 Percentage circle graphics for financial risk models infographic template
This is our Percentage Circle Graphics For Financial Risk Models Infographic Template designed in PowerPoint, however, you can also access it in Google Slides. It comes in two aspect ratios standard and widescreen, with fully editable visual content.
-
 Percentage circle graphics for revenue cycle profitability analysis infographic template
Deploy our Percentage Circle Graphics For Revenue Cycle Profitability Analysis Infographic Template to present high quality presentations. It is designed in PowerPoint and is available for immediate download in standard and widescreen sizes. Not only this, but this layout is also 100 percent editable, giving you full control over its applications.
-
 Circular progress bar graphics for business customer satisfaction infographic template
Deploy our Circular Progress Bar Graphics For Business Customer Satisfaction Infographic Template to present high quality presentations. It is designed in PowerPoint and is available for immediate download in standard and widescreen sizes. Not only this, but this layout is also 100 percent editable, giving you full control over its applications.
-
 Circular progress bar graphics for marketing plans in strategic management infographic template
This is a single slide titled Circular Progress Bar Graphics For Marketing Plans In Strategic Management Infographic Template. It is crafted using high quality vector based visuals that are 100 percent editable and available for immediate download in standard and widescreen aspect ratios.
-
 Graph For Spending Trend Of Automobile Comprehensive Guide To Automotive Strategy SS V
This slide represents a graph showing the spending trend for digital and traditional marketing of automobiles. It includes a test drive, customer buying decisions, etc. Present the topic in a bit more detail with this Graph For Spending Trend Of Automobile Comprehensive Guide To Automotive Strategy SS V. Use it as a tool for discussion and navigation on Spending, Automobile, Promotion. This template is free to edit as deemed fit for your organization. Therefore download it now.
-
 Table Of Contents For Applications Of Industrial Robotic Systems Ppt Show Graphics Example
Deliver an outstanding presentation on the topic using this Table Of Contents For Applications Of Industrial Robotic Systems Ppt Show Graphics Example. Dispense information and present a thorough explanation of Industrial Robots Overview, Industrial Robot Applications, Production Applications using the slides given. This template can be altered and personalized to fit your needs. It is also available for immediate download. So grab it now.
-
 Identifying Gaps In Workplace Graph Chart Showcasing Gender Inequality In Workplace
This slide highlights gender inequality in the workplace in order to determine the reasons behind biasedness and improve organizational performance.It includes men and women distribution in leadership and managerial roles and in labor force roles. Deliver an outstanding presentation on the topic using this Identifying Gaps In Workplace Graph Chart Showcasing Gender Inequality In Workplace Dispense information and present a thorough explanation of Leadership Managerial Roles, Labor Force using the slides given. This template can be altered and personalized to fit your needs. It is also available for immediate download. So grab it now.
-
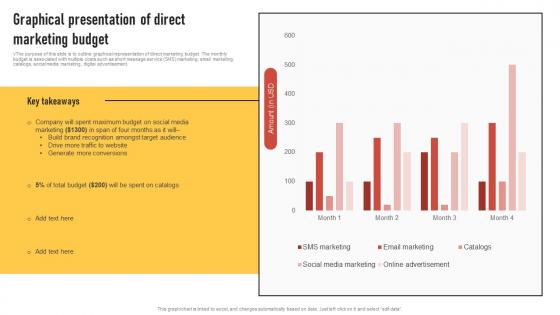 Graphical Presentation Of Direct Marketing Budget Introduction To Direct Marketing Strategies MKT SS V
vThe purpose of this slide is to outline graphical representation of direct marketing budget. The monthly budget is associated with multiple costs such as short message service SMS marketing, email marketing, catalogs, social media marketing, digital advertisement. Present the topic in a bit more detail with this Graphical Presentation Of Direct Marketing Budget Introduction To Direct Marketing Strategies MKT SS V. Use it as a tool for discussion and navigation on Amount. This template is free to edit as deemed fit for your organization. Therefore download it now.
-
 Dough Nut Graph For Operational Strategic Plan Building Comprehensive Plan Strategy And Operations MKT SS V
Present the topic in a bit more detail with this Dough Nut Graph For Operational Strategic Plan Building Comprehensive Plan Strategy And Operations MKT SS V. Use it as a tool for discussion and navigation on Dough Nut Graph, Operational Strategic Plan. This template is free to edit as deemed fit for your organization. Therefore download it now.
-
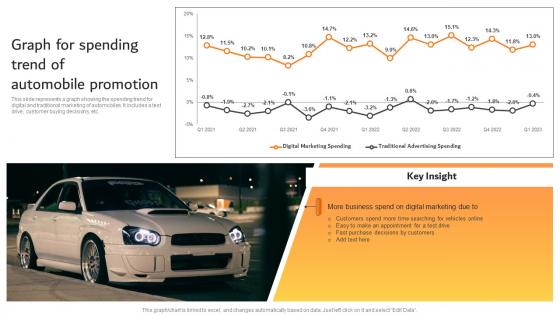 Graph For Spending Trend Of Automobile Promotion Effective Car Dealer Marketing Strategy SS V
This slide represents a graph showing the spending trend for digital and traditional marketing of automobiles. It includes a test drive, customer buying decisions, etc. Deliver an outstanding presentation on the topic using this Graph For Spending Trend Of Automobile Promotion Effective Car Dealer Marketing Strategy SS V. Dispense information and present a thorough explanation of Spending Trend Of Automobile, Promotion Effective Car using the slides given. This template can be altered and personalized to fit your needs. It is also available for immediate download. So grab it now.
-
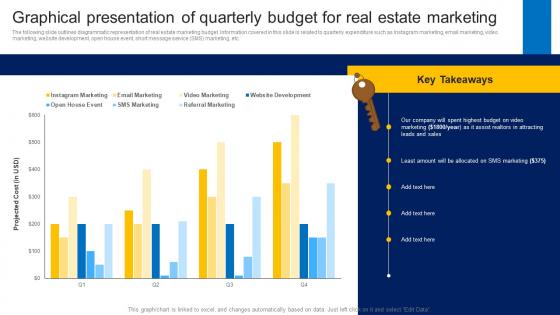 Graphical Presentation Of Quarterly Budget For Real How To Market Commercial And Residential Property MKT SS V
The following slide outlines diagrammatic representation of real estate marketing budget. Information covered in this slide is related to quarterly expenditure such as Instagram marketing, email marketing, video marketing, website development, open house event, short message service SMS marketing, etc. Present the topic in a bit more detail with this Graphical Presentation Of Quarterly Budget For Real How To Market Commercial And Residential Property MKT SS V. Use it as a tool for discussion and navigation on Projected Cost. This template is free to edit as deemed fit for your organization. Therefore download it now.
-
 Graphical Presentation Of Quarterly Budget For Online And Offline Marketing Strategies MKT SS V
The following slide outlines diagrammatic representation of real estate marketing budget. Information covered in this slide is related to quarterly expenditure such as Instagram marketing, email marketing, video marketing, website development, open house event, short message service SMS marketing, etc. Deliver an outstanding presentation on the topic using this Graphical Presentation Of Quarterly Budget For Online And Offline Marketing Strategies MKT SS V. Dispense information and present a thorough explanation of Graphical, Quarterly, Budget using the slides given. This template can be altered and personalized to fit your needs. It is also available for immediate download. So grab it now.
-
 Real Estate Branding Strategies To Attract Graphical Presentation Of Quarterly Budget MKT SS V
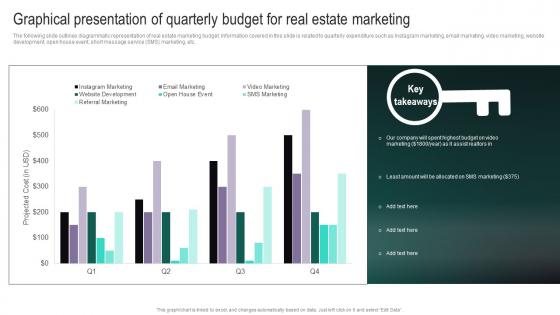
The following slide outlines diagrammatic representation of real estate marketing budget. Information covered in this slide is related to quarterly expenditure such as Instagram marketing, email marketing, video marketing, website development, open house event, short message service SMS marketing, etc. Deliver an outstanding presentation on the topic using this Real Estate Branding Strategies To Attract Graphical Presentation Of Quarterly Budget MKT SS V. Dispense information and present a thorough explanation of Projected Cost using the slides given. This template can be altered and personalized to fit your needs. It is also available for immediate download. So grab it now.
-
 Graphical Presentation Of Direct Marketing Direct Marketing Techniques To Reach New MKT SS V
The purpose of this slide is to outline graphical representation of direct marketing budget. The monthly budget is associated with multiple costs such as short message service SMS marketing, email marketing, catalogs, social media marketing, digital advertisement. Deliver an outstanding presentation on the topic using this Graphical Presentation Of Direct Marketing Direct Marketing Techniques To Reach New MKT SS V. Dispense information and present a thorough explanation of Company, Target, Catalogs using the slides given. This template can be altered and personalized to fit your needs. It is also available for immediate download. So grab it now.
-
 Dough Nut Graph For Operational Strategic Plan Effective Guide To Reduce Costs Strategy SS V
Deliver an outstanding presentation on the topic using this Dough Nut Graph For Operational Strategic Plan Effective Guide To Reduce Costs Strategy SS V. Dispense information and present a thorough explanation of Operational, Strategic, Plan using the slides given. This template can be altered and personalized to fit your needs. It is also available for immediate download. So grab it now.
-
 Graphical Representation Of Growing Us Intelligent Infrastructure Market
This slide showcases the growing market of US intelligent infrastructure market over the years. This includes parameters like safety and security management, energy management, building infrastructure management etc. Introducing our Graphical Representation Of Growing Us Intelligent Infrastructure Market set of slides. The topics discussed in these slides are Reduce Complexity, Streamline Daily Tasks, Simplify Unplanned Tasks This is an immediately available PowerPoint presentation that can be conveniently customized. Download it and convince your audience.
-
 Graph Showcasing Decline In Customer Promotion Strategies To Advertise Credit Strategy SS V
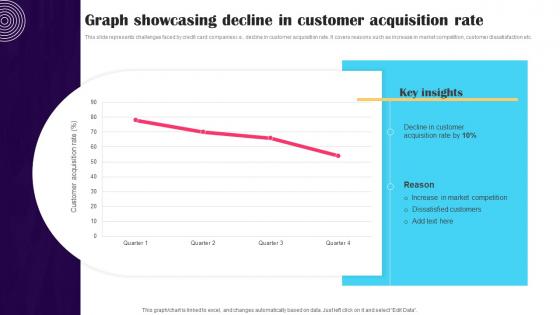
This slide represents challenges faced by credit card companies i.e., decline in customer acquisition rate. It covers reasons such as increase in market competition, customer dissatisfaction etc. Present the topic in a bit more detail with this Graph Showcasing Decline In Customer Promotion Strategies To Advertise Credit Strategy SS V. Use it as a tool for discussion and navigation on Customer, Acquisition, Decline. This template is free to edit as deemed fit for your organization. Therefore download it now.
-
 Microsoft Corporations Revenue Growth Graph Microsoft Strategy Analysis To Understand Strategy Ss V
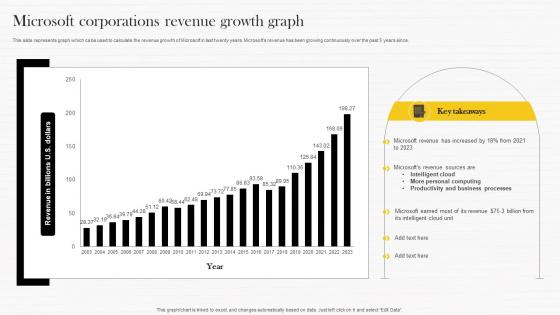
This slide represents graph which ca be used to calculate the revenue growth of Microsoft in last twenty years. Microsofts revenue has been growing continuously over the past 5 years since. Deliver an outstanding presentation on the topic using this Microsoft Corporations Revenue Growth Graph Microsoft Strategy Analysis To Understand Strategy SS V. Dispense information and present a thorough explanation of Growth, Revenue, Corporations using the slides given. This template can be altered and personalized to fit your needs. It is also available for immediate download. So grab it now.
-
 Dough Nut Graph Showing Demand Of Offered Complete Guide To Advertising Improvement Strategy SS V
Present the topic in a bit more detail with this Dough Nut Graph Showing Demand Of Offered Complete Guide To Advertising Improvement Strategy SS V. Use it as a tool for discussion and navigation on Doughnut, Sourdough, Strawberry Cupcake. This template is free to edit as deemed fit for your organization. Therefore download it now.
-
 Historical Revenue Apple Company Profile Ppt Graphics CP SS
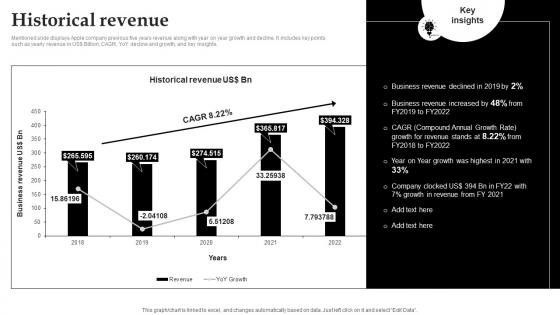
Mentioned slide displays Apple company previous five years revenue along with year on year growth and decline. It includes key points such as yearly revenue in USdollar Billion, CAGR, YoY decline and growth, and key insights. Deliver an outstanding presentation on the topic using this Historical Revenue Apple Company Profile Ppt Graphics CP SS. Dispense information and present a thorough explanation of Historical Revenue using the slides given. This template can be altered and personalized to fit your needs. It is also available for immediate download. So grab it now.
-
 Graphical Presentation Of Direct Marketing Most Common Types Of Direct Marketing MKT SS V
The purpose of this slide is to outline graphical representation of direct marketing budget. The monthly budget is associated with multiple costs such as short message service SMS marketing, email marketing, catalogs, social media marketing, digital advertisement. Present the topic in a bit more detail with this Graphical Presentation Of Direct Marketing Most Common Types Of Direct Marketing MKT SS V. Use it as a tool for discussion and navigation on Graphical, Direct, Budget. This template is free to edit as deemed fit for your organization. Therefore download it now.
-
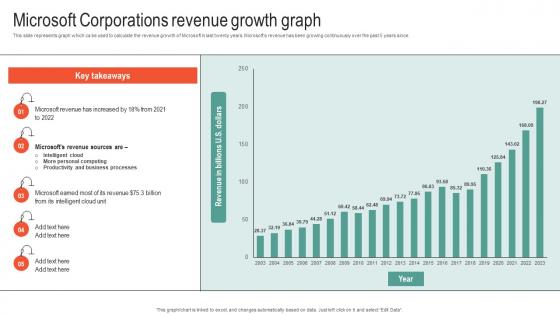 Microsoft Corporations Revenue Growth Graph Microsoft Business Strategy To Stay Ahead Strategy SS V
This slide represents graph which ca be used to calculate the revenue growth of Microsoft in last twenty years. Microsofts revenue has been growing continuously over the past 5 years since. Present the topic in a bit more detail with this Microsoft Corporations Revenue Growth Graph Microsoft Business Strategy To Stay Ahead Strategy SS V. Use it as a tool for discussion and navigation on Corporations, Revenue, Growth. This template is free to edit as deemed fit for your organization. Therefore download it now.
-
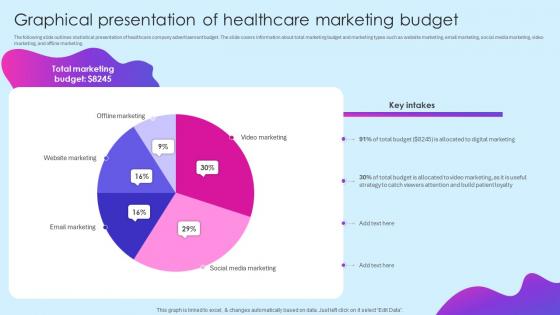 Graphical Presentation Of Budget Healthcare Marketing Ideas To Boost Sales Strategy SS V
The following slide outlines statistical presentation of healthcare company advertisement budget. The slide covers information about total marketing budget and marketing types such as website marketing, email marketing, social media marketing, video marketing, and offline marketing. Present the topic in a bit more detail with this Graphical Presentation Of Budget Healthcare Marketing Ideas To Boost Sales Strategy SS V. Use it as a tool for discussion and navigation on Graphical, Presentation, Marketing. This template is free to edit as deemed fit for your organization. Therefore download it now.
-
 Dough Nut Graph Showing Demand Of Offered Products New And Effective Guidelines For Cake Shop MKT SS V
Present the topic in a bit more detail with this Dough Nut Graph Showing Demand Of Offered Products New And Effective Guidelines For Cake Shop MKT SS V. Use it as a tool for discussion and navigation on Doughnut, Sourdough, Strawberry Cupcake. This template is free to edit as deemed fit for your organization. Therefore download it now.
-
 Dough Nut Graph For Operational Strategic Strategic Operations Management Techniques To Reduce Strategy SS V
Present the topic in a bit more detail with this Dough Nut Graph For Operational Strategic Strategic Operations Management Techniques To Reduce Strategy SS V. Use it as a tool for discussion and navigation on Graph For Operational, Strategic Plan. This template is free to edit as deemed fit for your organization. Therefore download it now.
-
 Executing Vehicle Marketing Graph For Spending Trend Of Automobile Promotion Strategy SS V
This slide represents a graph showing the spending trend for digital and traditional marketing of automobiles. It includes a test drive, customer buying decisions, etc. Deliver an outstanding presentation on the topic using this Executing Vehicle Marketing Graph For Spending Trend Of Automobile Promotion Strategy SS V Dispense information and present a thorough explanation of Decisions By Customers, Vehicles Online using the slides given. This template can be altered and personalized to fit your needs. It is also available for immediate download. So grab it now.
-
 Graphical Presentation Of Direct Marketing Best Marketing Strategies For Your D2C Brand MKT SS V
The purpose of this slide is to outline graphical representation of direct marketing budget. The monthly budget is associated with multiple costs such as short message service SMS marketing, email marketing, catalogs, social media marketing, digital advertisement. Deliver an outstanding presentation on the topic using this Graphical Presentation Of Direct Marketing Best Marketing Strategies For Your D2C Brand MKT SS V. Dispense information and present a thorough explanation of Marketing, Budget, Graphical using the slides given. This template can be altered and personalized to fit your needs. It is also available for immediate download. So grab it now.
-
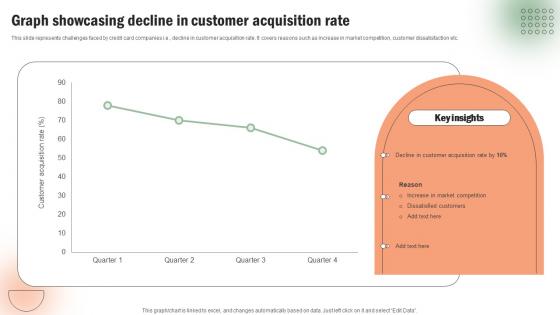 Graph Showcasing Decline In Customer Execution Of Targeted Credit Card Promotional Strategy SS V
This slide represents challenges faced by credit card companies i.e., decline in customer acquisition rate. It covers reasons such as increase in market competition, customer dissatisfaction etc. Present the topic in a bit more detail with this Graph Showcasing Decline In Customer Execution Of Targeted Credit Card Promotional Strategy SS V. Use it as a tool for discussion and navigation on Decline, Customer, Rate. This template is free to edit as deemed fit for your organization. Therefore download it now.
-
 Series A Investor Funding Elevator Shareholding Patterns Ppt File Graphics Example
This slide covers understanding of the shareholding pattern of the company. The purpose of this template is to provide an overview on shareholding of founder and other stakeholders along with percentages of shares in the company. Present the topic in a bit more detail with this Series A Investor Funding Elevator Shareholding Patterns Ppt File Graphics Example. Use it as a tool for discussion and navigation on Shareholding Patterns, Management Awards, Existing Opendoor Shareholders. This template is free to edit as deemed fit for your organization. Therefore download it now.
-
 Graphical Presentation Of Direct Marketing Direct Mail Marketing Strategies To Send MKT SS V
The purpose of this slide is to outline graphical representation of direct marketing budget. The monthly budget is associated with multiple costs such as short message service SMS marketing, email marketing, catalogs, social media marketing, digital advertisement. Present the topic in a bit more detail with this Graphical Presentation Of Direct Marketing Direct Mail Marketing Strategies To Send MKT SS V. Use it as a tool for discussion and navigation on Graphical, Presentation, Marketing. This template is free to edit as deemed fit for your organization. Therefore download it now.
-
 Food Industry KPI Graph Showcasing Percentage Of Food Wastage
This slide showcases the food industry KPI graph showcasing percentage of food wastage which helps an organization to follow production throughput in real time. It include details such as January, February, march april, may, june, etc. Presenting our well structured Food Industry KPI Graph Showcasing Percentage Of Food Wastage. The topics discussed in this slide are Industry, Percentage, Graph. This is an instantly available PowerPoint presentation that can be edited conveniently. Download it right away and captivate your audience.
-
 Industry And Food Safety KPI Graph
This slide showcases the industry and food safety KPI graph which helps an organization to measure performance against goals, identify areas for improvement, etc. It include details such as customer complaints, waste due to poor quality, etc. Presenting our well structured Industry And Food Safety KPI Graph. The topics discussed in this slide are Industry, Safety, Common. This is an instantly available PowerPoint presentation that can be edited conveniently. Download it right away and captivate your audience.
-
 Cybersecurity Kpis Graph For 5g Service Providers
This slide showcases the cybersecurity KPIs graph for 5G service provider which helps an organization to measure, detect threats early and respond effectively. It include detail such as cyber attacks prevention, indentify incident time, etc. Presenting our well structured Cybersecurity Kpis Graph For 5g Service Providers. The topics discussed in this slide are Survey Respondents, Companies Used.This is an instantly available PowerPoint presentation that can be edited conveniently. Download it right away and captivate your audience.
-
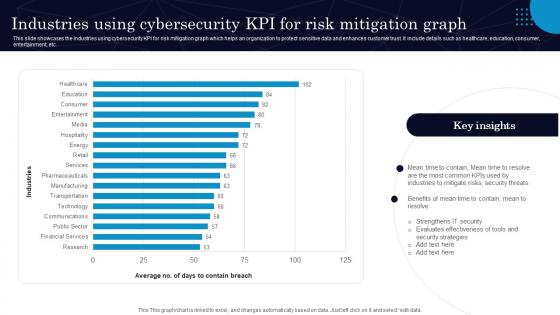 Industries Using Cybersecurity Kpi For Risk Mitigation Graph
This slide showcases the industries using cybersecurity KPI for risk mitigation graph which helps an organization to protect sensitive data and enhances customer trust. It include details such as healthcare, education, consumer, entertainment, etc. Presenting our well structured Industries Using Cybersecurity Kpi For Risk Mitigation Graph. The topics discussed in this slide are Mitigate Risks, Security Threats.This is an instantly available PowerPoint presentation that can be edited conveniently. Download it right away and captivate your audience.
-
 Graphical Presentation Of Direct Developing Direct Marketing Strategies MKT SS V
The purpose of this slide is to outline graphical representation of direct marketing budget. The monthly budget is associated with multiple costs such as short message service SMS marketing, email marketing, catalogs, social media marketing, digital advertisement. Present the topic in a bit more detail with this Graphical Presentation Of Direct Developing Direct Marketing Strategies MKT SS V. Use it as a tool for discussion and navigation on Audience, Website, Conversions. This template is free to edit as deemed fit for your organization. Therefore download it now.
-
 Comprehensive Guide To Understand Graph Highlighting Bitcoin Mining Reward Trends Fin SS
This slide shows information regrading the rewards earned by miners for adding blocks to blockchain on mining each successful block. It also includes reasons for decreasing Bitcoin reward value. Deliver an outstanding presentation on the topic using this Comprehensive Guide To Understand Graph Highlighting Bitcoin Mining Reward Trends Fin SS. Dispense information and present a thorough explanation of Blocks To Blockchain, Bitcoin Reward Value, Graph Highlighting Bitcoin, Mining Reward Trends using the slides given. This template can be altered and personalized to fit your needs. It is also available for immediate download. So grab it now.
-
 Comprehensive Guide To Understand Graph Highlighting Bitcoin Price Fluctuations Fin SS
This slide shows information regarding the bitcoin price changes over the years along with the key reasons for rise and fall in price. It also includes details about impact of Covid-19 on Bitcoin. Present the topic in a bit more detail with this Comprehensive Guide To Understand Graph Highlighting Bitcoin Price Fluctuations Fin SS. Use it as a tool for discussion and navigation on Bitcoin Price Fluctuations, Institutional Adoption, Acceptance Bitcoin, Bitcoin Price Touches. This template is free to edit as deemed fit for your organization. Therefore download it now.
-
 Snowflake Company Profile Total Assets Ppt Graphics CP SS
The following slide shows position of total current and non-current assets for three consecutive financial years i.e. from financial year ending 2021 to 2023 of Snowflake company. It also highlights the value of total assets. Present the topic in a bit more detail with this Snowflake Company Profile Total Assets Ppt Graphics CP SS. Use it as a tool for discussion and navigation on Current Assets, Fixed Assets. This template is free to edit as deemed fit for your organization. Therefore download it now.
-
 Contact Center Digital Transformation Market Size Graph By Solutions
This slide represents the analysis of contact center digital transformation market helping businesses to choose growing solution for customer engagement. It includes various solutions such as omnichannel routing, social media analytics, voice biometrics, etc. Presenting our well structured Contact Center Digital Transformation Market Size Graph By Solutions The topics discussed in this slide are Contact Center, Digital Transformation, Market Size Graph This is an instantly available PowerPoint presentation that can be edited conveniently. Download it right away and captivate your audience.
-
 Cloud Access Security Broker CASB V2 Use Cases Ppt Ideas Graphics Download
This slide represents the use cases of cloud access security broker. The purpose of this slide is to showcase the multiple use cases of cloud access security broker, covering protection against threats, governing usage, securing data, and enforcing data loss and compliance policies. Deliver an outstanding presentation on the topic using this Cloud Access Security Broker CASB V2 Use Cases Ppt Ideas Graphics Download. Dispense information and present a thorough explanation of Protection Against Threats, Secure Data, Upload Prevention And Encryption, Cloud Solutions With Transparency using the slides given. This template can be altered and personalized to fit your needs. It is also available for immediate download. So grab it now.
-
 Vulnerabilities Tracking Dashboard For Secops V2 Ppt Icon Graphics Template
This slide represents the vulnerabilities tracking dashboard for SecOps. The purpose of this slide is to demonstrate the tracking of vulnerabilities of an organizations assets, services with the most vulnerabilities, mean time to remediate, and the average age of vulnerabilities. Deliver an outstanding presentation on the topic using this Vulnerabilities Tracking Dashboard For Secops V2 Ppt Icon Graphics Template. Dispense information and present a thorough explanation of Vulnerabilities Tracking, Dashboard For Secops, Age Of Vulnerabilities, Mean Time To Remediate using the slides given. This template can be altered and personalized to fit your needs. It is also available for immediate download. So grab it now.
-
 Graphical Presentation Of Healthcare Marketing Budget Introduction To Healthcare Marketing Strategy SS V
The following slide outlines statistical presentation of healthcare company advertisement budget. The slide covers information about total marketing budget and marketing types such as website marketing, email marketing, social media marketing, video marketing, and offline marketing. Present the topic in a bit more detail with this Graphical Presentation Of Healthcare Marketing Budget Introduction To Healthcare Marketing Strategy SS V. Use it as a tool for discussion and navigation on Total Marketing Budget. This template is free to edit as deemed fit for your organization. Therefore download it now.
-
 Graphical Presentation Of Healthcare Hospital Marketing Plan To Improve Patient Strategy SS V
The following slide outlines statistical presentation of healthcare company advertisement budget. The slide covers information about total marketing budget and marketing types such as website marketing, email marketing, social media marketing, video marketing, and offline marketing. Present the topic in a bit more detail with this Graphical Presentation Of Healthcare Hospital Marketing Plan To Improve Patient Strategy SS V. Use it as a tool for discussion and navigation on Website Marketing, Video Marketing. This template is free to edit as deemed fit for your organization. Therefore download it now.
-
 Table Of Contents Smart Grid Technology Ppt Show Graphics Download
Present the topic in a bit more detail with this Table Of Contents Smart Grid Technology Ppt Show Graphics Download. Use it as a tool for discussion and navigation on Overview Of Smart Grid, Traditional Grid Overview, Grid Technology. This template is free to edit as deemed fit for your organization. Therefore download it now.
-
 Graphical Presentation Of Healthcare Building Brand In Healthcare Strategy SS V
The following slide outlines statistical presentation of healthcare company advertisement budget. The slide covers information about total marketing budget and marketing types such as website marketing, email marketing, social media marketing, video marketing, and offline marketing. Deliver an outstanding presentation on the topic using this Graphical Presentation Of Healthcare Building Brand In Healthcare Strategy SS V. Dispense information and present a thorough explanation of Website, Email, Marketing using the slides given. This template can be altered and personalized to fit your needs. It is also available for immediate download. So grab it now.
-
 Statistical Graph Illustrating Global Retail E Commerce Sales
This slide showcases the graphical presentations of worldwide retail E commerce sales which helps an organization to gain insights over meaningful data and ensures minimal downtime. It include details such as consumer satisfaction surveys, search engine optimization, targeted marketing, etc. Presenting our well structured Statistical Graph Illustrating Global Retail E Commerce Sales. The topics discussed in this slide are Expected, Satisfaction, Marketing. This is an instantly available PowerPoint presentation that can be edited conveniently. Download it right away and captivate your audience.
-
 Graph Illustrating Open Enrollment Communication Statistics
This slide showcases the chart representing open enrollment communication statistics which helps an organization to choose effective benefit plans that reduce and save their expenditure. It include details such as covers financial losses, protects family and changes lifestyle. Presenting our well structured Graph Illustrating Open Enrollment Communication Statistics. The topics discussed in this slide are Health Plans, Retirement Plans. This is an instantly available PowerPoint presentation that can be edited conveniently. Download it right away and captivate your audience.
-
 Statistical Graph Showcasing Market Penetration Of Food Brands
This slide showcases the statistical chart illustrating market penetration of reputed food brands which helps an organization to foster financial success through greater quantity of customers. It include details such as develop promotional opportunities, invest in sales personnel, etc. Introducing our Statistical Graph Showcasing Market Penetration Of Food Brands set of slides. The topics discussed in these slides are Develop Promotional Opportunities, Invest Sales Personnel, Collaborate Potential Firm. This is an immediately available PowerPoint presentation that can be conveniently customized. Download it and convince your audience.
-
 Graph Showcasing Decline In Customer Acquisition Rate Introduction Of Effective Strategy SS V
This slide represents challenges faced by credit card companies i.e. decline in customer acquisition rate. It covers reasons such as increase in market competition, customer dissatisfaction etc. Present the topic in a bit more detail with this Graph Showcasing Decline In Customer Acquisition Rate Introduction Of Effective Strategy SS V. Use it as a tool for discussion and navigation on Graph Showcasing Decline, Customer Acquisition Rate. This template is free to edit as deemed fit for your organization. Therefore download it now.
-
 Graphical Presentation Of Direct Marketing How To Develop Robust Direct MKT SS V
The purpose of this slide is to outline graphical representation of direct marketing budget. The monthly budget is associated with multiple costs such as short message service SMS marketing, email marketing, catalogs, social media marketing, digital advertisement. Present the topic in a bit more detail with this Graphical Presentation Of Direct Marketing How To Develop Robust Direct MKT SS V. Use it as a tool for discussion and navigation on Graphical, Presentation, Direct. This template is free to edit as deemed fit for your organization. Therefore download it now.
-
 Graphical Presentation Of Direct Marketing Budget Essential Guide To Direct MKT SS V
The purpose of this slide is to outline graphical representation of direct marketing budget. The monthly budget is associated with multiple costs such as short message service SMS marketing, email marketing, catalogs, social media marketing, digital advertisement. Deliver an outstanding presentation on the topic using this Graphical Presentation Of Direct Marketing Budget Essential Guide To Direct MKT SS V. Dispense information and present a thorough explanation of Graphical, Presentation, Marketing using the slides given. This template can be altered and personalized to fit your needs. It is also available for immediate download. So grab it now.
-
 Graph Indicating Increase In Overall Multiple Strategies For Cost Effectiveness
The slide highlights the lack of cost efficiency in the company that leads to increase in overall business expenses. It includes comparison of previous year costs to evaluate the rise in total business expenditure Present the topic in a bit more detail with this Graph Indicating Increase In Overall Multiple Strategies For Cost Effectiveness. Use it as a tool for discussion and navigation on Graph, Increase, Business. This template is free to edit as deemed fit for your organization. Therefore download it now.
-
 Cost Efficiency Strategies For Reducing Graph Indicating Increase In Overall Business Costs
The slide highlights the lack of cost efficiency in the company that leads to increase in overall business expenses. It includes comparison of previous year costs to evaluate the rise in total business expenditure. Present the topic in a bit more detail with this Cost Efficiency Strategies For Reducing Graph Indicating Increase In Overall Business Costs. Use it as a tool for discussion and navigation on Business Costs. This template is free to edit as deemed fit for your organization. Therefore download it now.
-
 Ad Supported Maus Spotify Company Profile Ppt Graphics CP SS
This slide showcases the increase decrease of ad supported monthly active users of Spotify, which is a KPI to measure the performance of business operations. It showcases five year performance from FY2018 to FY2022. Present the topic in a bit more detail with this Ad Supported Maus Spotify Company Profile Ppt Graphics CP SS. Use it as a tool for discussion and navigation on Represents, Preceding, Engagement. This template is free to edit as deemed fit for your organization. Therefore download it now.
-
 Graph Indicating Increase In Overall Business Costs Cost Reduction Techniques
The slide highlights the lack of cost efficiency in the company that leads to increase in overall business expenses. It includes comparison of previous year costs to evaluate the rise in total business expenditure. Present the topic in a bit more detail with this Graph Indicating Increase In Overall Business Costs Cost Reduction Techniques. Use it as a tool for discussion and navigation on According, Previous. This template is free to edit as deemed fit for your organization. Therefore download it now.
-
 Social Media Marketing Strategy Graphical Presentation Of Direct Marketing Budget MKT SS V
The purpose of this slide is to outline graphical representation of direct marketing budget. The monthly budget is associated with multiple costs such as short message service SMS marketing, email marketing, catalogs, social media marketing, digital advertisement. Present the topic in a bit more detail with this Social Media Marketing Strategy Graphical Presentation Of Direct Marketing Budget MKT SS V. Use it as a tool for discussion and navigation on Amount. This template is free to edit as deemed fit for your organization. Therefore download it now.
-
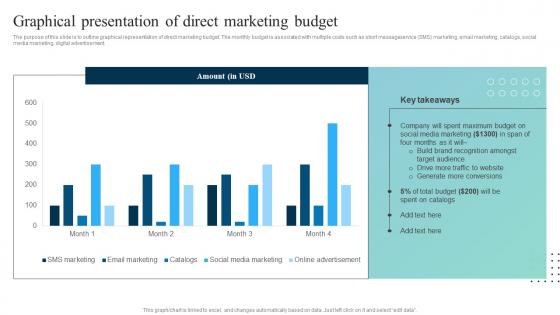 Graphical Presentation Of Direct Leveraging SMS Marketing Strategy For Better MKT SS V
The purpose of this slide is to outline graphical representation of direct marketing budget. The monthly budget is associated with multiple costs such as short messageservice SMS marketing, email marketing, catalogs, social media marketing, digital advertisement. Deliver an outstanding presentation on the topic using this Graphical Presentation Of Direct Leveraging SMS Marketing Strategy For Better MKT SS V. Dispense information and present a thorough explanation of Graphical, Marketing, Budget using the slides given. This template can be altered and personalized to fit your needs. It is also available for immediate download. So grab it now.
-
 Statistical Graph Showcasing The Ultimate Guide To Blockchain Integration IoT SS
This slide provides information related to challenges or concerns companies faced while deploying and operating blockchain IoT technologies. Some of the issues include regulatory issues, implementing legacy system, privacy concerns, lack of in house skills, etc. Present the topic in a bit more detail with this Statistical Graph Showcasing The Ultimate Guide To Blockchain Integration IoT SS. Use it as a tool for discussion and navigation on Statistical, Challenges, Businesses. This template is free to edit as deemed fit for your organization. Therefore download it now.
-
 Graphical Representation Of Improving IoT Device Cybersecurity IoT SS
The purpose of this slide is to display graphical representation of Internet of Things IoT security budget. Information covered in this slide is related to cybersecurity assessment, security hardware, security software, penetration testing, employee training, security monitoring, third party audit, etc. Present the topic in a bit more detail with this Graphical Representation Of Improving IoT Device Cybersecurity IoT SS. Use it as a tool for discussion and navigation on Graphical, Cybersecurity, Budget. This template is free to edit as deemed fit for your organization. Therefore download it now.


