Powerpoint Templates and Google slides for Graph.
Save Your Time and attract your audience with our fully editable PPT Templates and Slides.
-
 0314 business ppt diagram three staged circular graph powerpoint template
We are proud to present our 0314 business ppt diagram three staged circular graph powerpoint template. To display business concept use this three step interrelated diagram is can be used in any business presentation. This professional diagram is useful for business related presentation.
-
 Folders bar graph pie chart on puzzle square flat powerpoint design
We are proud to present our folders bar graph pie chart on puzzle square flat powerpoint design. Graphic of folders and bar graph with pie graph on square chart puzzle has been used to design this power point template diagram. This PPT diagram contains the concept of business problem solving. Use this PPT diagram for business and marketing related presentations.
-
 Effort Estimate Budgeting Upward Graph Business Project Development Flow Chart
This complete deck can be used to present to your team. It has PPT slides on various topics highlighting all the core areas of your business needs. This complete deck focuses on Effort Estimate Budgeting Upward Graph Business Project Development Flow Chart and has professionally designed templates with suitable visuals and appropriate content. This deck consists of total of eight slides. All the slides are completely customizable for your convenience. You can change the colour, text and font size of these templates. You can add or delete the content if needed. Get access to this professionally designed complete presentation by clicking the download button below.
-
 Campaign Performance Target Dashboard Assessment Analyzing Conversion Evaluation Graph
This complete deck covers various topics and highlights important concepts. It has PPT slides which cater to your business needs. This complete deck presentation emphasizes Campaign Performance Target Dashboard Assessment Analyzing Conversion Evaluation Graph and has templates with professional background images and relevant content. This deck consists of total of eight slides. Our designers have created customizable templates, keeping your convenience in mind. You can edit the colour, text and font size with ease. Not just this, you can also add or delete the content if needed. Get access to this fully editable complete presentation by clicking the download button below.
-
 Cash Flow Dashboard Kpis To Assess Business Performance Ppt Show Graphics Download
Following slide covers cash flow dashboard covering details like beginning cash on hand, cash going in, cash going out, profit or loss and ending cash on hand. It also includes detail of accounts receivable and payable. Present the topic in a bit more detail with this Cash Flow Dashboard Kpis To Assess Business Performance Ppt Show Graphics Download. Use it as a tool for discussion and navigation on Dashboard, Accounts, Receivable. This template is free to edit as deemed fit for your organization. Therefore download it now.
-
 Table Of Contents For Business Intelligence Solution Ppt Show Graphics Template
Deliver an outstanding presentation on the topic using this Table Of Contents For Business Intelligence Solution Ppt Show Graphics Template. Dispense information and present a thorough explanation of Business, Intelligence, Solution using the slides given. This template can be altered and personalized to fit your needs. It is also available for immediate download. So grab it now.
-
 Impact Of Workforce Development On Organization Ppt Show Graphics Pictures
This slide represents impact of employee development program. It highlights increase in employee productivity and lower turnover rate that results in increase in revenue generation, high employee morale etc. Present the topic in a bit more detail with this Impact Of Workforce Development On Organization Ppt Show Graphics Pictures. Use it as a tool for discussion and navigation on Workforce, Development, Organization. This template is free to edit as deemed fit for your organization. Therefore download it now.
-
 Natural Language AI Budget To Implement NLP In Company Ppt Professional Graphics Template
This slide represents the budget to implement NLP in the company by elaborating spending on marketing, hiring of experts, employees trAIning, and equipment update. Deliver an outstanding presentation on the topic using this Natural Language AI Budget To Implement NLP In Company Ppt Professional Graphics Template. Dispense information and present a thorough explanation of Marketing, Employees TrAIning, Equipment Upgrade using the slides given. This template can be altered and personalized to fit your needs. It is also avAIlable for immediate download. So grab it now.
-
 Analyzing Present Scenario Of Firm Ppt Powerpoint Presentation Diagram Images Ppt Gallery Graphic Images
This slide provides information regarding the present situation firm financial with revenues generated and net profit earned. Present the topic in a bit more detail with this Analyzing Present Scenario Of Firm Ppt Powerpoint Presentation Diagram Images Ppt Gallery Graphic Images. Use it as a tool for discussion and navigation on Scenario Of Firm, Depicting Stable, Revenues Generated. This template is free to edit as deemed fit for your organization. Therefore download it now.
-
 User Experience Enhancement Understand Customer Wants And Expectations Ppt Pictures Graphics Design
This slide shows the key insights of what customer wants and why they are frustrated from poor customer service. Deliver an outstanding presentation on the topic using this User Experience Enhancement Understand Customer Wants And Expectations Ppt Pictures Graphics Design Dispense information and present a thorough explanation of Customer Service, Customer Frustration using the slides given. This template can be altered and personalized to fit your needs. It is also available for immediate download. So grab it now.
-
 Conagra Financial Highlights Convenience Food Industry Report Ppt Graphics
Present the topic in a bit more detail with this Conagra Financial Highlights Convenience Food Industry Report Ppt Graphics. Use it as a tool for discussion and navigation on Diluted Earnings, Financial Highlights, Common Stakeholders. This template is free to edit as deemed fit for your organization. Therefore download it now.
-
 Dx four staged bar graph result growth analysis powerpoint template
Presenting dx four staged bar graph result growth analysis powerpoint template. Graphic of four staged bar graph has been used to craft this power point template diagram. This PPT diagram contains the concept of result and growth analysis representation. This PPT diagram can be used for business and marketing related presentations.
-
 Lp four stage book design bar graph and icons powerpoint template
Presenting lp four stage book design bar graph and icons powerpoint template. Four staged book design bar graph diagram has been used to craft this power point template diagram. This PPT diagram contains the concept of business result analysis representation. Use this PPT diagram for business and marketing related presentations.
-
 Jg 3d graphic text boxes with icons powerpoint template
Presenting jg 3d graphic text boxes with icons powerpoint template. This Power Point template diagram has been crafted with graphic of 3d text boxes and icons diagram. This PPT diagram contains the concept of business information representation .Use this PPT diagram for business and marketing related presentations.
-
 Ks four staged gear bar graph and icons powerpoint template
Presenting ks four staged gear bar graph and icons powerpoint template. Four staged gear, bar graph and icons has been used to craft this Power Point template diagram. This PPT diagram contains the concept of process control and result analysis representation. Use this PPT diagram for business and marketing related presentations.
-
 Four staged stack bar graph powerpoint template slide
We are proud to present our four staged stack bar graph powerpoint template slide. Four staged stack bar graph has been used to craft this power point template diagram. This PPT diagram contains the concept of process flow and result analysis representation. Use this PPT diagram for business and marketing related presentations.
-
 Mq four staged lego blocks bar graph with icons powerpoint template slide
Presenting mq four staged lego blocks bar graph with icons powerpoint template slide. Four staged Lego block and bar graph has been used to craft this power point template diagram. This PPT diagram contains the concept of business strategy and result analysis. Use this PPT diagram for marketing and business related presentations.
-
 Mt four steps lego blocks bar graph with icons powerpoint template slide
Presenting mt four steps lego blocks bar graph with icons powerpoint template slide. Four staged Lego block and bar graph with icons has been used to craft this power point template diagram. This PPT diagram contains the concept of business planning and result analysis. Use this PPT diagram for marketing and business related presentations.
-
 Md bar graph on mobile screen for business growth analysis powerpoint temptate
Presenting md bar graph on mobile screen for business growth analysis powerpoint temptate. This Power Point template diagram has been crafted with graphic of mobile screen and bar graph diagram. This PPT diagram contains the concept of business growth analysis representation. Use this PPT diagram for business and marketing related presentations.
-
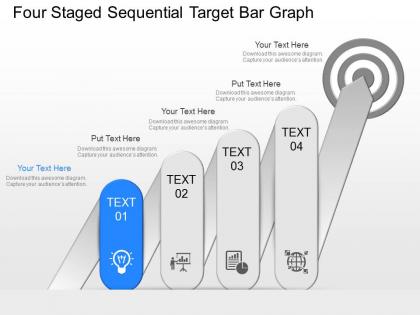 Gh four staged sequential target bar graph powerpoint template
Presenting gh four staged sequential target bar graph powerpoint template. Four staged sequential target bar graph diagram has been used to craft this Power Point template diagram. This PPT diagram contains the concept of business target selection .Use this PPT diagram for business and marketing related presentations.
-
 Jb 3 axis graph cube diagram powerpoint template
Presenting jb 3 axis graph cube diagram powerpoint template. This Power Point template diagram has been crafted with graphic of three axis graph cube diagram. This PPT diagram contains the concept of business result analysis representation. Use this PPT diagram for business and marketing related presentations.
-
 New teamwork bar graph for idea generation and result analysis powerpoint template
Perfect resolution of the icons and the pictures in the slides. Allow instant downloading of the slide template. Trouble-free insertion of the brand name in the background. Compatible with Microsoft Office programs and Google Slides. Offer 100% access to edit and modify the slide design. Beneficial for the Sales and Marketing professionals and the business managers.
-
 Graphical hierarchy of project powerpoint presentation
Presenting graphical hierarchy of project powerpoint presentation. This is a graphical hierarchy of project powerpoint presentation. This is a four stage process. The stages in this process are graphical hierarchy of project, project scope management, identifies all tasks, foundation of the project.
-
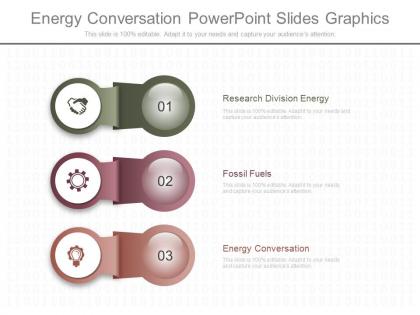 Energy conversation powerpoint slides graphics
Presenting energy conversation powerpoint slides graphics. This is a energy conversation powerpoint slides graphics. This is a three stage process. The stages in this process are research division energy, fossil fuels, energy conversation.
-
 Different business management entrepreneurship ppt powerpoint slide graphics
Presenting different business management entrepreneurship ppt powerpoint slide graphics. This is a business management entrepreneurship ppt powerpoint slide graphics. This is nine stage process. The stages in this proces are finding the required resources, using networks extensively, motivation to make a difference, spotting and exploiting opportunities, overcoming obstacles, controlling the business, financial, social, aesthetic capital, showing determination in the face of adversity, managing risk.
-
 Original e commerce ppt info graphic template
Presenting original e commerce ppt info graphic template. This is a e commerce ppt info graphic template. This is eight stage process. The stages in this proces are business friendly ecommerce software, create a web store with a difference, make your hot sellers most visible, do not let your customer forget you, increase your web presence, learn faster and better, surprise your customer, strong business planning, web commerce.
-
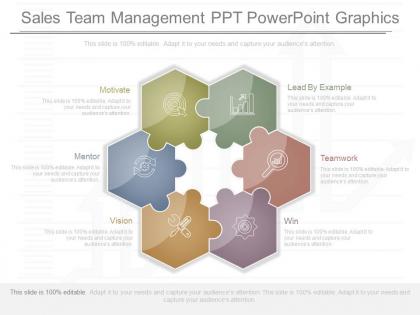 Download sales team management ppt powerpoint graphics
PowerPoint slides accessible in standard and widescreen view. PPT designs are well-suited with Google slides. PowerPoint templates can be easily modified as required. Instant download and sharing is easy. Design can be transformed into JPEG and PDF document. Suitable for sales management and leadersThe stages in this process are motivate, mentor, vision, win, teamwork, lead by example.
-
 Pptx sample of sales promotion techniques diagram presentation graphics
Presenting pptx sample of sales promotion techniques diagram presentation graphics. Presenting pptx sample of sales promotion techniques diagram presentation graphics. This is a sample of sales promotion techniques diagram presentation graphics. This is a thirteen stage process. The stages in this process are discounts, refunds, gifts, quantity deal, samples, contest, instant draws, lucky draw, usable benefits, full finance, packaged premium, container premium, rebate.
-
 Custom framework for online campaigns presentation graphics
Presenting custom framework for online campaigns presentation graphics. This is a framework for online campaigns presentation graphics. This is a four stage process. The stages in this process are public relations, social media, advertisements, news, online campaigns.
-
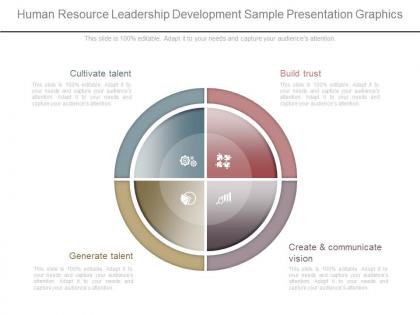 One human resource leadership development sample presentation graphics
Presenting one human resource leadership development sample presentation graphics. This is a human resource leadership development sample presentation graphics. This is a four stage process. The stages in this process are cultivate talent, build trust, create and communicate vision, generate talent.
-
 Use investment and retirement portfolios powerpoint slide graphics
Presenting use investment and retirement portfolios powerpoint slide graphics. This is a investment and retirement portfolios powerpoint slide graphics. This is a seven stage process. The stages in this process are deposits, shares, unit trusts, property, forex, bonds, annuities.
-
 Different conversion in sales sample diagram powerpoint graphics
Presenting different conversion in sales sample diagram powerpoint graphics. This is a conversion in sales sample diagram powerpoint graphics. This is five stage process. The stages in this proces are aware, consider, convert, become loyal, advocate.
-
 Present corporate team building ideas powerpoint graphics
Presenting present corporate team building ideas powerpoint graphics. This is a corporate team building ideas powerpoint graphics. This is four stage process. The stages in this proces are facilitation, skill development, team building, agenda design.
-
 See business management consultant ppt powerpoint graphics
Presenting see business management consultant ppt powerpoint graphics. This is a business management consultant ppt powerpoint graphics. This is a three stage process. The stages in this process are marketing, finance, advisory.
-
 Use business analysis services ppt presentation graphics
Maintenance of predominant quality visuals all through the PPT templates. Compatible with wide screen yield, without the dread of pixilation. Can be adequately utilized with any number of on the web and disconnected programming. The business slide illustration is agreeable with various organization choices. Easy to add your organization logo, trademark, and name. Edit the PPT shape, hues, shade, content and more to make it more particular to your substance. Used by advertising experts, deals chiefs and venture administrators, business, marketers, banking, entrepreneurs, professionals, and students. The stages in this process are hierarchy in business service, analysis service, management and planning service, management and planning service, elicitation service, analysis and documentation service, communication service, assessment and validation service.
-
 Apt analytical crm graphical design ppt slides
Presenting apt analytical crm graphical design ppt slides. This is a analytical crm graphical design ppt slides. This is a six stage process. The stages in this process are customer acquisition, customer retention, customer information, cross selling, up-selling, retail current cutomers, offer key information to customers effectively.
-
 Original online business advertising layout presentation graphics
Presenting original online business advertising layout presentation graphics. This is a online business advertising layout presentation graphics. This is a four stage process. The stages in this process are visitor, your website, visitor leaves, your ad on other sites, visitor returns to your site.
-
 Different disciplined investment approach sample powerpoint graphics
Presenting different disciplined investment approach sample powerpoint graphics. This is a disciplined investment approach sample powerpoint graphics. This is a three stage process. The stages in this process are portfolio management, quantitative research, fundamental research.
-
 Download talent management consulting arrow graph presentation outline
Presenting download talent management consulting arrow graph presentation outline. Presenting download talent management consulting arrow graph presentation outline. This is a talent management consulting arrow graph presentation outline. This is a three stage process. The stages in this process are development planning, future talent, capacity enhancement.
-
 Apt challenges in e commerce diagram powerpoint graphics
Presenting apt challenges in e commerce diagram powerpoint graphics. This is a challenges in e commerce diagram powerpoint graphics. This is a ten stage process. The stages in this process are consumer decision to buy, consumer orders product, order transmission, warehouse picking, order personalization, order delivery management , order received, reconsidered purchases, item returned to warehouse inspected, disposition route management.
-
 Pptx achieve successful project execution sample presentation graphics
Presenting pptx achieve successful project execution sample presentation graphics. This is a achieve successful project execution sample presentation graphics. This is a three stage process. The stages in this process are adapt, integrate, innovate, project execution.
-
 Pptx business management information process ppt presentation graphics
Presenting pptx business management information process ppt presentation graphics. This is a business management information process ppt presentation graphics. This is a five stage process. The stages in this process are advanced degree, bachelors degree, less than, high school diploma or ged.
-
 Use core e commerce value chain ppt powerpoint graphics
Presenting use core e commerce value chain ppt powerpoint graphics. This is a core e commerce value chain ppt powerpoint graphics. This is a six stage process. The stages in this process are sourcing and managing inventory, access to e commerce site, customization and recommendation, pay and purchase, shipping, tracking and delivery, customer service.
-
 View brand groupings ppt background graphics
Presenting view brand groupings ppt background graphics. This is a brand groupings ppt background graphics. This is a ten stage process. The stages in this process are endorser and sub brands, benefits brands, co brands, driver roles, brand groupings, brand hierarchy trees, brand range, strategic brands, linchpin brands, visual presentation.
-
 Ppt creative and diversifying mix ppt background graphics
Presenting ppt creative and diversifying mix ppt background graphics. This is a creative and diversifying mix ppt background graphics. This is a six stage process. The stages in this process are taxable bonds, reits, low volatility hedge funds, mlps, high dividend stocks, municipal bonds.
-
 Original sales strategy services ppt powerpoint graphics
PowerPoint slides are compatible with Google slides. Multiple display options available such as standard and widescreen. 100% editable designs for you to show your creativity. Similar designs available with different nodes and stages. Easy to convert into JPEG or PDF format. Perfect for sales management and sales executives.The stages in this process are sales management, sales talent management, sales force structure and size, sales process, lead generation, account segmentation, primolut.
-
 See timeline project ideas layout powerpoint graphics
Quick and easy to download at any time. Edit text to suit the contextual requirement. Completely modifiable color scheme, outlines and contrast. Change orientation of any infographic and resize PPT images as per your need. Insert anywhere within your own presentation for greatest impact. Incorporate your own icons, tagline, brand name, logo etc.
-
 Use real estate marketing automation template powerpoint graphics
Presenting use real estate marketing automation template powerpoint graphics. This is a real estate marketing automation template powerpoint graphics. This is a four stage process. The stages in this process are automate, capture, segment, assign.
-
 App basic money management diagram powerpoint graphics
Presenting app basic money management diagram powerpoint graphics. This is a basic money management diagram powerpoint graphics. This is five stage process. The stages in this proces are understanding money, understanding yourself, your rights and responsibilities, managing everyday money, planning ahead, selecting financial products suitable for you.
-
 Pptx advertising campaign graphics presentation powerpoint
Presenting pptx advertising campaign graphics presentation powerpoint. This is a advertising campaign graphics presentation powerpoint. This is six stage process. The stages in this proces are social graphic, behavioral, psychographic, geographic, demographic, target marketing.
-
 Different customer satisfaction measurement tools presentation graphics
Presenting different customer satisfaction measurement tools presentation graphics. This is a customer satisfaction measurement tools presentation graphics. This is three stage process. The stages in this proces are monitoring satisfaction, measurement techniques, influence of customer satisfaction, customer complaints.
-
 Use advertising campaign graphics ppt background graphics
Presenting use advertising campaign graphics ppt background graphics. This is a advertising campaign graphics ppt background graphics. This is five stage process. The stages in this proces are social graphic, behavioral, psychographic, geographic, demographic.
-
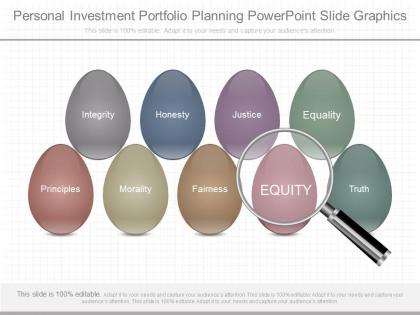 Download personal investment portfolio planning powerpoint slide graphics
Presenting download personal investment portfolio planning powerpoint slide graphics. This is a personal investment portfolio planning powerpoint slide graphics. This is a nine stage process. The stages in this process are integrity, honesty, justice, equality, principles, morality, fairness, truth, equity.
-
 Different identifying targets with unrealized potential example powerpoint graphics
Presenting different identifying targets with unrealized potential example powerpoint graphics. This is a identifying targets with unrealized potential example powerpoint graphics. This is a one stage process. The stages in this process are market potential, industry sales forecast, company sales forecast, unrealized Potential.
-
 New critical element of customer experience diagram powerpoint graphics
Presenting new critical element of customer experience diagram powerpoint graphics. This is a critical element of customer experience diagram powerpoint graphics. This is a four stage process. The stages in this process are customer, service manager team, production acceptance team, hardware, software, technology, suppliers, project manager.
-
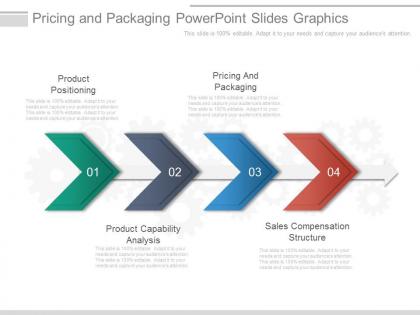 Pricing and packaging powerpoint slide graphics
Presenting pricing and packaging powerpoint slide graphics. This is a pricing and packaging powerpoint slide graphics. This is a four stage process. The stages in this process are product positioning, pricing and packaging, product capability analysis, sales compensation structure.
-
 Progress meeting powerpoint graphics
Presenting progress meeting powerpoint graphics. This is a progress meeting powerpoint graphics. This is a four stage process. The stages in this process are evaluating overall project performance, team development, developing team and individual, progress meeting.
-
 App strategic account sales skills process ppt presentation graphics
Presenting app strategic account sales skills process ppt presentation graphics. This is a strategic account sales skills process ppt presentation graphics. This is a five stage process. The stages in this process are strategy, research, action plan, execution, review, sales.
-
 Management meeting agenda presentation graphics
Presenting management meeting agenda presentation graphics. This is a management meeting agenda presentation graphics. This is a four stage process. The stages in this process are purpose, organize items, describe each item, set time limit.
-
 Requirements management process powerpoint graphics
An universal PowerPoint visual narratives clenching the content matter effectively , Manageable to PDF, JPG or other various file configurations, Arduous Presentation graphics for entreating the viewer’s, Scope available to replace dummy Presentation template diagrams, Erratic vector based visuals ,symbols, texts, pictures etc., Presenting your business idea through an immense quality visual options,The stages in this process are quality, schedule, budget, resources, risk, scope.


