Powerpoint Templates and Google slides for Graph Showing
Save Your Time and attract your audience with our fully editable PPT Templates and Slides.
-
 Continuous Improvement Icon Showing Circular Arrow With Gear Circular Arrows With Graph
We bring to you to the point topic specific slides with apt research and understanding. Putting forth our PPT deck comprises of twelve slides. Our tailor made Continuous Improvement Icon Showing Circular Arrow With Gear Circular Arrows With Graph editable presentation deck assists planners to segment and expound the topic with brevity. The advantageous slides on Continuous Improvement Icon Showing Circular Arrow With Gear Circular Arrows With Graph is braced with multiple charts and graphs, overviews, analysis templates agenda slides etc. to help boost important aspects of your presentation. Highlight all sorts of related usable templates for important considerations. Our deck finds applicability amongst all kinds of professionals, managers, individuals, temporary permanent teams involved in any company organization from any field.
-
 Identifying Gaps In Workplace Graph Chart Showcasing Gender Inequality In Workplace
This slide highlights gender inequality in the workplace in order to determine the reasons behind biasedness and improve organizational performance.It includes men and women distribution in leadership and managerial roles and in labor force roles. Deliver an outstanding presentation on the topic using this Identifying Gaps In Workplace Graph Chart Showcasing Gender Inequality In Workplace Dispense information and present a thorough explanation of Leadership Managerial Roles, Labor Force using the slides given. This template can be altered and personalized to fit your needs. It is also available for immediate download. So grab it now.
-
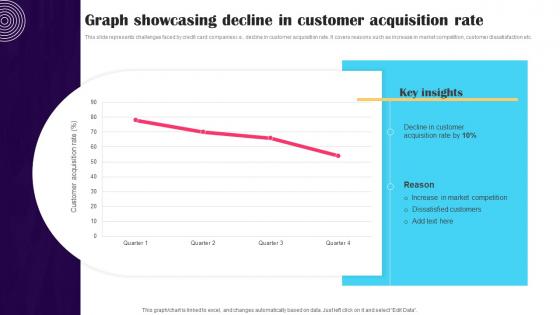 Graph Showcasing Decline In Customer Promotion Strategies To Advertise Credit Strategy SS V
This slide represents challenges faced by credit card companies i.e., decline in customer acquisition rate. It covers reasons such as increase in market competition, customer dissatisfaction etc. Present the topic in a bit more detail with this Graph Showcasing Decline In Customer Promotion Strategies To Advertise Credit Strategy SS V. Use it as a tool for discussion and navigation on Customer, Acquisition, Decline. This template is free to edit as deemed fit for your organization. Therefore download it now.
-
 Dough Nut Graph Showing Demand Of Offered Complete Guide To Advertising Improvement Strategy SS V
Present the topic in a bit more detail with this Dough Nut Graph Showing Demand Of Offered Complete Guide To Advertising Improvement Strategy SS V. Use it as a tool for discussion and navigation on Doughnut, Sourdough, Strawberry Cupcake. This template is free to edit as deemed fit for your organization. Therefore download it now.
-
 Dough Nut Graph Showing Demand Of Offered Products New And Effective Guidelines For Cake Shop MKT SS V
Present the topic in a bit more detail with this Dough Nut Graph Showing Demand Of Offered Products New And Effective Guidelines For Cake Shop MKT SS V. Use it as a tool for discussion and navigation on Doughnut, Sourdough, Strawberry Cupcake. This template is free to edit as deemed fit for your organization. Therefore download it now.
-
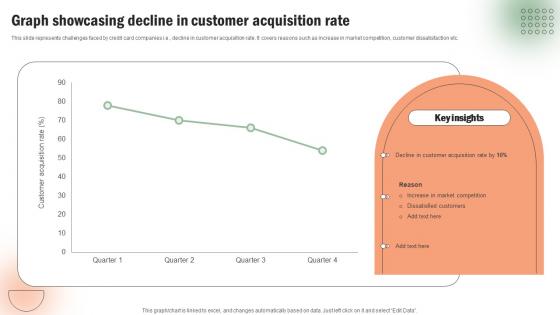 Graph Showcasing Decline In Customer Execution Of Targeted Credit Card Promotional Strategy SS V
This slide represents challenges faced by credit card companies i.e., decline in customer acquisition rate. It covers reasons such as increase in market competition, customer dissatisfaction etc. Present the topic in a bit more detail with this Graph Showcasing Decline In Customer Execution Of Targeted Credit Card Promotional Strategy SS V. Use it as a tool for discussion and navigation on Decline, Customer, Rate. This template is free to edit as deemed fit for your organization. Therefore download it now.
-
 Food Industry KPI Graph Showcasing Percentage Of Food Wastage
This slide showcases the food industry KPI graph showcasing percentage of food wastage which helps an organization to follow production throughput in real time. It include details such as January, February, march april, may, june, etc. Presenting our well structured Food Industry KPI Graph Showcasing Percentage Of Food Wastage. The topics discussed in this slide are Industry, Percentage, Graph. This is an instantly available PowerPoint presentation that can be edited conveniently. Download it right away and captivate your audience.
-
 Statistical Graph Showcasing Market Penetration Of Food Brands
This slide showcases the statistical chart illustrating market penetration of reputed food brands which helps an organization to foster financial success through greater quantity of customers. It include details such as develop promotional opportunities, invest in sales personnel, etc. Introducing our Statistical Graph Showcasing Market Penetration Of Food Brands set of slides. The topics discussed in these slides are Develop Promotional Opportunities, Invest Sales Personnel, Collaborate Potential Firm. This is an immediately available PowerPoint presentation that can be conveniently customized. Download it and convince your audience.
-
 Graph Showcasing Decline In Customer Acquisition Rate Introduction Of Effective Strategy SS V
This slide represents challenges faced by credit card companies i.e. decline in customer acquisition rate. It covers reasons such as increase in market competition, customer dissatisfaction etc. Present the topic in a bit more detail with this Graph Showcasing Decline In Customer Acquisition Rate Introduction Of Effective Strategy SS V. Use it as a tool for discussion and navigation on Graph Showcasing Decline, Customer Acquisition Rate. This template is free to edit as deemed fit for your organization. Therefore download it now.
-
 Statistical Graph Showcasing The Ultimate Guide To Blockchain Integration IoT SS
This slide provides information related to challenges or concerns companies faced while deploying and operating blockchain IoT technologies. Some of the issues include regulatory issues, implementing legacy system, privacy concerns, lack of in house skills, etc. Present the topic in a bit more detail with this Statistical Graph Showcasing The Ultimate Guide To Blockchain Integration IoT SS. Use it as a tool for discussion and navigation on Statistical, Challenges, Businesses. This template is free to edit as deemed fit for your organization. Therefore download it now.
-
 Employer Brand Proposition Graph Showcasing Productivity
This slide showcases the employer brand proposition graph showcasing productivity which helps an organization to boost perception both externally and internally. It include details such as nurture existing talent within company, develop employee referral program, etc. Presenting our well structured Employer Brand Proposition Graph Showcasing Productivity. The topics discussed in this slide are Key Reason, Strategies Overcome Talent Shortage, Performers Most Complex. This is an instantly available PowerPoint presentation that can be edited conveniently. Download it right away and captivate your audience.
-
 Statistical Graph Showcasing Smart Meter Comprehensive Guide On IoT Enabled IoT SS
This slide showcases information about the global market size of smart meters. It includes key reasons such as government initiatives to promote energy conversation, smart city initiatives, accurate billing process, etc. Deliver an outstanding presentation on the topic using this Statistical Graph Showcasing Smart Meter Comprehensive Guide On IoT Enabled IoT SS. Dispense information and present a thorough explanation of Multifactor Authentication, Employee Training, Password Strength using the slides given. This template can be altered and personalized to fit your needs. It is also available for immediate download. So grab it now.
-
 Statistical Graph Showcasing Mobile Notifications Used By Industries
This slide showcases the statistical graph illustrating cell phone notifications employed by different industries which helps an organization to target accurate consumers and increase user retention rates. It include details such as listed users for sending most relevant notifications, etc. Introducing our Statistical Graph Showcasing Mobile Notifications Used By Industries set of slides. The topics discussed in these slides are Marketing Strategy, Push Notifications. This is an immediately available PowerPoint presentation that can be conveniently customized. Download it and convince your audience.
-
 Graph Showing Cyber Security Threats In Various Industries
This slide demonstrates cybersecurity threats for deploying AUP to leverage techniques and determine safety of personal identifiable information. It includes various sectors such as financial institutions, healthcare, manufacturing, public administration, retail trade, etc. Introducing our Graph Showing Cyber Security Threats In Various Industries set of slides. The topics discussed in these slides are Business Services, Financial Institutions, Software Service This is an immediately available PowerPoint presentation that can be conveniently customized. Download it and convince your audience.
-
 IoT Applications In Oil And Gas Statistical Graph Showcasing Reasons For Pipeline Damage IoT SS
The following slide provides a statistical graph showcasing the causes of pipeline damage incidents. It includes reasons such as excavation damage, incorrect operation, material failure of pipe, natural force damage, equipment failure, etc. Present the topic in a bit more detail with this IoT Applications In Oil And Gas Statistical Graph Showcasing Reasons For Pipeline Damage IoT SS. Use it as a tool for discussion and navigation on Fatal Accidents, Environmental Consequences, Property Damage, Statistical Graph. This template is free to edit as deemed fit for your organization. Therefore download it now.
-
 Graph Showing Cryptocurrency Mining Market Size
This slide demonstrates cryptocurrency mining graph and includes aspects such as market drivers and opportunities. Presenting our well structured Graph Showing Cryptocurrency Mining Market Size. The topics discussed in this slide are Graph Showing, Cryptocurrency, Market Size. This is an instantly available PowerPoint presentation that can be edited conveniently. Download it right away and captivate your audience.
-
 Graph Showcasing Customer Churn Forecasting
This slide shows graph which can be used to highlight forecasted customer churn of organization. It includes customer churn prediction for coming quarters along with the key reason of churn. Introducing our Graph Showcasing Customer Churn Forecasting set of slides. The topics discussed in these slides are Forecasting, Adequate, Potential. This is an immediately available PowerPoint presentation that can be conveniently customized. Download it and convince your audience.
-
 Graph Showing Consumer Expectations About Order Tracking
This slide demonstrates consumer expectations about order tracking and includes track packages, high expectations for tracking, check tracking information, etc. Presenting our well structured Graph Showing Consumer Expectations About Order Tracking. The topics discussed in this slide are High Expectation, Low Expectation, Key Factors. This is an instantly available PowerPoint presentation that can be edited conveniently. Download it right away and captivate your audience.
-
 Graph Showing Incident Response Cybersecurity Challenges
This slide highlights cybersecurity challenges for establishing effective framework to manage incidents, protecting assets, and ensuring business resilience. It includes bases such as growth drivers and opportunities available. Presenting our well structured Graph Showing Incident Response Cybersecurity Challenges The topics discussed in this slide are Growth Drivers, Opportunities Available This is an instantly available PowerPoint presentation that can be edited conveniently. Download it right away and captivate your audience.
-
 Statistical Graph Showcasing Digital Transformation Impact On Customer Engagement
This slide represents graph to measure customer engagement KPIs by e commerce companies after digital transformation. It includes various KPIs such as customer retention rate, lead generation rate, and click through rate. Introducing our Statistical Graph Showcasing Digital Transformation Impact On Customer Engagement set of slides. The topics discussed in these slides are Integrated Digital Transformation, Digital Transformation. This is an immediately available PowerPoint presentation that can be conveniently customized. Download it and convince your audience.
-
 Graph Showing E Commerce Fraud By Payment Methods
This slide demonstrates e commerce fraud by payment methods and includes wire transfers, credit cards, reload cards, bank account debit, etc. Introducing our Graph Showing E Commerce Fraud By Payment Methods set of slides. The topics discussed in these slides are Highest Financial Loss, Preventive Measures, Payment Methods. This is an immediately available PowerPoint presentation that can be conveniently customized. Download it and convince your audience.
-
 Graph Showing Organization Data Strategy Framework
This slide illustrates data strategy framework and includes market drivers and key factors. Deliver an outstanding presentation on the topic using this Graph Showing Organization Data Strategy Framework. Dispense information and present a thorough explanation of Foster Innovation, Least Used Method, Market Drivers, Key Factors using the slides given. This template can be altered and personalized to fit your needs. It is also available for immediate download. So grab it now.
-
 Stock Price Performance Graph Amazon Company Profile Ppt Show Gallery CP SS
The following slide outlines performance of Amazon stock price which compares cumulative total return on common stock in NYSE Technology Index, SandP 500 Index and the SandP 500 Retailing Index. Deliver an outstanding presentation on the topic using this Stock Price Performance Graph Amazon Company Profile Ppt Show Gallery CP SS Dispense information and present a thorough explanation of Stock Price Performance Graph using the slides given. This template can be altered and personalized to fit your needs. It is also available for immediate download. So grab it now.
-
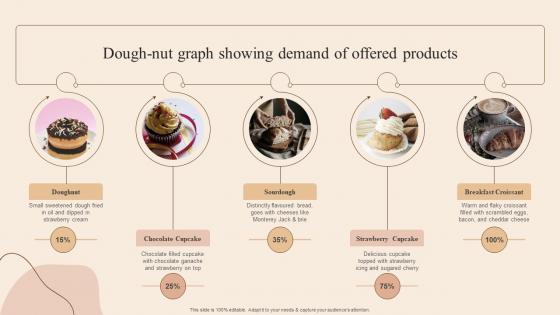 Dough Nut Graph Showing Demand Of Developing Actionable Advertising Plan Tactics MKT SS V
Increase audience engagement and knowledge by dispensing information using Dough Nut Graph Showing Demand Of Developing Actionable Advertising Plan Tactics MKT SS V. This template helps you present information on five stages. You can also present information on Products, Demand, Showing using this PPT design. This layout is completely editable so personaize it now to meet your audiences expectations.
-
 Quantitative Research Icon Showcasing Bar Graph
Presenting our set of slides with Quantitative Research Icon Showcasing Bar Graph. This exhibits information on three stages of the process. This is an easy to edit and innovatively designed PowerPoint template. So download immediately and highlight information on Quantitative Research, Showcasing Bar Graph.
-
 Database Marketing Icon Showcasing Graphs On Laptop
Presenting our set of slides with Database Marketing Icon Showcasing Graphs On Laptop This exhibits information on Three stages of the process. This is an easy to edit and innovatively designed PowerPoint template. So download immediately and highlight information on Database Marketing Icon, Showcasing Graphs On Laptop
-
 Graph Showcasing Annual Gross Profit Icon
Introducing our premium set of slides with Graph Showcasing Annual Gross Profit Icon. Ellicudate the three stages and present information using this PPT slide. This is a completely adaptable PowerPoint template design that can be used to interpret topics like Graph, Showcasing Annual, Gross Profit Icon. So download instantly and tailor it with your information.
-
 Trading Account Opening Icon Showing Revenue Graphs
Introducing our premium set of slides with Trading Account Opening Icon Showing Revenue Graphs Ellicudate the Three stages and present information using this PPT slide. This is a completely adaptable PowerPoint template design that can be used to interpret topics like Trading Account Opening, Icon Showing Revenue Graphs. So download instantly and tailor it with your information.
-
 Product managements success graph ppt slide show
Presenting product managements success graph ppt slide show. This is a product managements success graph ppt slide show. This is a four stage process. The stages in this process are sales driven, market driven, competitor driven, customer driven, path to profitability, unit sales growth, customer satisfaction, technology driven.
-
 Growth Graph Showing Digital Market Transformation
Introducing our Growth Graph Showing Digital Market Transformation set of slides. The topics discussed in these slides are Loyal Customer, Indecisive Customer, Lapsed Customer. This is an immediately available PowerPoint presentation that can be conveniently customized. Download it and convince your audience.
-
 Line Graph Showing Growth In Customer Conversion Rate
Presenting our well structured Line Graph Showing Growth In Customer Conversion Rate. The topics discussed in this slide are Growth, Customer Conversion Rate. This is an instantly available PowerPoint presentation that can be edited conveniently. Download it right away and captivate your audience.
-
 Product Performance Comparison Graph Showing Revenue Growth
Introducing our Product Performance Comparison Graph Showing Revenue Growth set of slides. The topics discussed in these slides are Sales Revenue, Revenue Growth, Product Performance Comparison. This is an immediately available PowerPoint presentation that can be conveniently customized. Download it and convince your audience.
-
 Sales Growth Graph Showing Annual Product Performance
Presenting our well structured Sales Growth Graph Showing Annual Product Performance. The topics discussed in this slide are Sales Growth, Annual Product Performance. This is an instantly available PowerPoint presentation that can be edited conveniently. Download it right away and captivate your audience.
-
 Sales By Region Graph Showing Revenue From Top Countries
Introducing our Sales By Region Graph Showing Revenue From Top Countries set of slides. The topics discussed in these slides are Sales By Region, Graph Showing Revenue, Top Countries. This is an immediately available PowerPoint presentation that can be conveniently customized. Download it and convince your audience.
-
 Graph Showing Most Popular Payment Methods Used In USA Market
This slide shows the payment methods used worldwide for trade monthly. It includes bank transfers, check, cash and credit card. Presenting our well structured Graph Showing Most Popular Payment Methods Used In USA Market. The topics discussed in this slide are Bank Transfers, Improved Cyber Security Practices, Payment Methods. This is an instantly available PowerPoint presentation that can be edited conveniently. Download it right away and captivate your audience.
-
 Market Graph Showing Revenue Breakdown Of FMCG Company
This slide shows the percentage of revenue generated in fast moving consumable goods industry from different segments which are food products, households, personal, baby and hair care, OTC products and others. Introducing our Market Graph Showing Revenue Breakdown Of FMCG Company set of slides. The topics discussed in these slides are Food Product, Generating Product Category, Revenue. This is an immediately available PowerPoint presentation that can be conveniently customized. Download it and convince your audience.
-
 Market Graph Showing Revenue Breakdown Of IT Products
This slide shows the revenue comparison graph of IT products over last six months. IT products covered in the slide are hardware and software. Presenting our well structured Market Graph Showing Revenue Breakdown Of IT Products. The topics discussed in this slide are Market Graph, Revenue Breakdown, IT Products. This is an instantly available PowerPoint presentation that can be edited conveniently. Download it right away and captivate your audience.
-
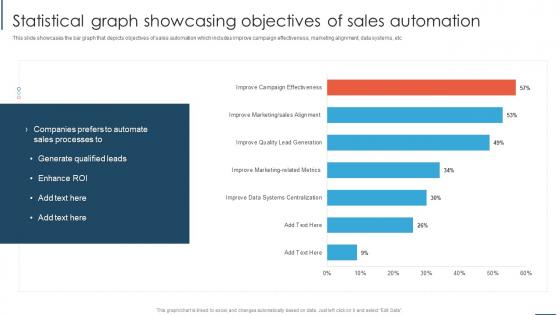 Statistical Graph Showcasing Objectives Of Sales Automation Overview And Importance Of Sales Automation
This slide showcases the bar graph that depicts objectives of sales automation which includes improve campaign effectiveness, marketing alignment, data systems, etc Present the topic in a bit more detail with this Statistical Graph Showcasing Objectives Of Sales Automation Overview And Importance Of Sales Automation. Use it as a tool for discussion and navigation on Automation, Effectiveness, Marketing. This template is free to edit as deemed fit for your organization. Therefore download it now.
-
 Graph Showing Total Operating Expenses By Quarter
This slide contains a graph showing the quarter wise operating expenses of an organization that will help the managers or directors of the company to make decisions for the betterment of an organization. Presenting our well structured Graph Showing Total Operating Expenses By Quarter. The topics discussed in this slide are Operating Expenses, Graph Showing, Operating Expenses. This is an instantly available PowerPoint presentation that can be edited conveniently. Download it right away and captivate your audience.
-
 Graph Showcasing Region Wise Equity Raised
This slide presents a statistical data of region based private equity funding which can be used by financial advisors to make alterations in their financial structure accordingly. The elements covered are capital raised using private equity in America, Asia, Europe and rest of the world. Introducing our Graph Showcasing Region Wise Equity Raised set of slides. The topics discussed in these slides are Amount, Pe Funding, Investors. This is an immediately available PowerPoint presentation that can be conveniently customized. Download it and convince your audience.
-
 Dough Nut Graph Showing Demand Of Offered Products Streamlined Advertising Plan
Present the topic in a bit more detail with this Dough Nut Graph Showing Demand Of Offered Products Streamlined Advertising Plan. Use it as a tool for discussion and navigation on Doughnut, Chocolate Cupcake, Sourdough, Strawberry Cupcake. This template is free to edit as deemed fit for your organization. Therefore download it now.
-
 Graph Showcasing Decline In Customer Acquisition Deployment Of Effective Credit Stratergy Ss
This slide represents challenges faced by credit card companies i.e., decline in customer acquisition rate. It covers reasons such as increase in market competition, customer dissatisfaction etc.Present the topic in a bit more detail with this Graph Showcasing Decline In Customer Acquisition Deployment Of Effective Credit Stratergy Ss. Use it as a tool for discussion and navigation on Customer Acquisition, Dissatisfied Customers, Increase Market Competition. This template is free to edit as deemed fit for your organization. Therefore download it now.
-
 Graph Showcasing Decline In Customer Implementation Of Successful Credit Card Strategy SS V
This slide represents challenges faced by credit card companies i.e., decline in customer acquisition rate. It covers reasons such as increase in market competition, customer dissatisfaction etc. Present the topic in a bit more detail with this Graph Showcasing Decline In Customer Implementation Of Successful Credit Card Strategy SS V. Use it as a tool for discussion and navigation on Graph Showcasing Decline, Customer Acquisition Rate This template is free to edit as deemed fit for your organization. Therefore download it now.
-
 Graph Showcasing Decline In Customer Acquisition Building Credit Card Promotional Campaign Strategy SS V
This slide represents challenges faced by credit card companies i.e., decline in customer acquisition rate. It covers reasons such as increase in market competition, customer dissatisfaction etc. Present the topic in a bit more detail with this Graph Showcasing Decline In Customer Acquisition Building Credit Card Promotional Campaign Strategy SS V. Use it as a tool for discussion and navigation on Customer Acquisition Rate, Reason. This template is free to edit as deemed fit for your organization. Therefore download it now.
-
 Dough Nut Graph Showing Demand Elevating Sales Revenue With New Bakery MKT SS V
Deliver an outstanding presentation on the topic using this Dough Nut Graph Showing Demand Elevating Sales Revenue With New Bakery MKT SS V. Dispense information and present a thorough explanation of Strawberry Cream, Chocolate Ganache, Cheddar Cheese using the slides given. This template can be altered and personalized to fit your needs. It is also available for immediate download. So grab it now.
-
 Business kpi showing employee analysing the graph of companys performance indicator
Presenting this set of slides with name - Business Kpi Showing Employee Analysing The Graph Of Companys Performance Indicator. This is a four stage process. The stages in this process are Business Kpi, Business Dashboard, Business Metrics.
-
 Profit patterns with increasing bar graphs showing quarter
Presenting this set of slides with name - Profit Patterns With Increasing Bar Graphs Showing Quarter. This is a three stage process. The stages in this process are Engineering, Procurement And Construction, Construction Management, Engineering, Purchasing And Construction .
-
 Quantitative bar graph chart showing survey respondents
Presenting this set of slides with name - Quantitative Bar Graph Chart Showing Survey Respondents. This is a five stage process. The stages in this process are Quantitative, Financial Analysis, Statistical Modelling.
-
 Business kpi showing graphs key performance indicator in tablets and documents
Presenting this set of slides with name - Business Kpi Showing Graphs Key Performance Indicator In Tablets And Documents. This is a four stage process. The stages in this process are Business Kpi, Business Dashboard, Business Metrics.
-
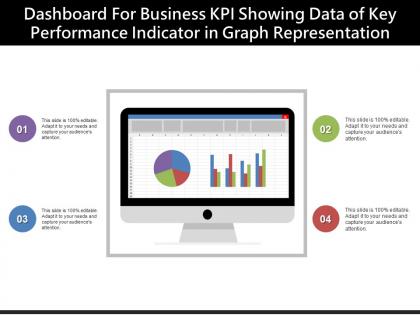 Dashboard for business kpi showing data of key performance indicator in graph representation
Presenting this set of slides with name - Dashboard For Business Kpi Showing Data Of Key Performance Indicator In Graph Representation. This is a four stage process. The stages in this process are Business Kpi, Business Dashboard, Business Metrics.
-
 Summary of key performance showing graphical representation of business kpi in bar graphs and pie charts
Presenting this set of slides with name - Summary Of Key Performance Showing Graphical Representation Of Business Kpi In Bar Graphs And Pie Charts. This is a three stage process. The stages in this process are Business Kpi, Business Dashboard, Business Metrics.
-
 Visualization representation of business kpi data showing chart and graph of financial data
Presenting this set of slides with name - Visualization Representation Of Business Kpi Data Showing Chart And Graph Of Financial Data. This is a four stage process. The stages in this process are Business Kpi, Business Dashboard, Business Metrics.
-
 Hr dashboard shown by humans and bar graphs
Presenting this set of slides with name - Hr Dashboard Shown By Humans And Bar Graphs. This is a three stage process. The stages in this process are Hr Dashboard, Human Resource Dashboard, Hr Kpi.
-
 Percentage comparison showing data comparison through bar graph and line graph
Presenting this set of slides with name - Percentage Comparison Showing Data Comparison Through Bar Graph And Line Graph. This is a four stage process. The stages in this process are Percentage Comparison, Percentage Compare, Percentage Balancing.
-
 Competitive analysis showing sales vs price graph
Delivering competitive analysis showing sales versus price graph PPT design. PowerPoint slide is adaptable with number of software such as JPG and PDF. Fully adaptable presentation template can be edited easily. Wonderful picture quality with access to include business credentials like name, logo and tagline. Presentation diagram merge well with Google Slides. PPT graphic is obtainable with high resolution picture as pixels never break and gives great visual experience.
-
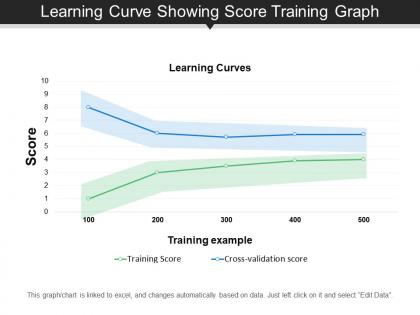 Learning curve showing score training graph
Presenting this set of slides with name - Learning Curve Showing Score Training Graph. This is a two stage process. The stages in this process are Experience Curve, Learning Curve.
-
 Sales waterfall showing yearly profit bar graph
Presenting this set of slides with name - Sales Waterfall Showing Yearly Profit Bar Graph. This is a five stage process. The stages in this process are Sales Waterfall, Waterfall Chart.
-
 People showing loss by graph image
Presenting this set of slides with name People Showing Loss By Graph Image. The topics discussed in these slides are Graph, Decline, Arrow. This is a completely editable PowerPoint presentation and is available for immediate download. Download now and impress your audience.
-
 Bar graph showing company quarterly increasing trend in revenue
Presenting this set of slides with name Bar Graph Showing Company Quarterly Increasing Trend In Revenue. The topics discussed in these slides are Revenue Trend, Finance, Chart And Graph. This is a completely editable PowerPoint presentation and is available for immediate download. Download now and impress your audience.
-
 Bar graph showing company quarterly revenue trend projection
Presenting this set of slides with name Bar Graph Showing Company Quarterly Revenue Trend Projection. The topics discussed in these slides are Revenue Trend, Finance, Chart And Graph. This is a completely editable PowerPoint presentation and is available for immediate download. Download now and impress your audience.


