Powerpoint Templates and Google slides for Graph Line
Save Your Time and attract your audience with our fully editable PPT Templates and Slides.
-
 Line Graph Powerpoint Ppt Template Bundles
Deliver a lucid presentation by utilizing this Line Graph Powerpoint Ppt Template Bundles. Use it to present an overview of the topic with the right visuals, themes, shapes, and graphics. This is an expertly designed complete deck that reinforces positive thoughts and actions. Use it to provide visual cues to your audience and help them make informed decisions. A wide variety of discussion topics can be covered with this creative bundle such as Product Performance, Sales Growth, Financial Results, Global Expansion. All the twelve slides are available for immediate download and use. They can be edited and modified to add a personal touch to the presentation. This helps in creating a unique presentation every time. Not only that, with a host of editable features, this presentation can be used by any industry or business vertical depending on their needs and requirements. The compatibility with Google Slides is another feature to look out for in the PPT slideshow.
-
 Linear flow straight graph 8 stages inspection business powerpoint templates
We are proud to present our linear flow straight graph 8 stages inspection business powerpoint templates. This Diagram is best suited to streamline the processes for your audience to follow in order to interconnect with each other. Step by step develop the entire picture and project it onto their minds.
-
 Business powerpoint templates linear flow process graph sales ppt slides 5 stages
With these pre-designed process arrows you can visualize almost any type of concept, chronological process or steps of your strategies. Use these upright arrows to make your presentation more attractive. The structure of our Diagrams allows you to effectively highlight the key issues concerning the growth of your business.
-
 Visual Line Graph Analytics Icon
Presenting our set of slides with Visual Line Graph Analytics Icon. This exhibits information on three stages of the process. This is an easy to edit and innovatively designed PowerPoint template. So download immediately and highlight information on Visual Line Graph, Analytics Icon.
-
 Consistent Lines Graph In Powerpoint And Google Slides Cpb
Presenting Consistent Lines Graph In Powerpoint And Google Slides Cpb slide which is completely adaptable. The graphics in this PowerPoint slide showcase four stages that will help you succinctly convey the information. In addition, you can alternate the color, font size, font type, and shapes of this PPT layout according to your content. This PPT presentation can be accessed with Google Slides and is available in both standard screen and widescreen aspect ratios. It is also a useful set to elucidate topics like Consistent Lines Graph. This well structured design can be downloaded in different formats like PDF, JPG, and PNG. So, without any delay, click on the download button now.
-
 Data Virtualisation Through Graph Line Icon
Introducing our premium set of slides with Data Virtualisation Through Graph Line Icon. Ellicudate the four stages and present information using this PPT slide. This is a completely adaptable PowerPoint template design that can be used to interpret topics like Data Virtualization, Through Graph Line, Icon. So download instantly and tailor it with your information.
-
 Line Graph Representing Macroeconomic Financial Stability And Flows
This slide focuses on the graphical representation of financial stability and flows in macroeconomy which shows the yearly financial flows of total net flows, direct investment, portfolio investment, change in reserves and other investments. Introducing our Line Graph Representing Macroeconomic Financial Stability And Flows set of slides. The topics discussed in these slides are Total Net Flows, Direct Investment, Net, Portfolio Investment, Net, 2015 To 2025. This is an immediately available PowerPoint presentation that can be conveniently customized. Download it and convince your audience.
-
 Line Graph Showing Growth In Customer Conversion Rate
Presenting our well structured Line Graph Showing Growth In Customer Conversion Rate. The topics discussed in this slide are Growth, Customer Conversion Rate. This is an instantly available PowerPoint presentation that can be edited conveniently. Download it right away and captivate your audience.
-
 Line Comparison Graph For Yearly Liquidity Ratio Comparison
This slide showcases liquidity ratios graph that can help in identifying cash richness and financial position of organization. It showcases comparison for last 6 years and it key components are current ratio, quick ratio and cash ratio Introducing our Line Comparison Graph For Yearly Liquidity Ratio Comparison set of slides. The topics discussed in these slides are Current Ratio, Quick Ratio, Cash Ratio. This is an immediately available PowerPoint presentation that can be conveniently customized. Download it and convince your audience.
-
 Budget Line Graph For Innovation Sprint Trends
This slide shows the line graph representing the budget and innovation sprint trends. It shows the average budget spent on innovation and the upcoming trends in the innovation sprint. Introducing our Budget Line Graph For Innovation Sprint Trends set of slides. The topics discussed in these slides are Budget Line Graph, Innovation, Sprint Trends. This is an immediately available PowerPoint presentation that can be conveniently customized. Download it and convince your audience.
-
 Line Graph Online Marketing With Twitter Ppt Powerpoint Presentation File Infographic Template
Deliver an outstanding presentation on the topic using this Line Graph Online Marketing With Twitter Ppt Powerpoint Presentation File Infographic Template. Dispense information and present a thorough explanation of Line Graph using the slides given. This template can be altered and personalized to fit your needs. It is also available for immediate download. So grab it now.
-
 Current state future state line graph powerpoint slide deck template
Presenting current state future state line graph powerpoint slide deck template. This is a current state future state line graph powerpoint slide deck template. This is a two stage process. The stages in this process are problem solution, current state future state, before after, challenges solutions, compare, comparison.
-
 Business kpi showing key performance indicator of company through target point and line graph
Presenting this set of slides with name - Business Kpi Showing Key Performance Indicator Of Company Through Target Point And Line Graph. This is a three stage process. The stages in this process are Business Kpi, Business Dashboard, Business Metrics.
-
 Business kpi showing summary of key performance indicator data representation in line graph and pie chart
Presenting this set of slides with name - Business Kpi Showing Summary Of Key Performance Indicator Data Representation In Line Graph And Pie Chart. This is a three stage process. The stages in this process are Business Kpi, Business Dashboard, Business Metrics.
-
 Percentage comparison showing data comparison through bar graph and line graph
Presenting this set of slides with name - Percentage Comparison Showing Data Comparison Through Bar Graph And Line Graph. This is a four stage process. The stages in this process are Percentage Comparison, Percentage Compare, Percentage Balancing.
-
 Product roadmap timeline 2d linear graph illustrating future technologies powerpoint templates slides
We are proud to present our product roadmap timeline 2d linear graph illustrating future technologies powerpoint templates slides. This PPT slide is perfect to show future economic, social, technological, and environmental conditions. The mind is always whirring with new ideas. Put them down and present them using our innovative Diagram. Activate the minds of your team with your ideas. Illustrate to them how it will take them to the very top.
-
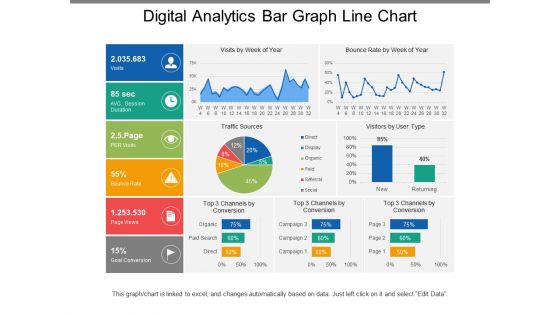 Digital analytics bar graph line chart
Presenting this set of slides with name - Digital Analytics Bar Graph Line Chart. This is a five stage process. The stages in this process are Digital Analytics, Digital Dashboard, Digital Kpis.
-
 Graph linear equation ppt powerpoint presentation portfolio pictures cpb
Presenting Graph Linear Equation Ppt Powerpoint Presentation Portfolio Pictures Cpb slide which is completely adaptable. The graphics in this PowerPoint slide showcase five stages that will help you succinctly convey the information. In addition, you can alternate the color, font size, font type, and shapes of this PPT layout according to your content. This PPT presentation can be accessed with Google Slides and is available in both standard screen and widescreen aspect ratios. It is also a useful set to elucidate topics like Graph Linear Equation. This well structured design can be downloaded in different formats like PDF, JPG, and PNG. So, without any delay, click on the download button now.
-
 Graphing Linear Functions Ppt Powerpoint Presentation Inspiration Graphics Example Cpb
Presenting our Graphing Linear Functions Ppt Powerpoint Presentation Inspiration Graphics Example Cpb PowerPoint template design. This PowerPoint slide showcases four stages. It is useful to share insightful information on Graphing Linear Functions This PPT slide can be easily accessed in standard screen and widescreen aspect ratios. It is also available in various formats like PDF, PNG, and JPG. Not only this, the PowerPoint slideshow is completely editable and you can effortlessly modify the font size, font type, and shapes according to your wish. Our PPT layout is compatible with Google Slides as well, so download and edit it as per your knowledge.
-
 Log Linear Analysis Graph In Powerpoint And Google Slides Cpb
Presenting Log Linear Analysis Graph In Powerpoint And Google Slides Cpb slide which is completely adaptable. The graphics in this PowerPoint slide showcase five stages that will help you succinctly convey the information. In addition, you can alternate the color, font size, font type, and shapes of this PPT layout according to your content. This PPT presentation can be accessed with Google Slides and is available in both standard screen and widescreen aspect ratios. It is also a useful set to elucidate topics like Log Linear Analysis Graph. This well structured design can be downloaded in different formats like PDF, JPG, and PNG. So, without any delay, click on the download button now.
-
 Line Graph Icon Representing Increase In Internet Trend
Presenting our well-structured Line Graph Icon Representing Increase In Internet Trend. The topics discussed in this slide are Line Graph Icon, Increase In Internet Trend. This is an instantly available PowerPoint presentation that can be edited conveniently. Download it right away and captivate your audience.
-
 Budget Graph Icon With Magnifying Glass And Trend Line
Presenting our set of slides with Budget Graph Icon With Magnifying Glass And Trend Line. This exhibits information on one stages of the process. This is an easy to edit and innovatively designed PowerPoint template. So download immediately and highlight information on Budget Graph Icon, Magnifying Glass, Trend Line.
-
 Data Lineage IT Overview Of Graph Data Lineage Visualization Ppt Presentation Outline Information
This slide gives an overview of graph data lineage visualization that enables business users to view and analyze data lineage to find solutions without technical skills. The search bar feature allows users to search for any data set or property in the database. Introducing Data Lineage IT Overview Of Graph Data Lineage Visualization Ppt Presentation Outline Information to increase your presentation threshold. Encompassed with six stages, this template is a great option to educate and entice your audience. Dispence information on Enables Business, Examine Data, Requiring Technical, using this template. Grab it now to reap its full benefits.
-
 Project outcomes displaying comparative graph line
Presenting this set of slides with name Project Outcomes Displaying Comparative Graph Line. The topics discussed in these slides are Project Outcome, Target, Goal. This is a completely editable PowerPoint presentation and is available for immediate download. Download now and impress your audience.
-
 Product Line Extension Strategies SWOT Analysis Ppt Diagram Graph Charts
Increase audience engagement and knowledge by dispensing information using Product Line Extension Strategies SWOT Analysis Ppt Diagram Graph Charts. This template helps you present information on four stages. You can also present information on Weaknesses, Strengths, Opportunities, Threats using this PPT design. This layout is completely editable so personaize it now to meet your audiences expectations.
-
 Linear Regression Graph In Powerpoint And Google Slides Cpb
Presenting Linear Regression Graph In Powerpoint And Google Slides Cpb slide which is completely adaptable. The graphics in this PowerPoint slide showcase six stages that will help you succinctly convey the information. In addition, you can alternate the color, font size, font type, and shapes of this PPT layout according to your content. This PPT presentation can be accessed with Google Slides and is available in both standard screen and widescreen aspect ratios. It is also a useful set to elucidate topics like Linear Regression Graph. This well structured design can be downloaded in different formats like PDF, JPG, and PNG. So, without any delay, click on the download button now.
-
 Data Lineage And Data Provenance Ppt Powerpoint Presentation Diagram Graph Charts
This slide represents the data lineage and data provenance that represents data flow at summary and detail levels. The components of both concepts include a file transfer protocol server, data staging area, data warehouse, master data, data marts, and so on. Deliver an outstanding presentation on the topic using this Data Lineage And Data Provenance Ppt Powerpoint Presentation Diagram Graph Charts. Dispense information and present a thorough explanation of Data Provenance, Ecommerce Wed Site, Customer Service using the slides given. This template can be altered and personalized to fit your needs. It is also available for immediate download. So grab it now.
-
 Overview Of Graph Data Lineage Visualization Data Lineage Types It
This slide gives an overview of graph data lineage visualization that enables business users to view and analyze data lineage to find solutions without technical skills. The search bar feature allows users to search for any data set or property in the database. Increase audience engagement and knowledge by dispensing information using Overview Of Graph Data Lineage Visualization Data Lineage Types It. This template helps you present information on six stages. You can also present information on Data Lineage Visualization, Enables Business, Data Component using this PPT design. This layout is completely editable so personaize it now to meet your audiences expectations.
-
 Data Lineage Importance It Overview Of Graph Data Lineage Visualization
This slide gives an overview of graph data lineage visualization that enables business users to view and analyze data lineage to find solutions without technical skills. The search bar feature allows users to search for any data set or property in the database. Increase audience engagement and knowledge by dispensing information using Data Lineage Importance It Overview Of Graph Data Lineage Visualization. This template helps you present information on six stages. You can also present information on Visualization, Overview, Associations using this PPT design. This layout is completely editable so personaize it now to meet your audiences expectations.
-
 Line Graph Analysis Colored Icon In Powerpoint Pptx Png And Editable Eps Format
Give your next presentation a sophisticated, yet modern look with this 100 percent editable Line graph analysis colored icon in powerpoint pptx png and editable eps format. Choose from a variety of customizable formats such as PPTx, png, eps. You can use these icons for your presentations, banners, templates, One-pagers that suit your business needs.
-
 Line Graph Analysis Monotone Icon In Powerpoint Pptx Png And Editable Eps Format
Make your presentation profoundly eye-catching leveraging our easily customizable Line graph analysis monotone icon in powerpoint pptx png and editable eps format. It is designed to draw the attention of your audience. Available in all editable formats, including PPTx, png, and eps, you can tweak it to deliver your message with ease.
-
 Overview Of Graph Data Lineage Visualization Data Lineage Techniques IT
This slide gives an overview of graph data lineage visualization that enables business users to view and analyze data lineage to find solutions without technical skills. The search bar feature allows users to search for any data set or property in the database. Introducing Overview Of Graph Data Lineage Visualization Data Lineage Techniques IT to increase your presentation threshold. Encompassed with six stages, this template is a great option to educate and entice your audience. Dispence information on Data Lineage Visualization, Business, Solutions, using this template. Grab it now to reap its full benefits.
-
 ETL Data Lineage Overview Of Graph Data Lineage Visualization
This slide gives an overview of graph data lineage visualization that enables business users to view and analyze data lineage to find solutions without technical skills. The search bar feature allows users to search for any data set or property in the database. Introducing ETL Data Lineage Overview Of Graph Data Lineage Visualization to increase your presentation threshold. Encompassed with six stages, this template is a great option to educate and entice your audience. Dispence information on Network, Data Component, Requiring, using this template. Grab it now to reap its full benefits.
-
 Business Growth Strategies Line Graph Icon
Introducing our premium set of slides with Business Growth Strategies Line Graph Icon. Ellicudate the three stages and present information using this PPT slide. This is a completely adaptable PowerPoint template design that can be used to interpret topics like Business Growth, Strategies Line Graph. So download instantly and tailor it with your information.
-
 Cost per employee data driven line graph powerpoint templates
Presenting cost per employee data driven line graph powerpoint templates. This is a cost per employee data driven line graph powerpoint templates. This is a six stage process. The stages in this process are graph line, cost, employee, growth, success.
-
 Profit per employee data driven line graph powerpoint slide background image
Presenting profit per employee data driven line graph powerpoint slide background image. This is a profit per employee data driven line graph powerpoint slide background image. This is a six stage process. The stages in this process are profit, employee, graph, line, growth.
-
 Revenue cost per employee comparison line graph powerpoint slide background picture
Presenting revenue cost per employee comparison line graph powerpoint slide background picture. This is a revenue cost per employee comparison line graph powerpoint slide background picture. This is a seven stage process. The stages in this process are company rpe, company ecpe.
-
 Average profit per employee line graph ppt diagrams
Presenting average profit per employee line graph ppt diagrams. This is a average profit per employee line graph ppt diagrams. This is a six stage process. The stages in this process are average profit per employee.
-
 Line graph for market analysis ppt slide
Presenting line graph for market analysis ppt slide. This is a line graph for market analysis ppt slide. This is a seven stage process. The stages in this process are complaint.
-
 Three series line graph for yearly trend comparison ppt background images
Presenting three series line graph for yearly trend comparison ppt background images. This is a three series line graph for yearly trend comparison ppt background images. This is a three stage process. The stages in this process are series.
-
 5 years line graph trend comparison powerpoint presentation
Presenting 5 years line graph trend comparison powerpoint presentation. This is a 5 years line graph trend comparison powerpoint presentation. This is a three stage process. The stages in this process are year, planning, business, marketing, success.
-
 Global market trends line graph powerpoint slide
Presenting global market trends line graph powerpoint slide. This is a global market trends line graph powerpoint slide. This is a two stage process. The stages in this process are africa, middle east, latin america, eastern europe, north america, asia, western europe.
-
 Product revenue comparison line graph ppt template
Presenting product revenue comparison line graph ppt template. This is a product revenue comparison line graph ppt template. This is a two stage process. The stages in this process are revenue, profit, competitor.
-
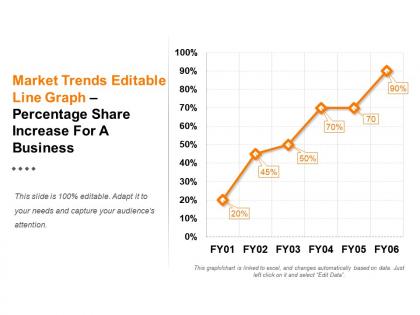 Market trends editable line graph percentage share increase for a business ppt design
Presenting market trends editable line graph percentage share increase for a business ppt design. This is a market trends editable line graph percentage share increase for a business ppt design. This is a six stage process. The stages in this process are business, finance, bar graph, marketing, management.
-
 Trend line graph powerpoint ideas
Presenting trend line graph powerpoint ideas. This is a trend line graph powerpoint ideas. This is a three stage process. The stages in this process are trend line, line graph, scatter chart.
-
 Competitor analysis competitor revenue and profit growth line graph ppt diagrams
Presenting competitor analysis PPT diagram. This PPT template is quite comfortable for business analysis, management students, business managers, and other professionals etc. The various features of this Presentation graphic are revamp able such as the fonts, font sizes, colors, designs, words etc. This PPT graphic can be easily structured into PDF or JPG formats. This is also well versant with Google Slides.
-
 Competitor analysis market share of competitors line graph ppt infographics
Presenting competitor analysis market share of competitors line graph PPT infographics PPT slide. Ease of customization. Replace any words, picture or number provided in the template with your own content and use it for the presentation. You may even incorporate your own company’s name and logo in the presentation for personalization. The visuals used are of high resolution, therefore no issue of image pixelation if projected on a wide screen. Moreover, the presentation is compatible with numerous format and software options. Widely used by every business researcher, analyst, company owner, marketer, consultant, academician, and more.
-
 Performance summary bar graph line ppt icon
Presenting the slide named Performance Summary Bar Graph Line PPT Icon. Customize this easy to use template with font colour, font size and font style of your choice. You can easily arrange the bar categories sequentially for best readability. The text in the template can be rewritten. The colour of the background and bar graph can be changed. You can choose from a wide variety of icons that we offer and can replace them in accordance with your purpose. This template is compatible with Google Slides. You can save this slide in both PDF and JPG formats.
-
 Up down trend line in graph
Presenting Up Down Trend Line In Graph slide. This easy to download PPT theme can be easily opened and saved in various formats like JPG, PDF, and PNG. You can alter the font size, font type, font color, and shape used according to your needs as this PPT layout is 100% customizable. This PowerPoint template is Google Slides compatible and is easily accessible.
-
 Upward trend line in a graph
Presenting Upward Trend Line In A Graph. The PPT is 100% editable in PowerPoint. You can customize the font style, font color, and other components with ease. The PPT is also compatible with Google Slides. Also, convert this template into various documents or image formats such as PDF or JPEG. High-quality graphics ensure that quality is not distorted at any cost.
-
 Evolution icon shown by graph lines and text box
Presenting this set of slides with name - Evolution Icon Shown By Graph Lines And Text Box. This is a six stage process. The stages in this process are Evolution Icon, Heritable Icon, Timeline Icon.
-
 Adopters majority diffusion of innovation graph with line and icons
Presenting this set of slides with name - Adopters Majority Diffusion Of Innovation Graph With Line And Icons. This is a four stage process. The stages in this process are Diffusion Of Innovations, Innovation Management, Ideas.
-
 Brand tracking bar graph increasing line chart pie chart
Presenting this set of slides with name - Brand Tracking Bar Graph Increasing Line Chart Pie Chart. This is a six stage process. The stages in this process are Brand Tracking, Brand Valuation, Brand Analysis.
-
 Data visualization icon four pie chart bar graph upward lines
Presenting this set of slides with name - Data Visualization Icon Four Pie Chart Bar Graph Upward Lines. This is a one stage process. The stages in this process are Data Visualization Icon, Data Management Icon.
-
 Situation analysis graph icon with trend line
Presenting this set of slides with name - Situation Analysis Graph Icon With Trend Line. This is a five stage process. The stages in this process are Situation Analysis Icon, Strategic Management Icon, Marketing Plan Icon.
-
 Sales growth icon line chart graph and upward arrow
Presenting this set of slides with name - sales growth icon line chart graph and upward arrow. This is a one stage process. The stages in this process are Sales Growth Icon, Sales Improvement Icon, Lead Growth Icon.
-
 Culture change frameworks graph having lines and circles
Presenting this set of slides with name - Culture Change Frameworks Graph Having Lines And Circles. This is a four stage process. The stages in this process are Culture Change Frameworks, Culture Change Management, Culture Change Structure.
-
 Product roadmap timeline 2d linear graph growth factors powerpoint templates slides
The graphic and images used in the slide icon are rich in pixels and user-friendly. Designed from the audience perspective. Entirely subject focused. Use graphics, icons and the catchy images rather than monotonous bullet information. Valuable for the business entrepreneurs, business planners, presenters and the marketing individuals.
-
 Product roadmap timeline 2d linear graph demonstrating 2013 to 2016 plans powerpoint templates slides
We are proud to present our product roadmap timeline 2d linear graph demonstrating 2013 to 2016 plans powerpoint templates slides. This Diagram illustrates the yearly plan from year 2013 to 2016 using 2D linear graph. This Diagram portrays the concept of Consistent Growth for 4 years. You can use this Diagram of 5 slides to express the financial growth of Business in mentioned four years. The Business Diagram helps expound on the logic of your detailed thought process to take your company forward. You can change color, size and orientation of any icon to your liking.
-
 Product roadmap timeline 2d linear graph presenting every month business growth powerpoint templates slides
We are proud to present our product roadmap timeline 2d linear graph presenting every month business growth powerpoint templates slides. Use this PowerPoint diagram to graphically represent the growth for upcoming years using this 2d linear graph. Your brain is always churning out ideas like cogs in a wheel. The mind is always whirring with new ideas. Put them down and present them using our innovative Diagram. Activate the minds of your team with your ideas. Illustrate to them how it will take them to the very top.


