Powerpoint Templates and Google slides for Graph business
Save Your Time and attract your audience with our fully editable PPT Templates and Slides.
-
 Twelve staged lego blocks bar graph and business icons powerpoint template slide
We are proud to present our twelve staged lego blocks bar graph and business icons powerpoint template slide. Twelve staged Lego blocks bar graph and business icons has been used to craft this power point template diagram. This PPT diagram contains the concept of business result analysis techniques .Use this PPT diagram for business and marketing related presentations.
-
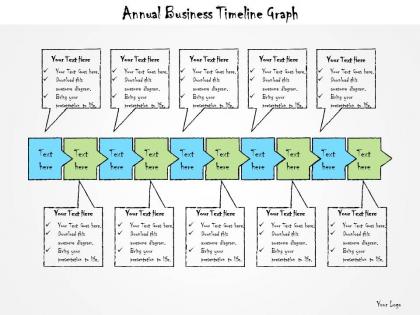 1013 business ppt diagram annual business timeline graph powerpoint template
We are proud to present our 1013 business ppt diagram annual business timeline graph powerpoint template. To display the annual business timeline graph usen this power point template. Use Our Power Point Templates in different annual business timeline process.
-
 Md eleven staged bar graph with icons business analysis powerpoint template slide
Presenting md eleven staged bar graph with icons business analysis powerpoint template slide. Eleven staged bar graph and icons has been used to craft this power point template diagram. This PPT diagram contains the concept of business result analysis. Use this PPT diagram for marketing and business related presentation.
-
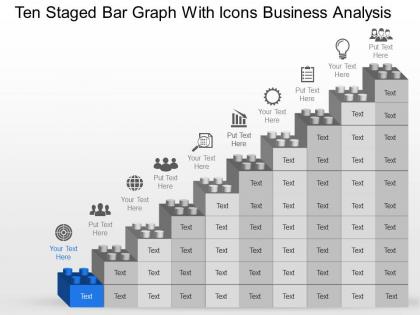 Ng ten staged bar graph with icons business analysis powerpoint template slide
Presenting ng ten staged bar graph with icons business analysis powerpoint template slide. Ten staged bar graph and icons has been used to craft this power point template diagram. This PPT diagram contains the concept of business result analysis. Use this PPT diagram for marketing and business related presentation.
-
 Linear flow straight graph 8 stages inspection business powerpoint templates
We are proud to present our linear flow straight graph 8 stages inspection business powerpoint templates. This Diagram is best suited to streamline the processes for your audience to follow in order to interconnect with each other. Step by step develop the entire picture and project it onto their minds.
-
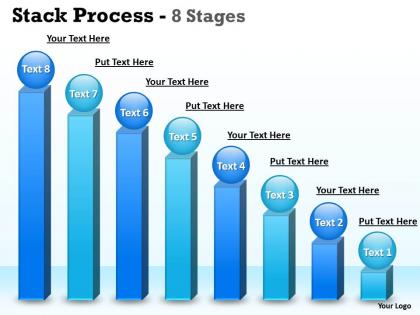 Eight stages stack diagram business bar graph
This template is skillfully designed and is completely editable to suit all the needs and requirements of the user. The color of the font, its size, style, and all other elements can be customized according to the user's desire The text in the PPT placeholder can be replaced with the desired information making this template highly flexible and adaptable as well. This template is also compatible with various Microsoft versions and formats like Google Slides, JPG, PDF, etc so the user will face no issue in saving it in the format of his choice.
-
 Indicators Business Growth Graph Performance Development Arrow Pressure Location Dashboard
This complete deck covers various topics and highlights important concepts. It has PPT slides which cater to your business needs. This complete deck presentation emphasizes Indicators Business Growth Graph Performance Development Arrow Pressure Location Dashboard and has templates with professional background images and relevant content. This deck consists of total of thirteen slides. Our designers have created customizable templates, keeping your convenience in mind. You can edit the colour, text and font size with ease. Not just this, you can also add or delete the content if needed. Get access to this fully editable complete presentation by clicking the download button below.
-
 Mu nine staged bar graph with icons business analysis powerpoint template slide
Presenting mu nine staged bar graph with icons business analysis powerpoint template slide. Nine staged bar graph and icons has been used to craft this power point template diagram. This PPT diagram contains the concept of business progress analysis. Use this PPT diagram for sales and business related presentation.
-
 Improve Icon Analytics Graph Business Increase Performance Growth Evaluation Gears
It has PPT slides covering wide range of topics showcasing all the core areas of your business needs. This complete deck focuses on Improve Icon Analytics Graph Business Increase Performance Growth Evaluation Gears and consists of professionally designed templates with suitable graphics and appropriate content. This deck has total of twleve slides. Our designers have created customizable templates for your convenience. You can make the required changes in the templates like colour, text and font size. Other than this, content can be added or deleted from the slide as per the requirement. Get access to this professionally designed complete deck PPT presentation by clicking the download button below.
-
 Business Economics Business Analysis Investment Production Magnifying Upward Graph
This complete deck can be used to present to your team. It has PPT slides on various topics highlighting all the core areas of your business needs. This complete deck focuses on Business Economics Business Analysis Investment Production Magnifying Upward Graph and has professionally designed templates with suitable visuals and appropriate content. This deck consists of total of twelve slides. All the slides are completely customizable for your convenience. You can change the colour, text and font size of these templates. You can add or delete the content if needed. Get access to this professionally designed complete presentation by clicking the download button below.
-
 Business Person Icon Dollar Arrows Histogram Graph Success Gearwheel Conversation
This complete deck covers various topics and highlights important concepts. It has PPT slides which cater to your business needs. This complete deck presentation emphasizes Business Person Icon Dollar Arrows Histogram Graph Success Gearwheel Conversation and has templates with professional background images and relevant content. This deck consists of total of twelve slides. Our designers have created customizable templates, keeping your convenience in mind. You can edit the colour, text and font size with ease. Not just this, you can also add or delete the content if needed. Get access to this fully editable complete presentation by clicking the download button below.
-
 Up Graph Business Performance Arrow Profitability Enhancement
If you require a professional template with great design, then this Up Graph Business Performance Arrow Profitability Enhancement is an ideal fit for you. Deploy it to enthrall your audience and increase your presentation threshold with the right graphics, images, and structure. Portray your ideas and vision using twelve slides included in this complete deck. This template is suitable for expert discussion meetings presenting your views on the topic. With a variety of slides having the same thematic representation, this template can be regarded as a complete package. It employs some of the best design practices, so everything is well-structured. Not only this, it responds to all your needs and requirements by quickly adapting itself to the changes you make. This PPT slideshow is available for immediate download in PNG, JPG, and PDF formats, further enhancing its usability. Grab it by clicking the download button.
-
 Cp eight staged business pie graph and icons powerpoint template
Presenting cp eight staged business pie graph and icons powerpoint template. Eight staged business pie graph and icons has been used to craft this power point template diagram. This PPT diagram contains the concept of result analysis and marketing strategy. Use this PPT diagram for business and marketing related presentations.
-
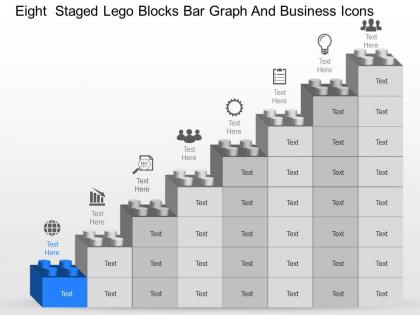 Eight staged lego blocks bar graph and business icons powerpoint template slide
We are proud to present our eight staged lego blocks bar graph and business icons powerpoint template slide. Eight staged Lego blocks and bar graph diagram has been used to craft this power point template diagram. This PPT diagram contains the concept of business result analysis. Use this PPT diagram for business and marketing related presentations.
-
 Seven staged pie graph for business application flat powerpoint design
We are proud to present our seven staged pie graph for business application flat powerpoint design. Seven staged pie graph has been used to craft this power point template diagram. This PPT diagram contains the concept of business application. Use this PPT diagram for business and marketing related presentations.
-
 Year Over Year Growth Business Graph Revenue Operation Organization Strategy Location Comparison
This complete presentation has PPT slides on wide range of topics highlighting the core areas of your business needs. It has professionally designed templates with relevant visuals and subject driven content. This presentation deck has total of eleven slides. Get access to the customizable templates. Our designers have created editable templates for your convenience. You can edit the colour, text and font size as per your need. You can add or delete the content if required. You are just a click to away to have this ready-made presentation. Click the download button now.
-
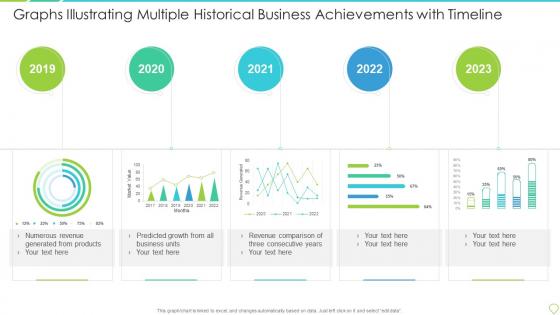 Graphs illustrating multiple historical business achievements with timeline
Introducing our Graphs Illustrating Multiple Historical Business Achievements With Timeline set of slides. The topics discussed in these slides are Revenue, Growth, Business. This is an immediately available PowerPoint presentation that can be conveniently customized. Download it and convince your audience.
-
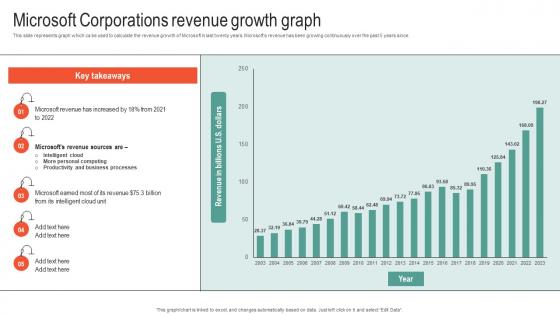 Microsoft Corporations Revenue Growth Graph Microsoft Business Strategy To Stay Ahead Strategy SS V
This slide represents graph which ca be used to calculate the revenue growth of Microsoft in last twenty years. Microsofts revenue has been growing continuously over the past 5 years since. Present the topic in a bit more detail with this Microsoft Corporations Revenue Growth Graph Microsoft Business Strategy To Stay Ahead Strategy SS V. Use it as a tool for discussion and navigation on Corporations, Revenue, Growth. This template is free to edit as deemed fit for your organization. Therefore download it now.
-
 Cost Efficiency Strategies For Reducing Graph Indicating Increase In Overall Business Costs
The slide highlights the lack of cost efficiency in the company that leads to increase in overall business expenses. It includes comparison of previous year costs to evaluate the rise in total business expenditure. Present the topic in a bit more detail with this Cost Efficiency Strategies For Reducing Graph Indicating Increase In Overall Business Costs. Use it as a tool for discussion and navigation on Business Costs. This template is free to edit as deemed fit for your organization. Therefore download it now.
-
 Graph Indicating Increase In Overall Business Costs Cost Reduction Techniques
The slide highlights the lack of cost efficiency in the company that leads to increase in overall business expenses. It includes comparison of previous year costs to evaluate the rise in total business expenditure. Present the topic in a bit more detail with this Graph Indicating Increase In Overall Business Costs Cost Reduction Techniques. Use it as a tool for discussion and navigation on According, Previous. This template is free to edit as deemed fit for your organization. Therefore download it now.
-
 Statistical Graph Highlighting Business Performance Product Bundling Strategies To Enhance
Mentioned slide displays company revenue and net profit over the years to determine and analyse current business situations. Present the topic in a bit more detail with this Statistical Graph Highlighting Business Performance Product Bundling Strategies To Enhance. Use it as a tool for discussion and navigation on Statistical Graph Highlighting, Business Performance, Current Business Situations. This template is free to edit as deemed fit for your organization. Therefore download it now.
-
 Quarterly Employee Business Sales Performance Graph
This slide shows graph that can be used by organizations to highlight monthly sales performance of company. It includes sales made by different employee through out the quarter. Presenting our well structured Quarterly Employee Business Sales Performance Graph. The topics discussed in this slide are Key Insights, Highest Sales, New Regions. This is an instantly available PowerPoint presentation that can be edited conveniently. Download it right away and captivate your audience.
-
 Quality KPI Comparison Graph For Construction Business
This slide graphically compares quality KPIs for various construction businesses including KPIs such as safety incident rate, resource utilization rate, etc. Introducing our Quality KPI Comparison Graph For Construction Business set of slides. The topics discussed in these slides are Construction Quality, Construction BusinessThis is an immediately available PowerPoint presentation that can be conveniently customized. Download it and convince your audience.
-
 Business powerpoint templates linear flow process graph sales ppt slides 5 stages
With these pre-designed process arrows you can visualize almost any type of concept, chronological process or steps of your strategies. Use these upright arrows to make your presentation more attractive. The structure of our Diagrams allows you to effectively highlight the key issues concerning the growth of your business.
-
 Series A Investor Funding Elevator Business Model Ppt Diagram Graph Charts
This slide covers defining company unique business model covering value propositions, partners, activities, resources, channels and revenue streams. The purpose of this template is to provide an overview on revenue generating business activities along with resources such as tech platform, network of active sellers and buyers, etc. Deliver an outstanding presentation on the topic using this Series A Investor Funding Elevator Business Model Ppt Diagram Graph Charts. Dispense information and present a thorough explanation of Value Proposition, Customer Relationships, Customer Segments, Tech Platform using the slides given. This template can be altered and personalized to fit your needs. It is also available for immediate download. So grab it now.
-
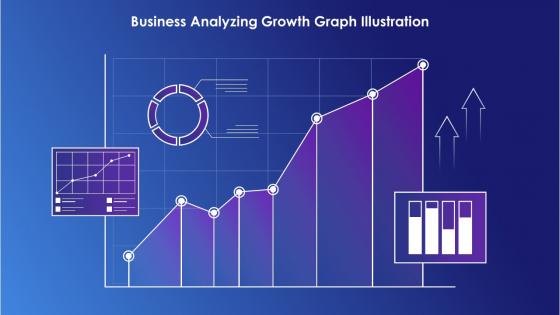 Business Analyzing Growth Graph Illustration
This vibrant coloured icon depicts a business analyzing growth graph to show the progress of a company. It is perfect for use in presentations, reports, and documents to illustrate the success of a business.
-
 Agenda For Spa Business Plan Ppt Diagram Graph Charts BP SS
Introducing Agenda For Spa Business Plan Ppt Diagram Graph Charts BP SS to increase your presentation threshold. Encompassed with six stages, this template is a great option to educate and entice your audience. Dispence information on Establish Spa Start Up Business, Prepare Marketing, Financial Plan, using this template. Grab it now to reap its full benefits.
-
 Real Estate Start Up Business Plan Market Gap Ppt Diagram Graph Charts BP SS
This slide highlights major challenges in the real estate sector. It includes market volatility, outdated operational models, financial barriers, and problems related to the supply of housing units. Increase audience engagement and knowledge by dispensing information using Real Estate Start Up Business Plan Market Gap Ppt Diagram Graph Charts BP SS. This template helps you present information on five stages. You can also present information on Market Volatility, Financial Barriers, Outdated Operational Technology using this PPT design. This layout is completely editable so personaize it now to meet your audiences expectations.
-
 Solution Business Model Of Dropbox Ppt Diagram Graph Charts BMC SS
This slide showcases company solutions to industry challenges such as multiple file-sharing capabilities, automated synchronization, remote access, and improved security measures. Introducing Solution Business Model Of Dropbox Ppt Diagram Graph Charts BMC SS to increase your presentation threshold. Encompassed with four stages, this template is a great option to educate and entice your audience. Dispence information on Industry Challenges, File Sharing Capabilities, Automated Synchronization, Data Protection, using this template. Grab it now to reap its full benefits.
-
 Solution Pfizer Business Model Ppt Diagram Graph Charts BMC SS
This slide provides the solutions offered by the company to address issues. It includes building relationships with customers, digital transformation, etc. Increase audience engagement and knowledge by dispensing information using Solution Pfizer Business Model Ppt Diagram Graph Charts BMC SS. This template helps you present information on five stages. You can also present information on Digital Transformation In Antibiotics, Globally Contributing To Growth, Search Engine Optimization using this PPT design. This layout is completely editable so personaize it now to meet your audiences expectations.
-
 Cost Structure Business Model Of Nio Ppt Diagram Graph Charts BMC SS
This slide showcases the distribution of expenses across key categories including research and development, production, sales and marketing, and administrative costs. Introducing Cost Structure Business Model Of Nio Ppt Diagram Graph Charts BMC SS to increase your presentation threshold. Encompassed with three stages, this template is a great option to educate and entice your audience. Dispence information on Research And Development, Sales And Marketing, Administrative Costs, Cost Structure, using this template. Grab it now to reap its full benefits.
-
 Cost Structure Business Model Of Spotify Ppt Diagram Graph Charts BMC SS
This slide showcases the distribution of expenses across key categories including royalties, company operations, infrastructure, and research and development. Increase audience engagement and knowledge by dispensing information using Cost Structure Business Model Of Spotify Ppt Diagram Graph Charts BMC SS. This template helps you present information on four stages. You can also present information on Cost Structure, Research And Development, Company Operations, Technology Development using this PPT design. This layout is completely editable so personaize it now to meet your audiences expectations.
-
 Icons Slide For Gojek Business Model Ppt Diagram Graph Charts BMC SS
Introducing our well researched set of slides titled Icons Slide For Gojek Business Model Ppt Diagram Graph Charts BMC SS. It displays a hundred percent editable icons. You can use these icons in your presentation to captivate your audiences attention. Download now and use it multiple times.
-
 Business Model Of HP Business Model Canvas Ppt Diagram Graph Charts BMC SS
This slide provides the business model canvas of the company in order to understand its overall business functioning. It involves key partners, key activities, USP, customer relationships, customer segments, channels, revenue streams, channels, key resources, cost structure. Present the topic in a bit more detail with this Business Model Of HP Business Model Canvas Ppt Diagram Graph Charts BMC SS. Use it as a tool for discussion and navigation on Customer Relationships, Customer Segments, Cost Structure, Revenue Streams. This template is free to edit as deemed fit for your organization. Therefore download it now.
-
 Business Model Of Pinterest Cost Structure Ppt Diagram Graph Charts BMC SS
This slide showcases all the expenses and costs that company incur to operate it business successfully. It includes cost such as salaries, platform maintenance, and research and development. Introducing Business Model Of Pinterest Cost Structure Ppt Diagram Graph Charts BMC SS to increase your presentation threshold. Encompassed with five stages, this template is a great option to educate and entice your audience. Dispence information on Platform Maintenance, Research And Development, Sales And Marketing, Content Protection, using this template. Grab it now to reap its full benefits.
-
 Alibaba Business Model Problem Ppt Diagram Graph Charts BMC SS
This slide showcases the major problems addressed by company. It includes absence of unified global marketplace, insufficient cloud computing, and challenges of international trade payments. Introducing Alibaba Business Model Problem Ppt Diagram Graph Charts BMC SS to increase your presentation threshold. Encompassed with three stages, this template is a great option to educate and entice your audience. Dispence information on Unified Global Marketplace, Insufficient Cloud Computing, International Trade Payments, using this template. Grab it now to reap its full benefits.
-
 Cost Structure Tesla Business Model Ppt Diagram Graph Charts BMC SS
This slide showcases all the expenses and costs a company incurs to operate its business successfully. It includes costs such as research and development, manufacturing costs, etc. Introducing Cost Structure Tesla Business Model Ppt Diagram Graph Charts BMC SS to increase your presentation threshold. Encompassed with three stages, this template is a great option to educate and entice your audience. Dispence information on Research And Development Costs, Manufacturing Costs, Marketing And Advertising Expenses, using this template. Grab it now to reap its full benefits.
-
 Financial Business Planning Icon With Graph And Checklist
Introducing our premium set of slides with Financial Business Planning Icon With Graph And Checklist. Ellicudate the three stages and present information using this PPT slide. This is a completely adaptable PowerPoint template design that can be used to interpret topics like Financial Business Planning, Icon, Graph And Checklist. So download instantly and tailor it with your information.
-
 Business Price Segmentation Graph Icon
Introducing our Business Price Segmentation Graph Icon set of slides. The topics discussed in these slides are Business, Segmentation. This is an immediately available PowerPoint presentation that can be conveniently customized. Download it and convince your audience.
-
 Na six staged arrow bar graph business deal idea generation powerpoint template slide
Presenting na six staged arrow bar graph business deal idea generation powerpoint template slide. Six staged arrow, bar graph and icons has been used to craft this power point template diagram. This PPT diagram contains the concept of business deal and idea generation. Use this PPT diagram for marketing and business related presentation.
-
 Business puzzle graph powerpoint templates 0812
This template is skillfully designed and is completely editable to suit all the needs and requirements of the user. The color of the font, its size, style, and all other elements can be customized according to the user's desire The text in the PPT placeholder can be replaced with the desired information making this template highly flexible and adaptable as well. This template is also compatible with various Microsoft versions and formats like Google Slides, JPG, PDF, etc so the user will face no issue in saving it in the format of his choice.
-
 Mobile App Illustrating Technology Business Graph Forecast
This complete deck can be used to present to your team. It has PPT slides on various topics highlighting all the core areas of your business needs. This complete deck focuses on Mobile App Illustrating Technology Business Graph Forecast and has professionally designed templates with suitable visuals and appropriate content. This deck consists of total of nine slides. All the slides are completely customizable for your convenience. You can change the colour, text and font size of these templates. You can add or delete the content if needed. Get access to this professionally designed complete presentation by clicking the download button below.
-
 Ve colored bar graph for business result analysis powerpoint template
We are proud to present our ve colored bar graph for business result analysis powerpoint template. Graphic of colored bar graph has been used to design this power point template diagram. This PPT diagram contains the concept of business result analysis representation This PPT diagram can be used for business and marketing related presentations.
-
 Business network diagram examples graph moving upwards success 3 stages powerpoint slides
We are proud to present our business network diagram examples graph moving upwards success 3 stages powerpoint slides. Bar with three stages to show different business network, this template is decorated with colorful bars to represent growth cycle and other topics.
-
 Business puzzle graph powerpoint templates ppt presentation slides 0812
This PowerPoint slide shows 3 puzzles diagram. There is a lot of space available for writing your text. You can easily edit the size, position, text, color.
-
 0314 business ppt diagram three staged circular graph powerpoint template
We are proud to present our 0314 business ppt diagram three staged circular graph powerpoint template. To display business concept use this three step interrelated diagram is can be used in any business presentation. This professional diagram is useful for business related presentation.
-
 Effort Estimate Budgeting Upward Graph Business Project Development Flow Chart
This complete deck can be used to present to your team. It has PPT slides on various topics highlighting all the core areas of your business needs. This complete deck focuses on Effort Estimate Budgeting Upward Graph Business Project Development Flow Chart and has professionally designed templates with suitable visuals and appropriate content. This deck consists of total of eight slides. All the slides are completely customizable for your convenience. You can change the colour, text and font size of these templates. You can add or delete the content if needed. Get access to this professionally designed complete presentation by clicking the download button below.
-
 Md bar graph on mobile screen for business growth analysis powerpoint temptate
Presenting md bar graph on mobile screen for business growth analysis powerpoint temptate. This Power Point template diagram has been crafted with graphic of mobile screen and bar graph diagram. This PPT diagram contains the concept of business growth analysis representation. Use this PPT diagram for business and marketing related presentations.
-
 Company sales graph business management ppt icon model
Present the topic in a bit more detail with this Company Sales Graph Business Management Ppt Icon Model. Use it as a tool for discussion and navigation on Company Sales Graph. This template is free to edit as deemed fit for your organization. Therefore download it now.
-
 Startup Business Financial Planning And Projections Graph
This slide shows the financial planning for a startup company along with future projections for the upcoming financial years. It includes graphs showing increase in revenue, net income, free cash flow and cash balance in the upcoming years. Introducing our Startup Business Financial Planning And Projections Graph set of slides. The topics discussed in these slides are Revenue, Net Income, Free Cash Flow, Cash Balance. This is an immediately available PowerPoint presentation that can be conveniently customized. Download it and convince your audience.
-
 Business Revenue Bar Graph With OPEX Details
This slide represents business revenue bar graph with OPEX details which can be referred by companies to earn more revenue by controlling expenditures. It also provides information about marketing and sales, research and development, administration, total revenue, etc. Presenting our well-structured Business Revenue Bar Graph With OPEX Details. The topics discussed in this slide are Business Revenue, Bar Graph, OPEX Details. This is an instantly available PowerPoint presentation that can be edited conveniently. Download it right away and captivate your audience.
-
 E Commerce Business Sales Monthly Forecast Graph
This slide shows the table and graph representing monthly sales forecast of an e commerce business. It shows details related to the expected growth rate, historical data, projected data and actual growth of sales. Introducing our E Commerce Business Sales Monthly Forecast Graph set of slides. The topics discussed in these slides are E Commerce, Business Sales, Forecast Graph. This is an immediately available PowerPoint presentation that can be conveniently customized. Download it and convince your audience.
-
 Business Marketing Expense Assessment Graph
The following slide depicts the comparative analysis of marketing budget allocation for current and previous year to assess variance. It includes promotional activities such as advertising, paid media, agency fee, publicity etc. Introducing our Business Marketing Expense Assessment Graph set of slides. The topics discussed in these slides are Total Budget , Budget Allocated, Key Insights. This is an immediately available PowerPoint presentation that can be conveniently customized. Download it and convince your audience.
-
 Column Graph Business Transformation Management Plan Ppt Powerpoint Presentation File Files
Present the topic in a bit more detail with this Column Graph Business Transformation Management Plan Ppt Powerpoint Presentation File Files. Use it as a tool for discussion and navigation on Column Graph. This template is free to edit as deemed fit for your organization. Therefore download it now.
-
 Business Development Training Employee Productivity And Efficiency Graph For Last 5 Years
The following slide showcases he employees productivity and efficiency graph for last years which shows that employees productivity has declined during this time period because of lack of training programs and high attrition rate. Present the topic in a bit more detail with this Business Development Training Employee Productivity And Efficiency Graph For Last 5 Years. Use it as a tool for discussion and navigation on Productivity, Efficiency Graph, Development Program. This template is free to edit as deemed fit for your organization. Therefore download it now.
-
 Graph Indicating Increase In Overall Business Costs Key Strategies For Improving Cost Efficiency
The slide highlights the lack of cost efficiency in the company that leads to increase in overall business expenses. It includes comparison of previous year costs to evaluate the rise in total business expenditure. Present the topic in a bit more detail with this Graph Indicating Increase In Overall Business Costs Key Strategies For Improving Cost Efficiency. Use it as a tool for discussion and navigation on Graph Indicating Increase, Overall Business Costs This template is free to edit as deemed fit for your organization. Therefore download it now.
-
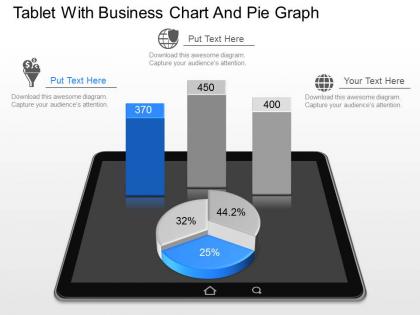 Gp tablet with business chart and pie graph powerpoint template
Presenting gp tablet with business chart and pie graph powerpoint template. This Power Point template diagram has been crafted with graphic of tablet, pie graph and business chart. This PPT diagram contains the concept of business problem analysis and agile management representation. Use this PPT diagram for business and marketing related presentations.
-
 Gr three level bar graph business analysis powerpoint template
Presenting gr three level bar graph business analysis powerpoint template. This Power Point template diagram has been crafted with graphic of three level bar graph diagram. This PPT diagram contains the concept of business data and result analysis. Use this PPT diagram for business and marketing related presentations.
-
 Ecosystem of business image with home people globe graph briefcase image
Presenting this set of slides with name - Ecosystem Of Business Image With Home People Globe Graph Briefcase Image. This is a one stage process. The stages in this process are Environment, Ecosystem, Community.
-
 Business kpi showing employee analysing the graph of companys performance indicator
Presenting this set of slides with name - Business Kpi Showing Employee Analysing The Graph Of Companys Performance Indicator. This is a four stage process. The stages in this process are Business Kpi, Business Dashboard, Business Metrics.


