Powerpoint Templates and Google slides for Graph Analytics
Save Your Time and attract your audience with our fully editable PPT Templates and Slides.
-
 Improve Icon Analytics Graph Business Increase Performance Growth Evaluation Gears
It has PPT slides covering wide range of topics showcasing all the core areas of your business needs. This complete deck focuses on Improve Icon Analytics Graph Business Increase Performance Growth Evaluation Gears and consists of professionally designed templates with suitable graphics and appropriate content. This deck has total of twleve slides. Our designers have created customizable templates for your convenience. You can make the required changes in the templates like colour, text and font size. Other than this, content can be added or deleted from the slide as per the requirement. Get access to this professionally designed complete deck PPT presentation by clicking the download button below.
-
 Graph Illustrating Big Data Analytics Tools In E Commerce
This slide showcases the statistical graph highlighting big data analytics in e-commerce which helps an organization to understand best and most used tool by businesses. It include details such as records customers entire journey, provides in-depth understanding of markets behavior, etc. Introducing our Graph Illustrating Big Data Analytics Tools In E Commerce set of slides. The topics discussed in these slides are E-Commerce Businesses, Key Insights, Key Reasons. This is an immediately available PowerPoint presentation that can be conveniently customized. Download it and convince your audience.
-
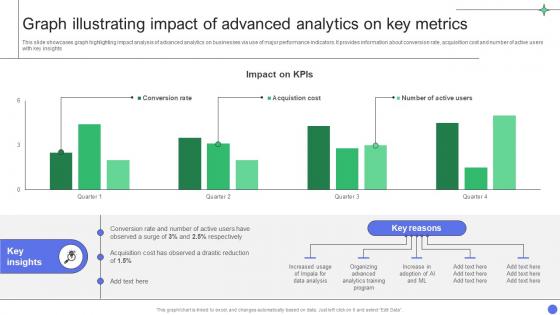 A Comprehensive Guide Graph Illustrating Impact Of Advanced Analytics On Key Metrics Data Analytics SS
This slide showcases graph highlighting impact analysis of advanced analytics on businesses via use of major performance indicators. It provides information about conversion rate, acquisition cost and number of active users with key insights Deliver an outstanding presentation on the topic using this A Comprehensive Guide Graph Illustrating Impact Of Advanced Analytics On Key Metrics Data Analytics SS Dispense information and present a thorough explanation of Drastic Reduction, Analytics Training Program, Data Analysis using the slides given. This template can be altered and personalized to fit your needs. It is also available for immediate download. So grab it now.
-
 Graph Illustrating Impact Of Prescriptive Unlocking The Power Of Prescriptive Data Analytics SS
This slide showcases graph highlighting impact analysis of prescriptive analytics on businesses via use of major performance indicators. It provides information total revenue, inventory levels and labour costs with key insights. Deliver an outstanding presentation on the topic using this Graph Illustrating Impact Of Prescriptive Unlocking The Power Of Prescriptive Data Analytics SS. Dispense information and present a thorough explanation of Labour Costs, Revenue And Inventory Levels, Training Program And Workshops using the slides given. This template can be altered and personalized to fit your needs. It is also available for immediate download. So grab it now.
-
 Customer Retention Graph For Improved Navigating The Future Of Insurance Data Analytics SS
This slide outlines a graph highlighting trends in user retention of an ecommerce business. It covers details on lost customers, new users gained and net retention rate along with key insights. Present the topic in a bit more detail with this Customer Retention Graph For Improved Navigating The Future Of Insurance Data Analytics SS. Use it as a tool for discussion and navigation on Monthly Net Retention, Insurance Business, Excellent Customer Service. This template is free to edit as deemed fit for your organization. Therefore download it now.
-
 Advanced Analytics Ppt Powerpoint Presentation Diagram Graph Charts
Presenting our set of slides with Advanced Analytics Ppt Powerpoint Presentation Diagram Graph Charts. This exhibits information on one stage of the process. This is an easy to edit and innovatively designed PowerPoint template. So download immediately and highlight information on Advanced Analytics.
-
 Visual Line Graph Analytics Icon
Presenting our set of slides with Visual Line Graph Analytics Icon. This exhibits information on three stages of the process. This is an easy to edit and innovatively designed PowerPoint template. So download immediately and highlight information on Visual Line Graph, Analytics Icon.
-
 Company Financial Data Growth Analytics Graph
Presenting our set of slides with Company Financial Data Growth Analytics Graph. This exhibits information on three stages of the process. This is an easy to edit and innovatively designed PowerPoint template. So download immediately and highlight information on Company Financial, Data Growth, Analytics Graph.
-
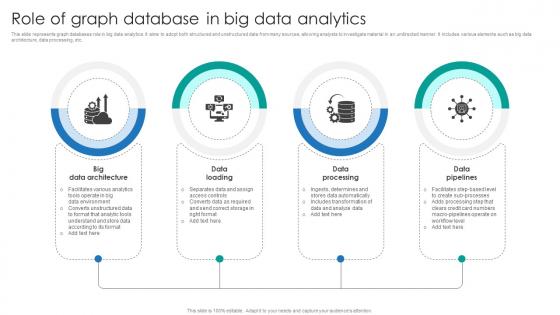 Role Of Graph Database In Big Data Analytics
This slide represents graph databases role in big data analytics. It aims to adopt both structured and unstructured data from many sources, allowing analysts to investigate material in an undirected manner. It includes various elements such as big data architecture, data processing, etc. Presenting our set of slides with Role Of Graph Database In Big Data Analytics. This exhibits information on four stages of the process. This is an easy to edit and innovatively designed PowerPoint template. So download immediately and highlight information on Big Data Architecture, Data Loading, Data Processing.
-
 Augmented Analytics Graph Icon Using AI
Presenting our set of slides with Augmented Analytics Graph Icon Using Ai This exhibits information on Three stages of the process. This is an easy to edit and innovatively designed PowerPoint template. So download immediately and highlight information on Augmented Analytics Graph Icon Using Ai
-
 Portfolio risk and performance analytics graph ppt design
Presenting portfolio risk and performance analytics graph ppt design. This is a portfolio risk and performance analytics graph ppt design. This is a eight stage process. The stages in this process are mandate inputs, investment selection, investment selection, fund and security selection, strategic asset allocation, tactical asset allocation, portfolio review, portfolio construction.
-
 Portfolio risk and performance analytics graph ppt sample file
Presenting portfolio risk and performance analytics graph ppt sample file. This is a portfolio risk and performance analytics graph ppt sample file. This is a six stage process. The stages in this process are monitoring and rebalancing, investment selection, mandate inputs, portfolio review, strategic asset allocation, fund and security selection, essentials of portfolio.
-
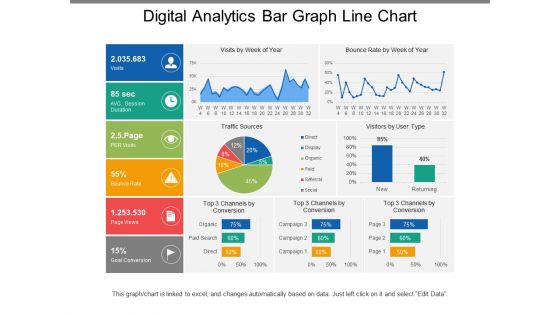 Digital analytics bar graph line chart
Presenting this set of slides with name - Digital Analytics Bar Graph Line Chart. This is a five stage process. The stages in this process are Digital Analytics, Digital Dashboard, Digital Kpis.
-
 Statistics icon of data analytics using bar graph
Presenting our set of slides with Statistics Icon Of Data Analytics Using Bar Graph. This exhibits information on four stages of the process. This is an easy-to-edit and innovatively designed PowerPoint template. So download immediately and highlight information on Statistics Icon Of Data Analytics Using Bar Graph.
-
 SLA Dashboard With Graph And Analytics Icon
Introducing our SLA Dashboard With Graph And Analytics Icon set of slides. The topics discussed in these slides are SLA Dashboard, Graph And Analytics. This is an immediately available PowerPoint presentation that can be conveniently customized. Download it and convince your audience.
-
 Predictive Analytics Graph Colored Icon In Powerpoint Pptx Png And Editable Eps Format
Give your next presentation a sophisticated, yet modern look with this 100 percent editable Predictive analytics graph colored icon in powerpoint pptx png and editable eps format. Choose from a variety of customizable formats such as PPTx, png, eps. You can use these icons for your presentations, banners, templates, One-pagers that suit your business needs.
-
 Predictive Analytics Graph Monotone Icon In Powerpoint Pptx Png And Editable Eps Format
Make your presentation profoundly eye-catching leveraging our easily customizable Predictive analytics graph monotone icon in powerpoint pptx png and editable eps format. It is designed to draw the attention of your audience. Available in all editable formats, including PPTx, png, and eps, you can tweak it to deliver your message with ease.
-
 Sales Data Bar Graph And Analytics Icon
Presenting our set of slides with Sales Data Bar Graph And Analytics Icon. This exhibits information on three stages of the process. This is an easy to edit and innovatively designed PowerPoint template. So download immediately and highlight information on Sales Data Bar Graph, Analytics Icon.
-
 Data Analytics Graph Colored Icon In Powerpoint Pptx Png And Editable Eps Format
Give your next presentation a sophisticated, yet modern look with this 100 percent editable Data analytics graph colored icon in powerpoint pptx png and editable eps format. Choose from a variety of customizable formats such as PPTx, png, eps. You can use these icons for your presentations, banners, templates, One-pagers that suit your business needs.
-
 Data Analytics Graph Monotone Icon In Powerpoint Pptx Png And Editable Eps Format
Make your presentation profoundly eye-catching leveraging our easily customizable Data analytics graph monotone icon in powerpoint pptx png and editable eps format. It is designed to draw the attention of your audience. Available in all editable formats, including PPTx, png, and eps, you can tweak it to deliver your message with ease.
-
 Action Plan For Implementing BI Budget For SAP Analytics Cloud Training Ppt Diagram Graph Charts
The slide indicates the budget plan for SAP Analytics Cloud training for the organization employees. It also contains information regarding quantity, unit cost and amount allocated for multiple training components that includes instructor fees, course acquisition and printing. Present the topic in a bit more detail with this Action Plan For Implementing BI Budget For SAP Analytics Cloud Training Ppt Diagram Graph Charts. Use it as a tool for discussion and navigation on Courseware Acquisition, Courseware Printing, Analytics Cloud Certification Cost. This template is free to edit as deemed fit for your organization. Therefore download it now.
-
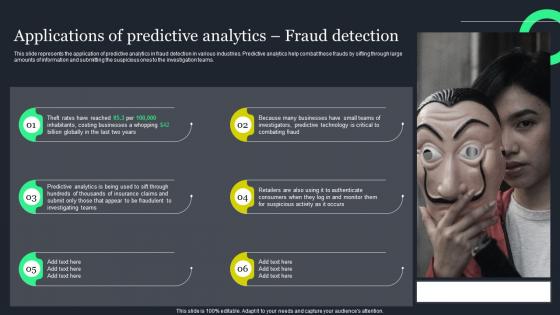 Applications Of Predictive Analytics Fraud Ppt Powerpoint Presentation Diagram Graph Charts
This slide represents the application of predictive analytics in fraud detection in various industries. Predictive analytics help combat these frauds by sifting through large amounts of information and submitting the suspicious ones to the investigation teams. Increase audience engagement and knowledge by dispensing information using Applications Of Predictive Analytics Fraud Ppt Powerpoint Presentation Diagram Graph Charts. This template helps you present information on six stages. You can also present information on Businesses, Investigators, Technology using this PPT design. This layout is completely editable so personaize it now to meet your audiences expectations.
-
 Data analytics process icon showing laptop with graph symbol
Presenting this set of slides with name - Data Analytics Process Icon Showing Laptop With Graph Symbol. This is a three stage process. The stages in this process are Data Analytics Process, Data Analysis Cycle, Data Visualization Process.
-
 Data analytics process icon showing magnifying glass with graphs
Presenting this set of slides with name - Data Analytics Process Icon Showing Magnifying Glass With Graphs. This is a two stage process. The stages in this process are Data Analytics Process, Data Analysis Cycle, Data Visualization Process.
-
 Business challenges and solutions showing by bulls eye and analytic graph
Presenting this set of slides with name - Business Challenges And Solutions Showing By Bulls Eye And Analytic Graph. This is a two stage process. The stages in this process are Challenges And Solutions, Issues And Solutions, Problem And Solution.
-
 Mobile analytics having bar graph and arrow upward
Presenting this set of slides with name - Mobile Analytics Having Bar Graph And Arrow Upward. This is a four stage process. The stages in this process are Mobile Analytics, Mobile Tracking, Mobile Web Analytics.
-
 Mobile analytics icon having bar graph
Presenting this set of slides with name - Mobile Analytics Icon Having Bar Graph. This is a one stage process. The stages in this process are Mobile Analytics, Mobile Tracking, Mobile Web Analytics.
-
 Mobile analytics icon having bar graph and arrow upward
Presenting this set of slides with name - Mobile Analytics Icon Having Bar Graph And Arrow Upward. This is a three stage process. The stages in this process are Mobile Analytics, Mobile Tracking, Mobile Web Analytics.
-
 Mobile analytics icon having bar graph and dollar
Presenting this set of slides with name - Mobile Analytics Icon Having Bar Graph And Dollar. This is a four stage process. The stages in this process are Mobile Analytics, Mobile Tracking, Mobile Web Analytics.
-
 Mobile analytics icon showing pie chart bar graph data analytics
Presenting this set of slides with name - Mobile Analytics Icon Showing Pie Chart Bar Graph Data Analytics. This is a one stage process. The stages in this process are Mobile Analytics, Mobile Tracking, Mobile Web Analytics.
-
 Mobile analytics showing target globe and bar graph
Presenting this set of slides with name - Mobile Analytics Showing Target Globe And Bar Graph. This is a seven stage process. The stages in this process are Mobile Analytics, Mobile Tracking, Mobile Web Analytics.
-
 Analysis with bar graph pie chart key factors highlighting business analytics
Presenting analysis with bar graph pie chart key factors highlighting business analytics. This is a analysis with bar graph pie chart key factors highlighting business analytics. This is a two stage process. The stages in this process are analysis, audit, investigation.
-
 Analysis with magnifying glass bar graph chart highlighting business analytics
Presenting analysis with magnifying glass bar graph chart highlighting business analytics. This is a analysis with magnifying glass bar graph chart highlighting business analytics. This is a three stage process. The stages in this process are analysis, audit, investigation.
-
 Data analytic bar graph magnifying glass
Presenting data analytic bar graph magnifying glass. This is a data analytic bar graph magnifying glass. This is a four stage process. The stages in this process are data analytics icons, information analytics icons, content analytics icons.
-
 Data analytic icon bar graph
Presenting Data Analytic Icon Bar Graph template. The slide is compatible with Google Slides which makes it accessible at once. The slide is completely editable. It can be saved in various document formats such as JPEG, PNG, or PDF. Moreover, both standard screen(4:3) and widescreen(16:9) aspect ratios are supported. High-quality graphics ensure that distortion does not occur.
-
 Data analytic icon computer screen bar graph
Presenting data analytic icon computer screen bar graph. This is a data analytic icon computer screen bar graph. This is a one stage process. The stages in this process are data analytics icons, information analytics icons, content analytics icons.
-
 Data analytic icon improved bar graph
Presenting data analytic icon improved bar graph. This is a data analytic icon improved bar graph. This is a three stage process. The stages in this process are data analytics icons, information analytics icons, content analytics icons.
-
 Data analytic magnifying glass bar graph
Presenting data analytic magnifying glass bar graph. This is a data analytic magnifying glass bar graph. This is a one stage process. The stages in this process are data analytics icons, information analytics icons, content analytics icons.
-
 Data analytic magnifying glass pie chart bar graph
Presenting data analytic magnifying glass pie chart bar graph. This is a data analytic magnifying glass pie chart bar graph. This is a four stage process. The stages in this process are data analytics icons, information analytics icons, content analytics icons.
-
 Data analytic screen growth improvement bar graph
Presenting data analytic screen growth improvement bar graph. This is a data analytic screen growth improvement bar graph. This is a two stage process. The stages in this process are data analytics icons, information analytics icons, content analytics icons.
-
 Market analytics icon with magnifying glass and bar graph
Presenting this set of slides with name - Market Analytics Icon With Magnifying Glass And Bar Graph. This is a four stage process. The stages in this process are Marketing Analytics, Marketing Performance, Marketing Discovery.
-
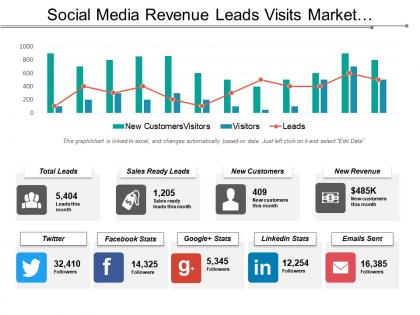 Social media revenue leads visits market analytics table with graph
Presenting this set of slides with name - Social Media Revenue Leads Visits Market Analytics Table With Graph. This is a three stage process. The stages in this process are Marketing Analytics, Marketing Performance, Marketing Discovery.
-
 Bar chart and dot graph analytics icon
Presenting this set of slides with name - Bar Chart And Dot Graph Analytics Icon. This is a three stage process. The stages in this process are Bar Chart Icon, Bar Graph Icon, Data Chart Icon.
-
 Competitive positioning web graph for analytics company
Presenting this set of slides with name Competitive Positioning Web Graph For Analytics Company. The topics discussed in these slides are Competitive, Positioning, Web Graph, Analytics Company. This is a completely editable PowerPoint presentation and is available for immediate download. Download now and impress your audience.
-
 Mobile analytics icon illustrating magnify glass and bar graph
Presenting this set of slides with name Mobile Analytics Icon Illustrating Magnify Glass And Bar Graph. This is a three stage process. The stages in this process are Mobile Analytics Icon Illustrating Magnify Glass And Bar Graph. This is a completely editable PowerPoint presentation and is available for immediate download. Download now and impress your audience.
-
 Summarize business analytics dashboard with graphs and pie chart
Presenting this set of slides with name Summarize Business Analytics Dashboard With Graphs And Pie Chart. The topics discussed in these slides is Summarize Business Analytics Dashboard With Graphs And Pie Chart. This is a completely editable PowerPoint presentation and is available for immediate download. Download now and impress your audience.
-
 Analytical thinking icon with comparative bar graph
Presenting our set of slides with name Analytical Thinking Icon With Comparative Bar Graph. This exhibits information on two stages of the process. This is an easy to edit and innovatively designed PowerPoint template. So download immediately and highlight information on Analytical Thinking Icon With Comparative Bar Graph.
-
 Graph representing organization challenges in big data analytics
Introducing our Graph Representing Organization Challenges In Big Data Analytics set of slides. The topics discussed in these slides are Organizational, Performance, Data Velocity. This is an immediately available PowerPoint presentation that can be conveniently customized. Download it and convince your audience.
-
 Consultant analyze data analytics graph on monitor
Introducing our premium set of slides with Consultant Analyze Data Analytics Graph On Monitor. Ellicudate the one stage and present information using this PPT slide. This is a completely adaptable PowerPoint template design that can be used to interpret topics like Consultant Analyze Data Analytics Graph On Monitor. So download instantly and tailor it with your information.
-
 Recruitment solution icon with analytics technology and graphs
Introducing our Recruitment Solution Icon With Analytics Technology And Graphs set of slides. The topics discussed in these slides are Recruitment Solution Icon With Analytics Technology And Graphs. This is an immediately available PowerPoint presentation that can be conveniently customized. Download it and convince your audience.
-
 Scatter graph representing data analytics
Introducing our Scatter Graph Representing Data Analytics set of slides. The topics discussed in these slides are Scatter Graph Representing Data Analytics. This is an immediately available PowerPoint presentation that can be conveniently customized. Download it and convince your audience.
-
 Advanced analytics graph with trendline
Introducing our Advanced Analytics Graph With Trendline set of slides. The topics discussed in these slides are Advanced Analytics Graph With Trendline. This is an immediately available PowerPoint presentation that can be conveniently customized. Download it and convince your audience.
-
 Analytics improve icon with graph
Presenting this set of slides with name Analytics Improve Icon With Graph. This is a three stage process. The stages in this process are Improve Icon, Business Profits, Team Performance. This is a completely editable PowerPoint presentation and is available for immediate download. Download now and impress your audience.
-
 Roadmap how to drive revenue with customer journey analytics ppt graph charts
Increase audience engagement and knowledge by dispensing information using Roadmap How To Drive Revenue With Customer Journey Analytics Ppt Graph Charts. This template helps you present information on five stages. You can also present information on Roadmap using this PPT design. This layout is completely editable so personaize it now to meet your audiences expectations.


