Powerpoint Templates and Google slides for Fulfilment Delays
Save Your Time and attract your audience with our fully editable PPT Templates and Slides.
-
 Delayed Order Fulfillment Issues For B2b Products B2b Ecommerce Service Challenges
This slide showcases delayed order fulfillment issues faced by b2b ecommerce platforms, referable for businesses in recognizing major issues. It provides details about the lack of efficient logistics, shipping costs, order errors, etc.Introducing Delayed Order Fulfillment Issues For B2b Products B2b Ecommerce Service Challenges to increase your presentation threshold. Encompassed with three stages, this template is a great option to educate and entice your audience. Dispence information on Shipping Costs, Order Errors, Damage During Transit, Key Insights, using this template. Grab it now to reap its full benefits.
-
 Order fill rate for delayed orders fulfilment process powerpoint slide
Presenting order fill rate for delayed orders fulfilment process powerpoint slide. This presentation slide shows two Key Performance Indicators or KPIs. The first KPI that can be show is Average Days Late Per Late Order. The second KPI is Fulfillment Process Costs as percentage Opex. These KPI Powerpoint graphics are all data driven, and the shape automatically adjusts according to your data. Just right click on the KPI graphic, enter the right value and the shape will adjust automatically. Make a visual impact with our KPI slides.
-
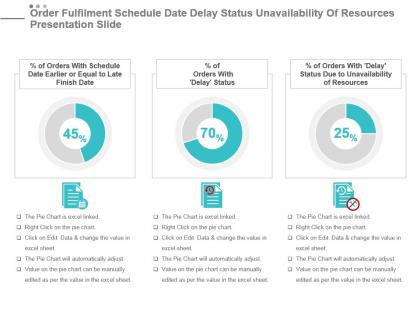
 Order fulfilment schedule date delay status unavailability of resources presentation slide
Presenting order fulfilment schedule date delay status unavailability of resources presentation slide. This presentation slide shows three Key Performance Indicators or KPIs. The first KPI that can be show is percentage of Orders With Schedule Date Earlier or Equal to Late Finish Date. The second KPI is percentage of Orders With Delay Status and the third is percentage of Orders With Delay Status Due to Unavailability of Resources. These KPI Powerpoint graphics are all data driven, and the shape automatically adjusts according to your data. Just right click on the KPI graphic, enter the right value and the shape will adjust automatically. Make a visual impact with our KPI slides.


