Powerpoint Templates and Google slides for Financial Slide
Save Your Time and attract your audience with our fully editable PPT Templates and Slides.
-
 Six pie charts for financial percentage analysis powerpoint slides
Six pie charts for financial percentage analysis PowerPoint Slide. Editable shapes, colors and text. Presentable and easy to comprehend info graphic format. Presentation designs accessible in standard and widescreen view. The presentation template can be downloaded and saved in any desired format. Privilege of insertion of logo and trademarks for more personalization. Fully adaptable PPT slides with Google slides. Easy to edit and customize as per your needs.
-
 Four staged financial agenda slide powerpoint slides
Flexible PPT designs as goes well with Google slides. 100% editable PowerPoint slide as easily amendable. Presentation template watchable in standard and widescreen view. Download is quick and can be convert into JPEG and PDF document. More presentation designs accessible with different nodes and stages. Suitable for financial professionals, executives and leaders.
-
 Four staged donut charts for financial analysis powerpoint slides
Presenting four staged donut charts for financial analysis powerpoint slides. This Power Point template slide has been crafted with graphic of four donut charts diagram. This PPT diagram contains the concept of financial analysis. Use this PPT diagram slide for business and finance related presentations.
-
 Six staged financial analysis and team management powerpoint slides
Presenting six staged financial analysis and team management powerpoint slides. This Power Point template slide has been crafted with graphic of six staged finance and team diagram. This PPT slide contains the concept of team management and financial analysis . Use this PPT slide for business and finance related presentations.
-
 Business growth chart with financial icons powerpoint slides
Presenting business growth chart with financial icons powerpoint slides. This Power Point template diagram slide has been crafted with graphic of business chart and finance icons. This PPT slide contains the concept of business growth analysis. Use this PPT slide for business and finance related presentations.
-
 Financial values for service about us page powerpoint slides
PPT slide can be used by businessmen, micro, small and medium enterprises as a master slide, as the face of the company. PowerPoint presentation supports filling background in a different color from the text. All images are 100% editable in the presentation slide. Presentation icon supports changing the color, size and orientation of any icon to your liking. PPT design is easy for proofing and editing.
-
 Bar graph for financial data representation powerpoint slides
Presenting bar graph for financial data representation powerpoint slides. This Power Point template slide has been crafted with graphic of bar graph and data. This PPT slide contains the concept of financial data representation. Use this PPT slide for business and finance related presentations.
-
 Date and days chart for financial process powerpoint slides
Presenting date and days chart for financial process powerpoint slides. This Power Point template slide has been crafted with graphic of date and days chart. This PPT slide contains the concept of financial process flow representation. Use this PPT slide for business and finance related presentations.
-
 Financial data table for analysis powerpoint slides
Presenting financial data table for analysis powerpoint slides. This Power Point template slide has been crafted with graphic of data table. This PPT slide contains the concept of financial data analysis. Use this PPT slide for business and finance related presentations.
-
 Five staged bar graph for financial data analysis powerpoint slides
Presenting five staged bar graph for financial data analysis powerpoint slides. This Power Point template slide has been crafted with graphic of five staged bar graph. This PPT slide contains the concept of financial data analysis. Use this PPT slide for business and finance related presentations.
-
 Four staged pricing table for financial analysis powerpoint slides
Presenting four staged pricing table for financial analysis powerpoint slides. This Power Point template slide has been crafted with graphic of four staged pricing table. This PPT slide contains the concept of financial data analysis. Use this PPT slide for business and finance related presentations.
-
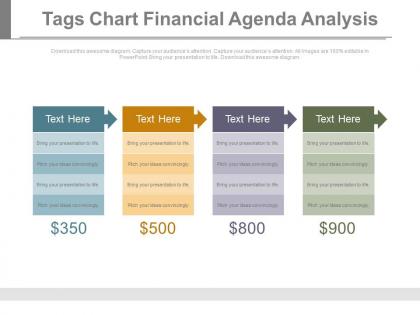 Four tags chart for financial agenda analysis powerpoint slides
Presenting four tags chart for financial agenda analysis powerpoint slides. This Power Point template slide has been crafted with graphic of four tags chart. This PPT slide contains the concept of financial agenda analysis. Use this PPT slide for business and finance related presentations.
-
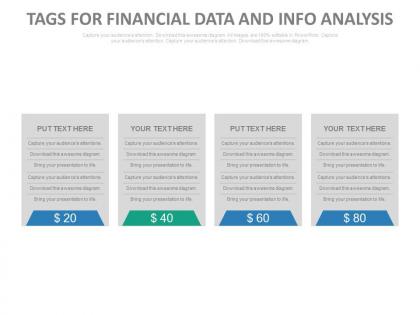 Four tags for financial data and info analysis powerpoint slides
Presenting four tags for financial data and info analysis powerpoint slides. This Power Point template slide has been crafted with graphic of four tags. This PPT slide contains the concept of financial data and info analysis. Use this PPT slide for business and finance related presentations.
-
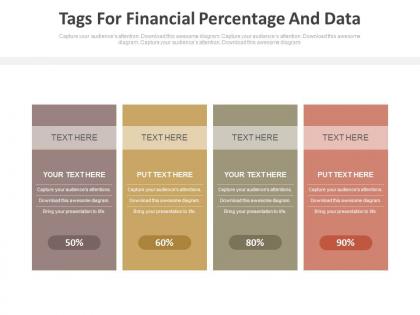 Four tags for financial percentage and data powerpoint slides
Presenting four tags for financial percentage and data powerpoint slides. This Power Point template slide has been crafted with graphic of four tags. This PPT slide contains the concept of financial data and percentage analysis. Use this PPT slide for business and finance related presentations.
-
 Higher to lower pricing table for financial value updation powerpoint slides
Presenting higher to lower pricing table for financial value updation powerpoint slides. This Power Point template slide has been crafted with graphic of pricing table. This PPT slide contains the concept of higher to lower financial value updation and representation. Use this PPT slide for business and finance related presentations.
-
 Revenue chart for financial value segmentation powerpoint slides
Presenting revenue chart for financial value segmentation powerpoint slides. This Power Point template slide has been crafted with graphic of revenue chart. This PPT slide contains the concept of financial value segmentation. Use this PPT slide for business and finance related presentations.
-
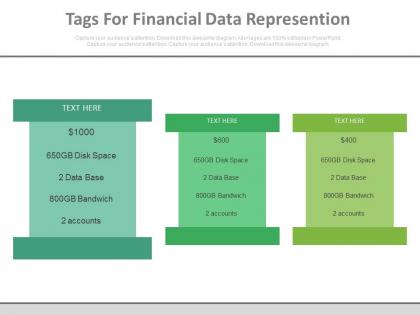 Three infographic tags for financial data representation powerpoint slides
Presenting three infographic tags for financial data representation powerpoint slides. This Power Point template slide has been crafted with graphic of three info graphic tags. This PPT slide contains the concept of financial data representation. Use this PPT slide for business and finance related presentations.
-
 Three tags for financial value analysis powerpoint slides
Presenting three tags for financial value analysis powerpoint slides. This Power Point template slide has been crafted with graphic of three tags. This PPT slide contains the concept of financial value analysis. Use this PPT slide for business and finance related presentations.
-
 Five staged zigzag timeline for financial analysis powerpoint slides
Presenting five staged zigzag timeline for financial analysis powerpoint slides. This Power Point template slide has been crafted with graphic of five staged zigzag timeline with years icons. This PPT slide contains the concept of financial analysis and growth representation. Use this PPT slide for business and finance related presentations.
-
 Circle chart with percentage values for financial data powerpoint slides
Clearly describes the financial data and information without creating any misconceptions. Helps in making future plans and strategies. User friendly PowerPoint Presentation diagrams. Creates a sense of positivity and professionalism. Extremely favorable for the business owners, investors, clients and customers. Delivers a true and correct presentation message.
-
 Dollar value linear chart for financial growth powerpoint slides
Presenting dollar value linear chart for financial growth powerpoint slides. This Power Point template slide has been crafted with graphic of dollar value linear chart icons. This PPT slide contains the concept of financial growth analysis. Use this PPT slide for business and finance related presentations.
-
 Four text boxes with dollar values for financial management powerpoint slides
Presenting four text boxes with dollar values for financial management powerpoint slides. This Power Point template slide has been crafted with graphic of four text boxes and dollar diagram. This PPT slide contains the concept of financial management. Use this PPT slide for business and finance related presentations.
-
 Percentage chart for financial analysis powerpoint slides
Presenting percentage chart for financial analysis powerpoint slides. This Power Point template slide has been crafted with graphic of percentage chart diagram. This PPT slide contains the concept of financial analysis. Use this PPT slide for business and finance related presentations.
-
 Three tags for financial data representation powerpoint slides
High resolution PPT example for business finance. Increase the level of personalization with your company logo and name. Compatible with all software and can be saved in any format. Useful tool for business analysts, sales people, sales managers and professionals of any industry. Precise and easy to comprehend information on PPT sample. Useful for finance and business related presentations. Wide screen projection does not affect the output adversely.
-
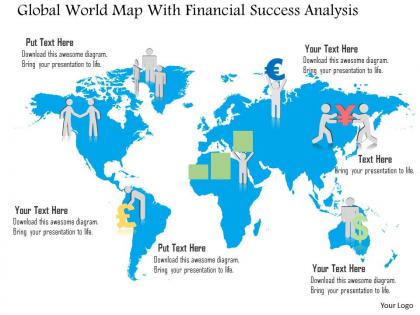 Global world map with financial success analysis ppt presentation slides
Quick and simple hassle free download. Absolutely editable icons and PPT infographics-remove or keep to your liking. Original resolution of PPT images unchanged post editing. Insert text to enhance the effect of graphics. Totally editable colors, contrast, orientation and sizes of PPT icons. Add your own company logo, tagline, trademark, brand name, watermark etc.
-
 World map with financial networking chart ppt presentation slides
Presenting world map with financial networking chart ppt presentation slides. This Power Point template slide has been crafted with graphic of world map and networking chart diagram. This PPT slide contains the concept of global financial networking representation. Use this PPT side for business and finance related presentations.
-
 World map with financial success analysis ppt presentation slides
Presenting world map with financial success analysis ppt presentation slides. This Power Point template slide has been crafted with graphic of world map and finance icons diagram. This PPT slide contains the concept of financial success analysis representation. Use this PPT side for business and finance related presentations.
-
 Alphabet tags for financial management analysis powerpoint slides
Presenting alphabet tags for financial management analysis powerpoint slides. This Power Point template diagram slide has been crafted with graphic of alphabet tags. This PPT diagram contains the concept of financial management analysis. Use this PPT diagram for business and finance related presentations.
-
 Blackboard with text boxes for financial analysis powerpoint slides
Presenting blackboard with text boxes for financial analysis powerpoint slides. This Power Point template diagram slide has been crafted with graphic of black board and text boxes. This PPT diagram contains the concept of financial analysis. Use this PPT diagram for business and finance related presentations.
-
 Four colored banners and icons for financial process powerpoint slides
Presenting four colored banners and icons for financial process powerpoint slides. This Power Point template diagram slide has been crafted with graphic of four colored banners and icons diagram. This PPT diagram contains the concept of financial process flow representation. Use this PPT diagram for business and marketing related presentations.
-
 Four staged financial calculation diagram powerpoint slides
Presenting four staged financial calculation diagram powerpoint slides. This Power Point template diagram slide has been crafted with graphic of four staged calculation diagram. This PPT diagram contains the concept of financial calculation. Use this PPT diagram for business and marketing related presentations.
-
 Four tags and percentage chart financial analysis powerpoint slides
Presenting four tags and percentage chart financial analysis powerpoint slides. This Power Point template diagram slide has been crafted with graphic of four tags and percentage chart diagram. This PPT diagram contains the concept of financial analysis. Use this PPT diagram for business and finance related presentations.
-
 Four text boxes for financial agenda analysis powerpoint slides
Adaptable introduction slides as completely perfect with Google slides. PowerPoint outline open in standard and widescreen see. 100% modifiable PPT format as altering is conceivable with shading, content and textual style. Comparable outlines accessible with various hubs and stages. Simple to download and share. Snappy to change over into JPEG and PDF archive. Ideal for Finance pioneers, sellers, bankers, and administrators.
-
 Six staged tags for financial data representation powerpoint slides
Presenting six staged tags for financial data representation powerpoint slides. This Power Point template diagram slide has been crafted with graphic of six staged tags diagram. This PPT diagram contains the concept of financial data representation. Use this PPT diagram for business and finance related presentations.
-
 Three square tags with financial details powerpoint slides
Presenting three square tags with financial details powerpoint slides. This Power Point template diagram slide has been crafted with graphic of three square tags diagram. This PPT diagram contains the concept of financial details representation. Use this PPT diagram for business and finance related presentations.
-
 Three tags financial chart with percentage powerpoint slides
Presenting three tags financial chart with percentage powerpoint slides. This Power Point template diagram slide has been crafted with graphic of three tags and chart diagram. This PPT diagram contains the concept of financial data analysis representation. Use this PPT diagram for business and finance related presentations.
-
 Five staged financial strategy timeline diagram powerpoint slides
Presenting five staged financial strategy timeline diagram powerpoint slides. This power point template diagram has been crafted with graphic of five staged timeline diagram. This PPT icon slide contains the concept of financial strategy timeline representation. Use this PPT diagram for business and marketing related presentations.
-
 Five staged linear timeline for financial strategy powerpoint slides
Presenting five staged linear timeline for financial strategy powerpoint slides. This power point template diagram has been crafted with graphic of five staged linear timeline diagram. This PPT icon slide contains the concept of financial strategy representation. Use this PPT diagram for business and marketing related presentations.
-
 Five staged timeline for financial planning powerpoint slides
Presenting five staged timeline for financial planning powerpoint slides. This power point template diagram has been crafted with graphic of five staged timeline diagram. This PPT icon slide contains the concept of financial planning representation. Use this PPT diagram for business and finance related presentations.
-
 Six staged spiral timeline for financial analysis powerpoint slides
Presenting six staged spiral timeline for financial analysis powerpoint slides. This power point template diagram has been crafted with graphic of six staged spiral timeline diagram. This PPT icon slide contains the concept of financial analysis representation. Use this PPT diagram for business and finance related presentations.
-
 Year based linear timeline for financial strategy powerpoint slides
Stuffed with astounding characteristics to impress the viewers. Visually stunning PowerPoint presentation slides. Easy processing and Editing. These tremendous PPT patterns make a perfect combination with your presentation. Provide error free and Hassel free performance. Remarkable utilization of timeline diagrams and designs. User friendly tools and techniques have been used for modelling these templates.
-
 Three financial tags for comparison powerpoint slides
Presenting three financial tags for comparison powerpoint slides. This Power Point template slide has been crafted with graphic of three financial tags diagram. This PPT slide contains the concept of financial data representation .Use this PPT slide for business and finance related presentations.
-
 Global financial quotes for business powerpoint slides
Top quality images used in the Presentation design. High resolution of PPT design ensures hassle free projection on wide screen. Easily downloadable and can be projected in JPG and PDF format. Can form an integral part of multiple business topics presentation. 100 percent editable as color, text and font can be edited. Matching designs accessible with different nodes and stages. Appropriate for finance managers, accountants, teachers etc.
-
 Five staged linear banner financial icons powerpoint slides
Presenting five staged linear banner financial icons powerpoint slides. This Power Point icon template slide has been crafted with graphic of five linear banner icons. This icon template slide contains the concept of financial analysis. Use this icon template slide can be used for business and finance related presentations.
-
 Bar graph and line chart for financial planning powerpoint slides
Presenting bar graph and line chart for financial planning powerpoint slides. This Power Point template slide has been crafted with graphic of bar graph and line chart. This PPT slide contains the concept of financial planning. Use this PPT slide for business and finance related presentations.
-
 Bar graph for financial analysis powerpoint slides
Presenting bar graph for financial analysis powerpoint slides. This Power Point template slide has been crafted with graphic of bar graph. This PPT slide contains the concept of financial data analysis. Use this PPT slide for business and finance related presentations.
-
 Board for financial analysis with bar graph powerpoint slides
Presenting board for financial analysis with bar graph powerpoint slides. This Power Point template slide has been crafted with graphic of bar graph and board. This PPT slide contains the concept of financial analysis. Use this PPT slide for business and finance related presentations.
-
 Financial projection line charts powerpoint slides
Presenting financial projection line charts powerpoint slides. This Power Point template slide has been crafted with graphic of projection line chart and icons. This PPT slide contains the concept of financial projection for future and analysis. Use this PPT slide for business and finance related presentations.
-
 Five staged financial percentage chart powerpoint slides
Presenting five staged financial percentage chart powerpoint slides. This Power Point template slide has been crafted with graphic of five staged percentage chart. This PPT slide contains the concept of financial analysis. Use this PPT slide for business and finance related presentations.
-
 Four tags with price list for financial mangement powerpoint slides
Presenting four tags with price list for financial mangement powerpoint slides. This Power Point template slide has been crafted with graphic of four tags and price list. This PPT slide contains the concept of financial management. Use this PPT slide for business and finance related presentations.
-
 Percentage cycle with bar graph for financial analysis powerpoint slides
Presenting percentage cycle with bar graph for financial analysis powerpoint slides. This Power Point template slide has been crafted with graphic of percentage cycle and bar graph. This PPT slide contains the concept of financial analysis. Use this PPT slide for business and finance related presentations.
-
 Two line charts financial projection powerpoint slides
Presenting two line charts financial projection powerpoint slides. This Power Point template slide has been crafted with graphic of two line chart. This PPT slide contains the concept of financial projection. Use this PPT slide for business and finance related presentations.
-
 Bar graph with map of spain for financial analysis powerpoint slides
Presenting bar graph with map of spain for financial analysis powerpoint slides. This Power Point template slide has been crafted with graphic of bar graph and map of Spain. This PPT diagram contains the concept of financial analysis for Spain. Use this PPT diagram for business and Finance related presentations.
-
 Bar graph for financial data analysis powerpoint slides
Presenting bar graph for financial data analysis powerpoint slides. This Power Point template diagram with graphic of bar graph and finance icons. This PPT diagram contains the concept of financial data analysis. Use this PPT diagram for business and finance related presentations.
-
 Dollar plant diagram for financial growth analysis powerpoint slides
Presenting dollar plant diagram for financial growth analysis powerpoint slides. This Power Point template diagram with graphic of dollar plant and finance icons. This PPT diagram contains the concept of financial growth analysis. Use this PPT diagram for business and finance related presentations.
-
 Financial analysis table with five segments powerpoint slides
Presenting financial analysis table with five segments powerpoint slides. This Power Point template diagram with graphic of finance table with five segments. This PPT diagram contains the concept of financial analysis. Use this PPT diagram for business and finance related presentations.
-
 Financial planning with icons for analysis powerpoint slides
Presenting financial planning with icons for analysis powerpoint slides. This Power Point template diagram with graphic of finance icons. This PPT diagram contains the concept of financial planning and analysis. Use this PPT diagram for business and finance related presentations.
-
 Five staged bar graph for financial management analysis powerpoint slides
Presenting five staged bar graph for financial management analysis powerpoint slides. This Power Point template diagram with graphic of five staged bar graph and icons. This PPT diagram contains the concept of financial management analysis. Use this PPT diagram for business and finance related presentations.
-
 Four circles bar graph financial growth analysis powerpoint slides
Presenting four circles bar graph financial growth analysis powerpoint slides. This Power Point template diagram with graphic of four circles and bar graph. This PPT diagram contains the concept of financial growth analysis. Use this PPT diagram for business and finance related presentations.
-
 Four directional financial analysis chart powerpoint slides
Presenting four directional financial analysis chart powerpoint slides. This Power Point template diagram with graphic of four directional chart. This PPT diagram contains the concept of financial analysis. Use this PPT diagram for business and finance related presentations.


