Powerpoint Templates and Google slides for Financial KPI
Save Your Time and attract your audience with our fully editable PPT Templates and Slides.
-
 Financial Assets Management Kpi And Dashboard Powerpoint Presentation Slides
This complete deck focuses on Financial Assets Management Kpi And Dashboard Powerpoint Presentation Slides and consists of professionally designed templates with suitable graphics and appropriate content. This deck has a total of twenty-five slides. Our designers have created customizable templates for your convenience. You can make the required changes in the templates like color, text and font size. The presentation is fully supported by Google Slides. It can be easily converted into JPG or PDF format. When you download this presentation by clicking the download button, you get the presentation in both standard and widescreen formats.
-
 Financial Performance KPI Powerpoint Ppt Template Bundles
Deliver a credible and compelling presentation by deploying this Financial Performance KPI Powerpoint Ppt Template Bundles. Intensify your message with the right graphics, images, icons, etc. presented in this complete deck. This PPT template is a great starting point to convey your messages and build a good collaboration. The twelve slides added to this PowerPoint slideshow helps you present a thorough explanation of the topic. You can use it to study and present various kinds of information in the form of stats, figures, data charts, and many more. This Financial Performance KPI Powerpoint Ppt Template Bundles PPT slideshow is available for use in standard and widescreen aspects ratios. So, you can use it as per your convenience. Apart from this, it can be downloaded in PNG, JPG, and PDF formats, all completely editable and modifiable. The most profound feature of this PPT design is that it is fully compatible with Google Slides making it suitable for every industry and business domain.
-
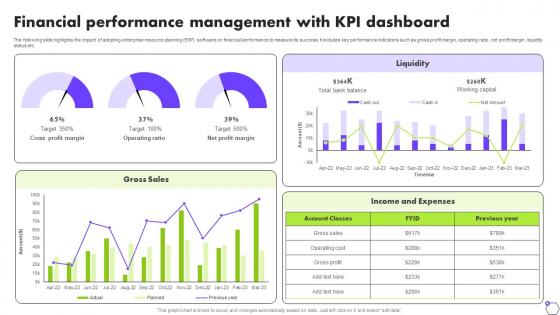 Financial Performance Management With KPI Dashboard Deploying ERP Software System Solutions
The following slide highlights the impact of adopting enterprise resource planning ERP software on financial performance to measure its success. It includes key performance indicators such as gross profit margin, operating ratio, net profit margin, liquidity status etc. Deliver an outstanding presentation on the topic using this Financial Performance Management With KPI Dashboard Deploying ERP Software System Solutions. Dispense information and present a thorough explanation of Gross Sales, Liquidity using the slides given. This template can be altered and personalized to fit your needs. It is also available for immediate download. So grab it now.
-
 Financial Kpi Report Dashboard For Investment Bank
This slide shows KPI dashboard to assist investor in analyzing financial report of investment bank. It includes current assets, current liabilities, cash conversion cycle, vendor payment system etc. Presenting our well structured Financial Kpi Report Dashboard For Investment Bank. The topics discussed in this slide are Financial, Dashboard, Investment Bank. This is an instantly available PowerPoint presentation that can be edited conveniently. Download it right away and captivate your audience.
-
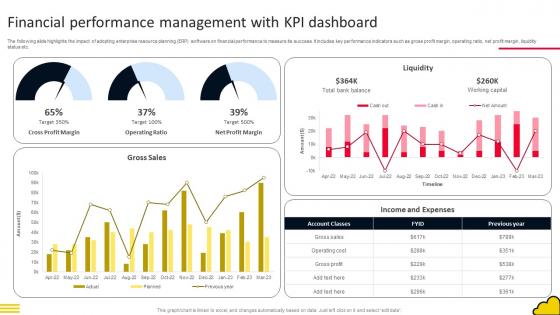 Adopting Cloud Based Financial Performance Management With Kpi Dashboard
Deliver an outstanding presentation on the topic using this Adopting Cloud Based Financial Performance Management With Kpi Dashboard Dispense information and present a thorough explanation of Cross Profit Margin, Operating Ratio, Net Profit Margin using the slides given. This template can be altered and personalized to fit your needs. It is also available for immediate download. So grab it now.
-
 Financial Performance Management With KPI Dashboard Estimating ERP System
The following slide highlights the impact of adopting enterprise resource planning ERP software on financial performance to measure its success. It includes key performance indicators such as gross profit margin, operating ratio, net profit margin, liquidity status etc. Deliver an outstanding presentation on the topic using this Financial Performance Management With KPI Dashboard Estimating ERP System. Dispense information and present a thorough explanation of Gross Sales, Liquidity, Financial, Performance Management using the slides given. This template can be altered and personalized to fit your needs. It is also available for immediate download. So grab it now.
-
 Financial Performance Management With KPI Dashboard Enhancing Business Operations
The following slide highlights the impact of adopting enterprise resource planning ERP software on financial performance to measure its success. It includes key performance indicators such as gross profit margin, operating ratio, net profit margin, liquidity status etc. Deliver an outstanding presentation on the topic using this Financial Performance Management With KPI Dashboard Enhancing Business Operations. Dispense information and present a thorough explanation of Gross Sales, Income And Expenses, Financial Performance using the slides given. This template can be altered and personalized to fit your needs. It is also available for immediate download. So grab it now.
-
 Financial Performance Appraisal KPI Dashboard
This slide includes the dashboard for performance appraisal of finance function to evaluate business financial position. This includes various parameters such as current ratio, quick ratio, cash flow ratio, etc. Presenting our well structured Financial Performance Appraisal KPI Dashboard. The topics discussed in this slide are Financial, Performance, Appraisal. This is an instantly available PowerPoint presentation that can be edited conveniently. Download it right away and captivate your audience.
-
 Agile Financial Analytics Kpi Dashboard
This slide showcases financial analytics KPI dashboard. This slide aims to provide in depth insights into company financial status to add value to the company. It helps in improving financial performance through proper information about the expenses and revenue of the organization. Presenting our well structured Agile Financial Analytics Kpi Dashboard. The topics discussed in this slide are Current Ratio Mom Trend, Dimension Breakdown.This is an instantly available PowerPoint presentation that can be edited conveniently. Download it right away and captivate your audience.
-
 Defining ERP Software Financial Performance Management With KPI Dashboard
The following slide highlights the impact of adopting enterprise resource planning ERP software on financial performance to measure its success. It includes key performance indicators such as gross profit margin, operating ratio, net profit margin, liquidity status etc. Deliver an outstanding presentation on the topic using this Defining ERP Software Financial Performance Management With KPI Dashboard. Dispense information and present a thorough explanation of Financial Performance, Management With KPI Dashboard, Gross Sales using the slides given. This template can be altered and personalized to fit your needs. It is also available for immediate download. So grab it now.
-
 Business Financial Savings KPI Dashboard To Evaluate Cash Performance
This slide showcases evaluating cash performance with business financial savings KPI dashboard. This slide includes savings, income and expenses vs their last year money and weekly savings per day for company. Introducing our Business Financial Savings KPI Dashboard To Evaluate Cash Performance set of slides. The topics discussed in these slides are Weekly Savings, Savings. This is an immediately available PowerPoint presentation that can be conveniently customized. Download it and convince your audience.
-
 KPI Dashboard For Company Financial Audit
The below slide provides a financial audit dashboard for a company that help to understand the inventory and sales transactions. It mentions quick ration, cash balance, days sales outstanding, days payable outstanding, etc. Introducing our KPI Dashboard For Company Financial Audit set of slides. The topics discussed in these slides are Days Sales Outstanding, Days Inventory Outstanding, Days Payable Outstanding. This is an immediately available PowerPoint presentation that can be conveniently customized. Download it and convince your audience.
-
 Non Profit Organization KPI Dashboard For Analyzing Financial Health
This slide represents non profit organization KPI dashboard for analyzing financial health which assists to focus in financial health of non profit organizations. It includes key components such as total donation, total donor, etc . Introducing our Non Profit Organization KPI Dashboard For Analyzing Financial Health set of slides. The topics discussed in these slides are Total Donation, Total Donor, One-Time Amount, Recurring Amount. This is an immediately available PowerPoint presentation that can be conveniently customized. Download it and convince your audience.
-
 Digital Marketing Techniques Kpi Dashboard To Determine Financial Performance Strategy SS V
This slide provides an overview of the dashboard that helps to determine the companys financial position. The dashboard includes return on assets, equity, debt-equity ratio, share price, PE ratio and working capital. Deliver an outstanding presentation on the topic using this Digital Marketing Techniques Kpi Dashboard To Determine Financial Performance Strategy SS V Dispense information and present a thorough explanation of Return On Assets, Return On Equity, Working Capital Ratio using the slides given. This template can be altered and personalized to fit your needs. It is also available for immediate download. So grab it now.
-
 KPI Dashboard Showcasing Organisation Financial The Ultimate Guide To Corporate Financial Distress
This slide showcases financial management dashboard that enables organizations to track and analyze the capital structure. It includes return on assets, return on equity, working capital ratio, debt-equity ratio, and return on equity. Present the topic in a bit more detail with this KPI Dashboard Showcasing Organisation Financial The Ultimate Guide To Corporate Financial Distress. Use it as a tool for discussion and navigation on Debit Equity Ratio, Working Capital Ratio, Return On Assets. This template is free to edit as deemed fit for your organization. Therefore download it now.
-
 Financial planning and reporting KPI dashboard
This slide represents a dashboard highlighting the report prepared by the financial planning team. It includes net product revenue, gross margin, cost of goods sold etc. Introducing our Financial planning and reporting KPI dashboard set of slides. The topics discussed in these slides are Net Product Revenue, Quarter Analysis, Gross Margin. This is an immediately available PowerPoint presentation that can be conveniently customized. Download it and convince your audience.
-
 KPI Marketing Dashboard For Insurance Financial Services Enterprise
Following slide highlights insurance financial service enterprise KPI marketing dashboard for networking opportunities. It further covers quoted vs actual data, campaign revenue analysis, product line campaign chart, etc. Introducing our KPI Marketing Dashboard For Insurance Financial Services Enterprise set of slides. The topics discussed in these slides are KPI Marketing Dashboard, Insurance Financial, Services Enterprise.This is an immediately available PowerPoint presentation that can be conveniently customized. Download it and convince your audience.
-
 KPI Marketing Plan Performance Dashboard For Financial Services Enterprise
Following slide represents financial services enterprise KPI marketing plan dashboard for lead generation status. It further covers new visitors, unique visitors, bounce rate, average time on site, etc. Presenting our well structured KPI Marketing Plan Performance Dashboard For Financial Services Enterprise. The topics discussed in this slide are New Visitors, Unique Visitor, Bounce Rate. This is an instantly available PowerPoint presentation that can be edited conveniently. Download it right away and captivate your audience.
-
 Financial KPI Analysis For Organization Wealth Strength
The slide aims to highlight the crucial role of Financial KPI analysis in evaluating organizational wealth strength, enabling strategic decision-making for sustained financial well-being. Introducing our Financial KPI Analysis For Organization Wealth Strength set of slides. The topics discussed in these slides are Financial KPI Analysis, Organization Wealth Strength, Strategic Decision Making. This is an immediately available PowerPoint presentation that can be conveniently customized. Download it and convince your audience.
-
 KPI Dashboard For Effective Financial Asset Implementing Financial Asset Management Strategy
This slide covers dashboard to analyze financial asset information effectively. It involves details such as total assets, total revenue generated and sales. Present the topic in a bit more detail with this KPI Dashboard For Effective Financial Asset Implementing Financial Asset Management Strategy. Use it as a tool for discussion and navigation on Asset Under Management, Revenue, Sales. This template is free to edit as deemed fit for your organization. Therefore download it now.
-
 KPI Dashboard To Assess Portfolio Investment Implementing Financial Asset Management Strategy
This slide covers KPI dashboard to track return on portfolio investment. It involves KPIs such as total invested amount, total investment, rate of return and total investments on yearly basis. Deliver an outstanding presentation on the topic using this KPI Dashboard To Assess Portfolio Investment Implementing Financial Asset Management Strategy. Dispense information and present a thorough explanation of Total Invested Amount, Total Investments, Rate Of Return using the slides given. This template can be altered and personalized to fit your needs. It is also available for immediate download. So grab it now.
-
 Financial Services KPI Dashboard For Analyzing Transactions
This slide highlights KPI dashboard for banking sector. The purpose of this template is to help bank employees and customers in easy decision-making using visualized financial data. It includes elements such as revenue by branch, profit by branch, etc. Introducing our Financial Services KPI Dashboard For Analyzing Transactions set of slides. The topics discussed in these slides are Revenue By Branch, Expenses By Branch, Profit By Branch. This is an immediately available PowerPoint presentation that can be conveniently customized. Download it and convince your audience.
-
 Trade Promotion Practices To Increase Kpi Dashboard To Determine Financial Performance Strategy SS V
This slide provides an overview of the dashboard that helps to determine the company financial position. The dashboard includes return on assets, equity, debt-equity ratio, share price, P or E ratio and working capital. Present the topic in a bit more detail with this Trade Promotion Practices To Increase Kpi Dashboard To Determine Financial Performance Strategy SS V. Use it as a tool for discussion and navigation on KPI Dashboard, Financial Performance, Debt Equity Ratio, Working Capital. This template is free to edit as deemed fit for your organization. Therefore download it now.
-
 KPI Dashboard To Determine Financial Trade Promotion To Increase Brand Strategy SS V
This slide provides an overview of the dashboard that helps to determine the companys financial position. The dashboard includes return on assets, equity, debt-equity ratio, share price, PE ratio and working capital. Deliver an outstanding presentation on the topic using this KPI Dashboard To Determine Financial Trade Promotion To Increase Brand Strategy SS V. Dispense information and present a thorough explanation of Working Capital Ratio, Debt-Equity Ratio, Return On Equity using the slides given. This template can be altered and personalized to fit your needs. It is also available for immediate download. So grab it now.
-
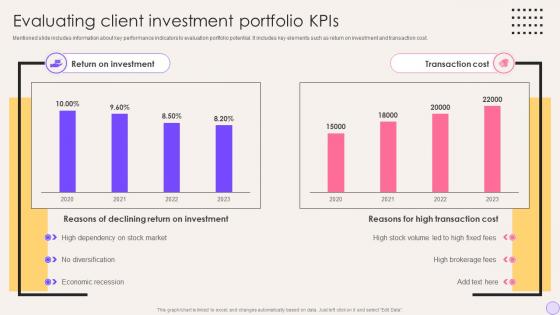 Evaluating Client Investment Portfolio Kpis Financial Portfolio Expansion
Mentioned slide includes information about key performance indicators to evaluation portfolio potential. It includes key elements such as return on investment and transaction cost. Present the topic in a bit more detail with this Evaluating Client Investment Portfolio Kpis Financial Portfolio Expansion Use it as a tool for discussion and navigation on Return On Investment, Transaction Cost This template is free to edit as deemed fit for your organization. Therefore download it now.
-
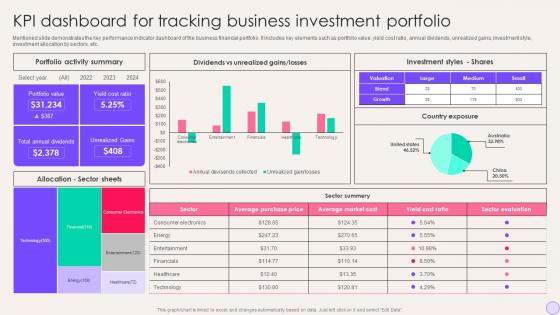 Kpi Dashboard For Tracking Business Investment Portfolio Financial Portfolio Expansion
Mentioned slide demonstrates the key performance indicator dashboard of the business financial portfolio. It includes key elements such as portfolio value, yield cost ratio, annual dividends, unrealized gains, investment style, investment allocation by sectors, etc. Deliver an outstanding presentation on the topic using this Kpi Dashboard For Tracking Business Investment Portfolio Financial Portfolio Expansion Dispense information and present a thorough explanation of Portfolio Activity Summary, Investment Styles Shares using the slides given. This template can be altered and personalized to fit your needs. It is also available for immediate download. So grab it now.
-
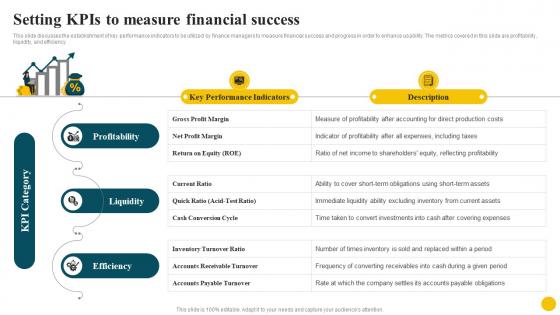 Setting Kpis To Measure Financial Success Resolving Corporate Issues
This slide discusses the establishment of key performance indicators to be utilized by finance managers to measure financial success and progress in order to enhance usability. The metrics covered in this slide are profitability, liquidity, and efficiency. Introducing Setting Kpis To Measure Financial Success Resolving Corporate Issues to increase your presentation threshold. Encompassed with two stages, this template is a great option to educate and entice your audience. Dispence information on Key Performance Indicators, Profitability, Liquidity, using this template. Grab it now to reap its full benefits.
-
 KPIs For Measuring New Entity Financial Performance Post Merger Financial Integration CRP DK SS
This slide showcases KPIs used to measure merged businesses financial performance which includes revenue growth, synergy achievement, free cash flow with target and financial drivers. Deliver an outstanding presentation on the topic using this KPIs For Measuring New Entity Financial Performance Post Merger Financial Integration CRP DK SS. Dispense information and present a thorough explanation of Financial Drivers, Synergy Achievement, Free Cash Flow using the slides given. This template can be altered and personalized to fit your needs. It is also available for immediate download. So grab it now.
-
 Kpi financial controller ppt powerpoint presentation show infographic template cpb
Presenting KPI Financial Controller Ppt Powerpoint Presentation Show Infographic Template Cpb slide which is completely adaptable. The graphics in this PowerPoint slide showcase three stages that will help you succinctly convey the information. In addition, you can alternate the color, font size, font type, and shapes of this PPT layout according to your content. This PPT presentation can be accessed with Google Slides and is available in both standard screen and widescreen aspect ratios. It is also a useful set to elucidate topics like KPI Financial Controller. This well structured design can be downloaded in different formats like PDF, JPG, and PNG. So, without any delay, click on the download button now.
-
 Agriculture Financial KPIs To Evaluate Cost
This slide showcases financial KPIs to calculate and evaluate the cost of agriculture production. It further includes various elements such as return to shareholders, profitability, cash flow, investment evaluation, etc.Presenting our set of slides with Agriculture Financial KPIs To Evaluate Cost. This exhibits information on five stages of the process. This is an easy to edit and innovatively designed PowerPoint template. So download immediately and highlight information on Investment Evaluation, Variable Costs, Profitability .
-
 Benefits Of KPIs For Financial Planning In Food Industry
This slide showcases the benefits of KPIs for financial planning in food industry which helps an organization to identify operational efficiencies and benchmark performance against competitors. It include details such as measuring food and beverage sales, etc. Presenting our well structured Benefits Of KPIs For Financial Planning In Food Industry. The topics discussed in this slide are Benefits, Financial, Planning. This is an instantly available PowerPoint presentation that can be edited conveniently. Download it right away and captivate your audience.
-
 Financial KPIs To Track Project Management
This slide covers financial kpis for project management. The purpose of this template is to provide an overview of key financial metrics used to evaluate project performance. It includes planned value, actual project cost, earned value, project cost variance CV, project cost overrun, and cost performance index CPI. Presenting our well structured Financial KPIs To Track Project Management. The topics discussed in this slide are Calculate Difference, Unforeseen Expenses, Reason Performance. This is an instantly available PowerPoint presentation that can be edited conveniently. Download it right away and captivate your audience.
-
 Impact Of Improved Financial Healthcare KPIs On Hospital Management
This slide represents healthcare KPIs impact on hospital performance financially. It aims to provide insights on evolution of organization care funding and hospital performance. It includes various evaluated insights such as hospital operating margins with care funding, emergency hospital visits, operating room minutes, etc. Introducing our premium set of slides with Impact Of Improved Financial Healthcare KPIs On Hospital Management. Ellicudate the four stages and present information using this PPT slide. This is a completely adaptable PowerPoint template design that can be used to interpret topics like Hospital Operating, Operating Room Minutes, Emergency Hospital Visits. So download instantly and tailor it with your information.
-
 Financial KPI Analysis For Hospitality Training Planning
This slide shows the financial Key performance indicators to provide hospitality training on key strategies for hotel management. Presenting our well structured Financial KPI Analysis For Hospitality Training Planning. The topics discussed in this slide are Average, Occupied, Operating. This is an instantly available PowerPoint presentation that can be edited conveniently. Download it right away and captivate your audience.
-
 KPIs To Track Variance Between Actual Budgeting Process For Financial Wellness Fin SS
This slide shows various metrics which can be used by business organizations or budgeting managers to compare actual and budgeted performance. It includes KPIs such as revenue growth rate, gross profit margin, net profit margin, etc. Present the topic in a bit more detail with this KPIs To Track Variance Between Actual Budgeting Process For Financial Wellness Fin SS. Use it as a tool for discussion and navigation on Gross Profit Margin, Revenue Growth Rate, Net Profit Margin. This template is free to edit as deemed fit for your organization. Therefore download it now.
-
 Financial KPIs For Operations Manager
The following slide showcases crucial financial metrics, including receivables turnover, days sales, cash flow, quick ratio, and payable turnover, tailored for operational managers. It enables better financial management, liquidity assessment, and decision making within the organization. Presenting our well structured Financial KPIs For Operations Manager The topics discussed in this slide are Frequency, KPI Name, Description This is an instantly available PowerPoint presentation that can be edited conveniently. Download it right away and captivate your audience.
-
 Traditional Financial Planning Kpis For Company
This slide represents the key performance indicators set by the financial planning and analysis team for their business. Introducing our premium set of slides with Traditional Financial Planning Kpis For Company. Ellicudate the four stages and present information using this PPT slide. This is a completely adaptable PowerPoint template design that can be used to interpret topics like Cash Flow, Current Ratio, Working Capital. So download instantly and tailor it with your information.
-
 Financial Business KPI For Performance Efficiency
This slide highlights finance business KPI to measure financial performance of industry. This includes sales growth rate, net profit margin and account receivables turnover along with features, impact and remarks. Presenting our well structured Financial Business KPI For Performance Efficiency. The topics discussed in this slide are Financial Business KPI, Performance Efficiency, Account Receivables Turnover. This is an instantly available PowerPoint presentation that can be edited conveniently. Download it right away and captivate your audience.
-
 Financial Crisis Management Kpis To Track Performance
This slide shows information about financial risks that may lead to financial crisis. It includes elements such as potential financial risks, current financial issues, financial dependencies, action taken and improvement. It also include levels for these elements which are extreme, high, medium and low. Presenting our well structured Financial Crisis Management Kpis To Track Performance. The topics discussed in this slide are Financial Crisis Management, Track Performance, Financial Dependencies. This is an instantly available PowerPoint presentation that can be edited conveniently. Download it right away and captivate your audience.
-
 Introducing mobile financial services in developing countries branch scoreboard kpi dashboard
This slide portrays branch scoreboard dashboard covering metrics such as accounts opened and closed, deposits to goal, accounts by type, expense to budget and referrals by product. Deliver an outstanding presentation on the topic using this Introducing Mobile Financial Services In Developing Countries Branch Scoreboard KPI Dashboard. Dispense information and present a thorough explanation of Accounts Opened And Closed, Deposits To Goal, Accounts, Expense To Budget, Non Interest Income To Budget, Referrals Product using the slides given. This template can be altered and personalized to fit your needs. It is also available for immediate download. So grab it now.
-
 Financial kpi dashboard dashboards by function
Deliver an outstanding presentation on the topic using this Financial Kpi Dashboard Dashboards By Function. Dispense information and present a thorough explanation of Financial Kpi Dashboard using the slides given. This template can be altered and personalized to fit your needs. It is also available for immediate download. So grab it now.
-
 KPI Dashboard For Informational Technology Department To Analyze Key Financials
This slide shows KPI dashboard for informational technology department to analyze key financials of companies which assists in decision making for growth. It also includes information about IT department ROI, expenditure vs Allocated budget, it cost breakdown and it expenditure vs Revenue. Presenting our well structured KPI Dashboard For Informational Technology Department To Analyze Key Financials. The topics discussed in this slide are Expenditure Vs Allocated Budget, IT Expenditure Vs Revenue, IT Cost Break Down. This is an instantly available PowerPoint presentation that can be edited conveniently. Download it right away and captivate your audience.
-
 Kpis For Financial Service Delivery Using Modern Service Delivery Practices
This slide represents the KPIs for financial service delivery and how machine learning and AI can help to foresee the processes, insights that can benefit the financial sector. Deliver an outstanding presentation on the topic using this Kpis For Financial Service Delivery Using Modern Service Delivery Practices. Dispense information and present a thorough explanation of Kpis For Financial Service Delivery using the slides given. This template can be altered and personalized to fit your needs. It is also available for immediate download. So grab it now.
-
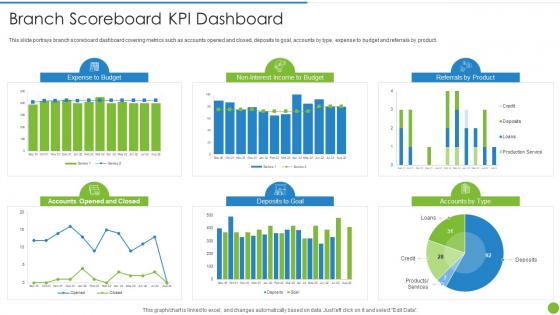 Offering Digital Financial Facility To Existing Customers Branch Scoreboard Kpi Dashboard
This slide portrays branch scoreboard dashboard covering metrics such as accounts opened and closed, deposits to goal, accounts by type, expense to budget and referrals by product. Present the topic in a bit more detail with this Offering Digital Financial Facility To Existing Customers Branch Scoreboard Kpi Dashboard. Use it as a tool for discussion and navigation on Branch Scoreboard Kpi Dashboard. This template is free to edit as deemed fit for your organization. Therefore download it now.
-
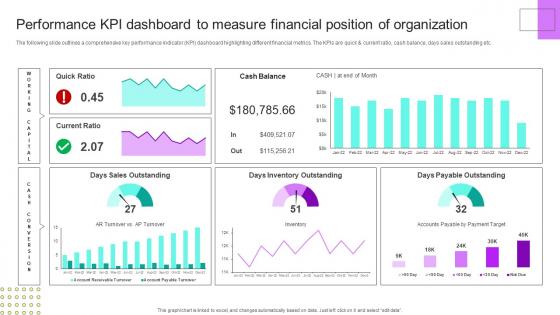 Performance Kpi Dashboard Measure Financial Position Financial Planning Analysis Guide Small Large Businesses
The following slide outlines a comprehensive key performance indicator KPI dashboard highlighting different financial metrics. The KPIs are quick and current ratio, cash balance, days sales outstanding etc. Deliver an outstanding presentation on the topic using this Performance Kpi Dashboard Measure Financial Position Financial Planning Analysis Guide Small Large Businesses. Dispense information and present a thorough explanation of Organization, Performance, Dashboard using the slides given. This template can be altered and personalized to fit your needs. It is also available for immediate download. So grab it now.
-
 Financial Objectives And KPIS With Key Approaches
The purpose of this slide is to showcase major objectives and KPIs of the financial department. Net revenue, gross margin, OPEX and EBITDA are some of the key KPIs which will assist corporation to track and improve the financial performance. Presenting our well-structured Financial Objectives And KPIS With Key Approaches. The topics discussed in this slide are Net Revenue, Gross Margin, Opex. This is an instantly available PowerPoint presentation that can be edited conveniently. Download it right away and captivate your audience.
-
 Ecommerce KPI Dashboard With P And L Statement Improving Financial Management Process
This slide showcases ecommerce key performance indicators KPI dashboard with financial statement. It provides information about total sales, orders, net profit, net profit margin, average order value, channels, etc. Deliver an outstanding presentation on the topic using this Ecommerce KPI Dashboard With P And L Statement Improving Financial Management Process. Dispense information and present a thorough explanation of Ecommerce, KPI Dashboard, P And L Statement using the slides given. This template can be altered and personalized to fit your needs. It is also available for immediate download. So grab it now.
-
 Getting From Reactive Service Kpis For Financial Service Delivery
This slide represents the KPIs for financial service delivery and how machine learning and AI can help to foresee the processes, insights that can benefit the financial sector. Present the topic in a bit more detail with this Getting From Reactive Service Kpis For Financial Service Delivery. Use it as a tool for discussion and navigation on Financial, Service, Problems. This template is free to edit as deemed fit for your organization. Therefore download it now.
-
 Financial Performance Indicator Dashboard Kpis To Assess Business Performance
This slide shows financial performance indicator dashboard covering net profit and net sales, profitability indicator ratios, cogs and net profit by region or channel. Present the topic in a bit more detail with this Financial Performance Indicator Dashboard Kpis To Assess Business Performance. Use it as a tool for discussion and navigation on Financial, Performance, Dashboard. This template is free to edit as deemed fit for your organization. Therefore download it now.
-
 Key Financials Of The Company Kpis To Assess Business Performance
Following slide provides financial details of company including revenue and operating profit. Revenue recorded in FY22 was dollar 518,932 while operating profit recorded was dollar 481,932. Deliver an outstanding presentation on the topic using this Key Financials Of The Company Kpis To Assess Business Performance. Dispense information and present a thorough explanation of Financials, Including Revenue, Operating using the slides given. This template can be altered and personalized to fit your needs. It is also available for immediate download. So grab it now.
-
 KPIS For Financial Service Delivery Optimize Service Delivery Ppt Demonstration
This slide represents the KPIs for financial service delivery and how machine learning and AI can help to foresee the processes, insights that can benefit the financial sector. Present the topic in a bit more detail with this KPIS For Financial Service Delivery Optimize Service Delivery Ppt Demonstration. Use it as a tool for discussion and navigation on Cash Conversion, Current Liabilities, Service Delivery. This template is free to edit as deemed fit for your organization. Therefore download it now.
-
 KPI Dashboard Snapshot To Measure 360 Degree Financial Strategy
This slide represents key performance indicator dashboard snapshot to analyse 360 degree financial strategy. It includes pie chart on revenue by product, summary and trends. Introducing our KPI Dashboard To Measure 360 Degree Financial Strategy set of slides. The topics discussed in these slides are Revenue Trend, Customer Information, Maintenance. This is an immediately available PowerPoint presentation that can be conveniently customized. Download it and convince your audience.
-
 KPIS For Financial Service Delivery Servicenow Performance Analytics
This slide represents the KPIs for financial service delivery and how machine learning and AI can help to foresee the processes, insights that can benefit the financial sector. Deliver an outstanding presentation on the topic using this KPIS For Financial Service Delivery Servicenow Performance Analytics. Dispense information and present a thorough explanation of KPIS For Financial, Service Delivery using the slides given. This template can be altered and personalized to fit your needs. It is also available for immediate download. So grab it now.
-
 IT Service Delivery Model KPIs For Financial Service Delivery Ppt Portrait
This slide represents the KPIs for financial service delivery and how machine learning and AI can help to foresee the processes, insights that can benefit the financial sector.Present the topic in a bit more detail with this IT Service Delivery Model KPIs For Financial Service Delivery Ppt Portrait. Use it as a tool for discussion and navigation on Underwriting Processes, Portfolio Composition, Current Liabilities. This template is free to edit as deemed fit for your organization. Therefore download it now.
-
 KPIS For Financial Service Delivery Proactive Customer Service Ppt Inspiration
This slide represents the KPIs for financial service delivery and how machine learning and AI can help to foresee the processes, insights that can benefit the financial sector. Present the topic in a bit more detail with this KPIS For Financial Service Delivery Proactive Customer Service Ppt Inspiration. Use it as a tool for discussion and navigation on Financial, Cash Conversion, Current Liabilities. This template is free to edit as deemed fit for your organization. Therefore download it now.
-
 Financial KPI Dashboard To Measure Brand Performance Brand Value Measurement Guide
Mentioned slide showcases KPI dashboard that can be used to check the financial performance of a brand. Metrics covered in the dashboard are return on assets, working capital ratio, return on equity etc. Present the topic in a bit more detail with this Financial KPI Dashboard To Measure Brand Performance Brand Value Measurement Guide. Use it as a tool for discussion and navigation on Return On Assets, Working Capital Ratio, Return On Equity. This template is free to edit as deemed fit for your organization. Therefore download it now.
-
 Financial Performance KPI Dashboard With Liquidity And Turnover Ratios
This slide shows dashboard financial performance KPIs. It covers quick ratios, current ratios, cash balance, days sales, inventory and payable outstanding. Presenting our well-structured Financial Performance KPI Dashboard With Liquidity And Turnover Ratios. The topics discussed in this slide are Sales Outstanding, Inventory Outstanding, Payable Outstanding. This is an instantly available PowerPoint presentation that can be edited conveniently. Download it right away and captivate your audience.
-
 Financial Performance KPI Dashboard With Working Capital And Cash Conversion Ratios
This slide shows dashboard of finance KPIs. It covers working capital, cash conversion cycle, vendor payment error rate, current assets and liabilities. Introducing our Financial Performance KPI Dashboard With Working Capital And Cash Conversion Ratios set of slides. The topics discussed in these slides are Current Assets, Current Working Capital, Current Liabilities. This is an immediately available PowerPoint presentation that can be conveniently customized. Download it and convince your audience.
-
 Return On Equity KPI To Measure Financial Performance
This slide showcases a graph of return on equity that represents how well the firm can manage the capital invested by shareholders. Introducing our Return On Equity KPI To Measure Financial Performance set of slides. The topics discussed in these slides are Return On Equity KPI, Measure Financial Performance. This is an immediately available PowerPoint presentation that can be conveniently customized. Download it and convince your audience.
-
 Project KPI Dashboard To Monitor Financial Budget Estimation
This slide signifies the project key performance indicator dashboard to evaluate financial budget estimation. It covers information regarding to allocated and used budget. Introducing our Project KPI Dashboard To Monitor Financial Budget Estimation set of slides. The topics discussed in these slides are Budget Across Portfolies, Estimated Cost Across Portfolies, Actual Cost Across Portfolios. This is an immediately available PowerPoint presentation that can be conveniently customized. Download it and convince your audience.


