Powerpoint Templates and Google slides for Financial Dashboard
Save Your Time and attract your audience with our fully editable PPT Templates and Slides.
-
 Financial Assets Management Kpi And Dashboard Powerpoint Presentation Slides
This complete deck focuses on Financial Assets Management Kpi And Dashboard Powerpoint Presentation Slides and consists of professionally designed templates with suitable graphics and appropriate content. This deck has a total of twenty-five slides. Our designers have created customizable templates for your convenience. You can make the required changes in the templates like color, text and font size. The presentation is fully supported by Google Slides. It can be easily converted into JPG or PDF format. When you download this presentation by clicking the download button, you get the presentation in both standard and widescreen formats.
-
 Financial Management Reporting Dashboard Powerpoint Ppt Template Bundles
Engage buyer personas and boost brand awareness by pitching yourself using this prefabricated set. This Financial Management Reporting Dashboard Powerpoint Ppt Template Bundles is a great tool to connect with your audience as it contains high-quality content and graphics. This helps in conveying your thoughts in a well-structured manner. It also helps you attain a competitive advantage because of its unique design and aesthetics. In addition to this, you can use this PPT design to portray information and educate your audience on various topics. With eleven slides, this is a great design to use for your upcoming presentations. Not only is it cost-effective but also easily pliable depending on your needs and requirements. As such color, font, or any other design component can be altered. It is also available for immediate download in different formats such as PNG, JPG, etc. So, without any further ado, download it now.
-
 Performance Business Financial Appreciating Dashboard Exhibiting
It covers all the important concepts and has relevant templates which cater to your business needs. This complete deck has PPT slides on Performance Business Financial Appreciating Dashboard Exhibiting with well suited graphics and subject driven content. This deck consists of total of twelve slides. All templates are completely editable for your convenience. You can change the colour, text and font size of these slides. You can add or delete the content as per your requirement. Get access to this professionally designed complete deck presentation by clicking the download button below.
-
 Financial loss dashboard analysis assessment roadmap product
Introduce your topic and host expert discussion sessions with this Financial Loss Dashboard Analysis Assessment Roadmap Product. This template is designed using high-quality visuals, images, graphics, etc, that can be used to showcase your expertise. Different topics can be tackled using the twelve slides included in this template. You can present each topic on a different slide to help your audience interpret the information more effectively. Apart from this, this PPT slideshow is available in two screen sizes, standard and widescreen making its delivery more impactful. This will not only help in presenting a birds-eye view of the topic but also keep your audience engaged. Since this PPT slideshow utilizes well-researched content, it induces strategic thinking and helps you convey your message in the best possible manner. The biggest feature of this design is that it comes with a host of editable features like color, font, background, etc. So, grab it now to deliver a unique presentation every time.
-
 Client Management Strategies Financial Dashboard Commercial Mitigation Identification
It has PPT slides covering wide range of topics showcasing all the core areas of your business needs. This complete deck focuses on Client Management Strategies Financial Dashboard Commercial Mitigation Identification and consists of professionally designed templates with suitable graphics and appropriate content. This deck has total of eleven slides. Our designers have created customizable templates for your convenience. You can make the required changes in the templates like colour, text and font size. Other than this, content can be added or deleted from the slide as per the requirement. Get access to this professionally designed complete deck PPT presentation by clicking the download button below.
-
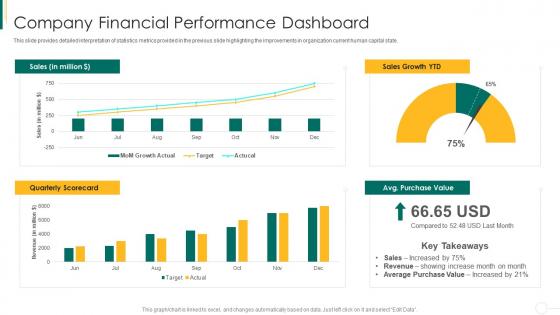 Action plan for enhancing team capabilities company financial performance dashboard
This slide provides detailed interpretation of statistics metrics provided in the previous slide highlighting the improvements in organization current human capital state. Deliver an outstanding presentation on the topic using this Action Plan For Enhancing Team Capabilities Company Financial Performance Dashboard. Dispense information and present a thorough explanation of Financial, Performance, Dashboard using the slides given. This template can be altered and personalized to fit your needs. It is also available for immediate download. So grab it now.
-
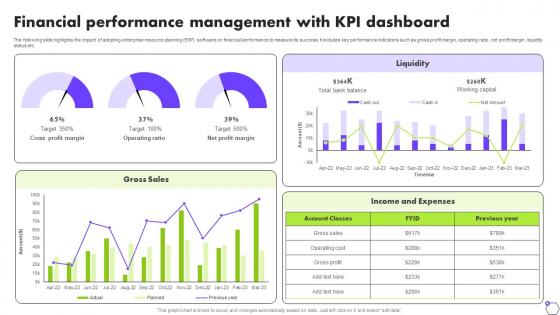 Financial Performance Management With KPI Dashboard Deploying ERP Software System Solutions
The following slide highlights the impact of adopting enterprise resource planning ERP software on financial performance to measure its success. It includes key performance indicators such as gross profit margin, operating ratio, net profit margin, liquidity status etc. Deliver an outstanding presentation on the topic using this Financial Performance Management With KPI Dashboard Deploying ERP Software System Solutions. Dispense information and present a thorough explanation of Gross Sales, Liquidity using the slides given. This template can be altered and personalized to fit your needs. It is also available for immediate download. So grab it now.
-
 Financial Kpi Report Dashboard For Investment Bank
This slide shows KPI dashboard to assist investor in analyzing financial report of investment bank. It includes current assets, current liabilities, cash conversion cycle, vendor payment system etc. Presenting our well structured Financial Kpi Report Dashboard For Investment Bank. The topics discussed in this slide are Financial, Dashboard, Investment Bank. This is an instantly available PowerPoint presentation that can be edited conveniently. Download it right away and captivate your audience.
-
 Profit And Loss Financial Dashboard For Investment Bank
Following slide exhibits investment bank dashboard used by investors to analyze important components of financial statements . it comprises of elements such gross profit margin, OPEX ratio, operating profit margins, net profit margin, revenue and COGS Presenting our well structured Profit And Loss Financial Dashboard For Investment Bank. The topics discussed in this slide are Financial, Dashboard, Investment Bank. This is an instantly available PowerPoint presentation that can be edited conveniently. Download it right away and captivate your audience.
-
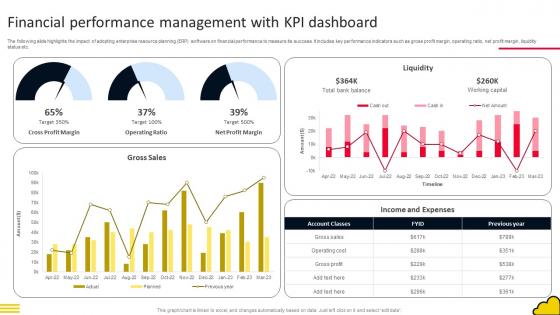 Adopting Cloud Based Financial Performance Management With Kpi Dashboard
Deliver an outstanding presentation on the topic using this Adopting Cloud Based Financial Performance Management With Kpi Dashboard Dispense information and present a thorough explanation of Cross Profit Margin, Operating Ratio, Net Profit Margin using the slides given. This template can be altered and personalized to fit your needs. It is also available for immediate download. So grab it now.
-
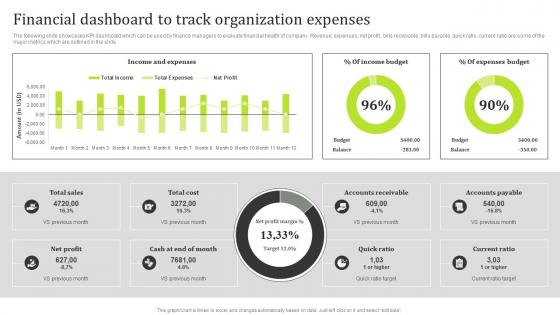 Financial Dashboard To Track Organization Expenses State Of The Information Technology Industry MKT SS V
The following slide showcases KPI dashboard which can be used by finance managers to evaluate financial health of company. Revenue, expenses, net profit, bills receivable, bills payable, quick ratio, current ratio are some of the major metrics which are outlined in the slide. Present the topic in a bit more detail with this Financial Dashboard To Track Organization Expenses State Of The Information Technology Industry MKT SS V. Use it as a tool for discussion and navigation on Income And Expenses, Income Budget. This template is free to edit as deemed fit for your organization. Therefore download it now.
-
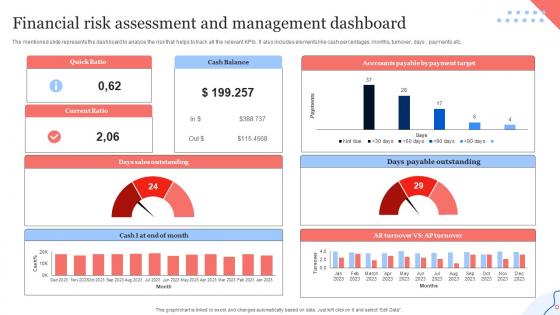 Financial Risk Assessment And Management Dashboard
The mentioned slide represents the dashboard to analyze the risk that helps to track all the relevant KPIs. It also includes elements like cash percentages, months, turnover, days, payments etc. Presenting our well structured Financial Risk Assessment And Management Dashboard. The topics discussed in this slide are Quick Ratio, Cash Balance, Sales Outstanding, Payable Outstanding. This is an instantly available PowerPoint presentation that can be edited conveniently. Download it right away and captivate your audience.
-
 Financial Performance Management With KPI Dashboard Estimating ERP System
The following slide highlights the impact of adopting enterprise resource planning ERP software on financial performance to measure its success. It includes key performance indicators such as gross profit margin, operating ratio, net profit margin, liquidity status etc. Deliver an outstanding presentation on the topic using this Financial Performance Management With KPI Dashboard Estimating ERP System. Dispense information and present a thorough explanation of Gross Sales, Liquidity, Financial, Performance Management using the slides given. This template can be altered and personalized to fit your needs. It is also available for immediate download. So grab it now.
-
 Financial Dashboard To Track Organization Information Technology Industry Forecast MKT SS V
The following slide showcases KPI dashboard which can be used by finance managers to evaluate financial health of company. Revenue, expenses, net profit, bills receivable, bills payable, quick ratio, current ratio are some of the major metrics which are outlined in the slide. Present the topic in a bit more detail with this Financial Dashboard To Track Organization Information Technology Industry Forecast MKT SS V. Use it as a tool for discussion and navigation on Financial, Organization, Expenses. This template is free to edit as deemed fit for your organization. Therefore download it now.
-
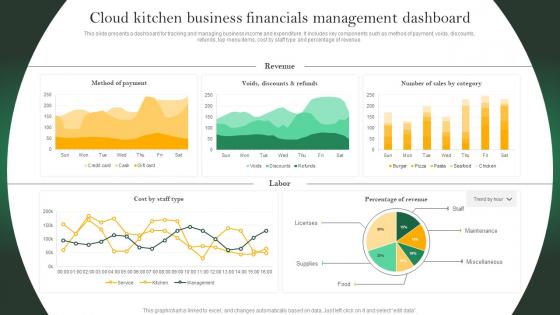 Analyzing Cloud Kitchen Service Cloud Kitchen Business Financials Management Dashboard
Present the topic in a bit more detail with this Analyzing Cloud Kitchen Service Cloud Kitchen Business Financials Management Dashboard Use it as a tool for discussion and navigation on Method Of Payment, Cost By Staff Type This template is free to edit as deemed fit for your organization. Therefore download it now.
-
 Financial Performance Management With KPI Dashboard Enhancing Business Operations
The following slide highlights the impact of adopting enterprise resource planning ERP software on financial performance to measure its success. It includes key performance indicators such as gross profit margin, operating ratio, net profit margin, liquidity status etc. Deliver an outstanding presentation on the topic using this Financial Performance Management With KPI Dashboard Enhancing Business Operations. Dispense information and present a thorough explanation of Gross Sales, Income And Expenses, Financial Performance using the slides given. This template can be altered and personalized to fit your needs. It is also available for immediate download. So grab it now.
-
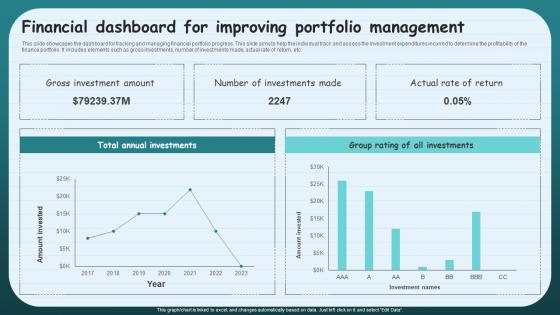 Financial Dashboard For Improving Portfolio Management
This slide showcases the dashboard for tracking and managing financial portfolio progress. This slide aims to help the individual track and assess the investment expenditures incurred to determine the profitability of the finance portfolio. It includes elements such as gross investments, number of investments made, actual rate of return, etc. Introducing our Financial Dashboard For Improving Portfolio Management set of slides. The topics discussed in these slides are Gross Investment Amount, Total Annual Investments. This is an immediately available PowerPoint presentation that can be conveniently customized. Download it and convince your audience.
-
 Financial Performance Appraisal KPI Dashboard
This slide includes the dashboard for performance appraisal of finance function to evaluate business financial position. This includes various parameters such as current ratio, quick ratio, cash flow ratio, etc. Presenting our well structured Financial Performance Appraisal KPI Dashboard. The topics discussed in this slide are Financial, Performance, Appraisal. This is an instantly available PowerPoint presentation that can be edited conveniently. Download it right away and captivate your audience.
-
 Quarterly Financial Performance Dashboard By Power BI
This slide highlights dashboard for evaluating financial performance using power bi tool. The purpose of this template is to provide managers with an efficient tool for comparing profit metrics across the quarters. It allows users to select different quarters and estimate sales of various products.Presenting our well structured Quarterly Financial Performance Dashboard By Power BI. The topics discussed in this slide are Target Performance, Profit Per Customer, James Furniture. This is an instantly available PowerPoint presentation that can be edited conveniently. Download it right away and captivate your audience.
-
 Real Estate Development Financial Dashboard Showing Revenue
This slide showcases a financial dashboard for real estate development businesses. The purpose of this template is to provide businesses with details regarding top performance areas and the total revenue generated. It includes elements such as property referrals, latest sales, etc. Presenting our well structured Real Estate Development Financial Dashboard Showing Revenue. The topics discussed in this slide are Properties For Sale, Properties For Rent.This is an instantly available PowerPoint presentation that can be edited conveniently. Download it right away and captivate your audience.
-
 Bizops Analytical Dashboard For Evaluating Financial Performance
This slide represents KPI dashboard for bizops monitoring and tracking of different business operations and ongoing processes. It includes metrics such as current monthly leads, estimated billed, current monthly projects, etc. Introducing our Bizops Analytical Dashboard For Evaluating Financial Performance set of slides. The topics discussed in these slides are Current Monthly Leads, Current Monthly Projects. This is an immediately available PowerPoint presentation that can be conveniently customized. Download it and convince your audience.
-
 Building Financial Process Dashboard For Analyzing Cashflow
This slide highlights financial process dashboard for providing companys financial health status and outperforming financial objectives. It includes metrics such as current ratio, working capital ratio, liquid assets, closing month cash, etc. Presenting our well structured Building Financial Process Dashboard For Analyzing Cashflow. The topics discussed in this slide are Closing Month Cash, Accounts Payable Turnover.This is an instantly available PowerPoint presentation that can be edited conveniently. Download it right away and captivate your audience.
-
 Financial Metrics Data Driven Dashboard For Data Analysis
This slide highlights data driven dashboard for tracking, analyzing and displaying KPIs and metrics. It includes financial KPIs such as current fixed capital, cash flow cycle, supplier payment error rate, etc. Introducing our Financial Metrics Data Driven Dashboard For Data Analysis set of slides. The topics discussed in these slides are Quick Assets, Current Fixed Capital. This is an immediately available PowerPoint presentation that can be conveniently customized. Download it and convince your audience.
-
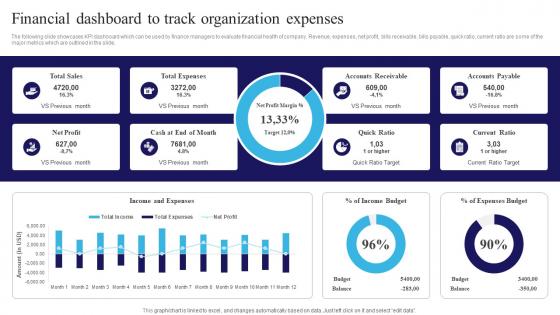 Financial Dashboard To Track Organization Expenses Navigating The Information Technology Landscape MKT SS V
The following slide showcases KPI dashboard which can be used by finance managers to evaluate financial health of company. Revenue, expenses, net profit, bills receivable, bills payable, quick ratio, current ratio are some of the major metrics which are outlined in the slide. Deliver an outstanding presentation on the topic using this Financial Dashboard To Track Organization Expenses Navigating The Information Technology Landscape MKT SS V. Dispense information and present a thorough explanation of Income Budget, Expenses Budget using the slides given. This template can be altered and personalized to fit your needs. It is also available for immediate download. So grab it now.
-
 Agile Financial Analytics Kpi Dashboard
This slide showcases financial analytics KPI dashboard. This slide aims to provide in depth insights into company financial status to add value to the company. It helps in improving financial performance through proper information about the expenses and revenue of the organization. Presenting our well structured Agile Financial Analytics Kpi Dashboard. The topics discussed in this slide are Current Ratio Mom Trend, Dimension Breakdown.This is an instantly available PowerPoint presentation that can be edited conveniently. Download it right away and captivate your audience.
-
 Defining ERP Software Financial Performance Management With KPI Dashboard
The following slide highlights the impact of adopting enterprise resource planning ERP software on financial performance to measure its success. It includes key performance indicators such as gross profit margin, operating ratio, net profit margin, liquidity status etc. Deliver an outstanding presentation on the topic using this Defining ERP Software Financial Performance Management With KPI Dashboard. Dispense information and present a thorough explanation of Financial Performance, Management With KPI Dashboard, Gross Sales using the slides given. This template can be altered and personalized to fit your needs. It is also available for immediate download. So grab it now.
-
 Financial Report Dashboard For Assessing Business Profits
This slide showcases the financial report dashboard for evaluating business profits of a firm. The purpose of this slide is to depict the financial performance of firm through the analysis of various indicators such as total profit margin, OPEX ratio, Net profit margin, etc. Introducing our Financial Report Dashboard For Assessing Business Profits set of slides. The topics discussed in these slides are Financial, Dashboard, Business. This is an immediately available PowerPoint presentation that can be conveniently customized. Download it and convince your audience.
-
 Small Business Financial Report Dashboard
This slide highlights the financial report dashboard for a small business firm. The purpose of this slide is to depict the financial performance of a small business firm through the analysis of various indicators such as current ratio, month-end cash reserves, outstanding daily payables, etc. Presenting our well structured Small Business Financial Report Dashboard. The topics discussed in this slide are Business, Financial, Dashboard. This is an instantly available PowerPoint presentation that can be edited conveniently. Download it right away and captivate your audience.
-
 Business Financial Savings KPI Dashboard To Evaluate Cash Performance
This slide showcases evaluating cash performance with business financial savings KPI dashboard. This slide includes savings, income and expenses vs their last year money and weekly savings per day for company. Introducing our Business Financial Savings KPI Dashboard To Evaluate Cash Performance set of slides. The topics discussed in these slides are Weekly Savings, Savings. This is an immediately available PowerPoint presentation that can be conveniently customized. Download it and convince your audience.
-
 KPI Dashboard For Company Financial Audit
The below slide provides a financial audit dashboard for a company that help to understand the inventory and sales transactions. It mentions quick ration, cash balance, days sales outstanding, days payable outstanding, etc. Introducing our KPI Dashboard For Company Financial Audit set of slides. The topics discussed in these slides are Days Sales Outstanding, Days Inventory Outstanding, Days Payable Outstanding. This is an immediately available PowerPoint presentation that can be conveniently customized. Download it and convince your audience.
-
 Financial Dashboard Tracking Cashflow Through IoT
This slide highlights dashboard for assessing financial transactions through IOT. The main purpose of this template is to monitor cash in-flow and out-flow. This includes total amount, amount paid, equity finance, etc. Introducing our Financial Dashboard Tracking Cashflow Through IoT set of slides. The topics discussed in these slides are Profit And Loss Summary. This is an immediately available PowerPoint presentation that can be conveniently customized. Download it and convince your audience.
-
 Navigating The Banking Industry Dashboard Showcasing Executive Financial Expenses Of Banks
This slide showcases different KPIs related to banking. This template focuses on giving executives a holistic overview of enterprise and ts performance. It includes information related to expense trend, profits by branch, revenue, etc. Deliver an outstanding presentation on the topic using this Navigating The Banking Industry Dashboard Showcasing Executive Financial Expenses Of Banks. Dispense information and present a thorough explanation of Dashboard, Executive Financial Expenses, Branches By Revenue using the slides given. This template can be altered and personalized to fit your needs. It is also available for immediate download. So grab it now.
-
 Dashboard To Depict Current Cash Flow Position Mastering Financial Planning In Modern Business Fin SS
This slide provides a dedicated dashboard for monitoring the organizations cash flow position. It offers a real-time view of cash flow status. Key performance metrics covered in the dashboard relate to cash in hand profit or loss cash flow etc. Deliver an outstanding presentation on the topic using this Dashboard To Depict Current Cash Flow Position Mastering Financial Planning In Modern Business Fin SS. Dispense information and present a thorough explanation of Accounts Payable Accounts Receivable Cash Flow using the slides given. This template can be altered and personalized to fit your needs. It is also available for immediate download. So grab it now.
-
 Non Profit Organization Financial Analysis Dashboard
This slide represents non profit organization financial analysis dashboard which assists to get full insights into important financial metrics such as bank accounts, sales and cash flow. It includes key components such as total income, total expenses, etc. Introducing our Non Profit Organization Financial Analysis Dashboard set of slides. The topics discussed in these slides are Invoices By Customers, Expenses By Vendor, Bank And Credit Card, Total Income. This is an immediately available PowerPoint presentation that can be conveniently customized. Download it and convince your audience.
-
 Non Profit Organization KPI Dashboard For Analyzing Financial Health
This slide represents non profit organization KPI dashboard for analyzing financial health which assists to focus in financial health of non profit organizations. It includes key components such as total donation, total donor, etc . Introducing our Non Profit Organization KPI Dashboard For Analyzing Financial Health set of slides. The topics discussed in these slides are Total Donation, Total Donor, One-Time Amount, Recurring Amount. This is an immediately available PowerPoint presentation that can be conveniently customized. Download it and convince your audience.
-
 Financial Industry Dashboard Representing Cash Management
This slide showcases the effective financial industry dashboard illustrating cash management which helps an organization to track industrial expenses efficiently. It include details such as cash quick, current ration, outstanding days payable, accounts receivable turnover, etc. Introducing our Financial Industry Dashboard Representing Cash Management set of slides. The topics discussed in these slides are Cash Inflow, Cash Outflow, Payment Target.This is an immediately available PowerPoint presentation that can be conveniently customized. Download it and convince your audience.
-
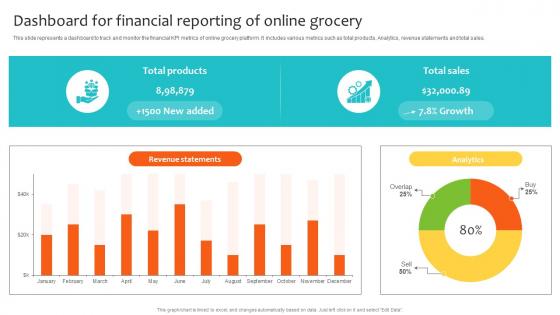 Dashboard For Financial Reporting Of Online Grocery Navigating Landscape Of Online Grocery Shopping
The purpose of the following slide is to delve into the changing behaviors and preferences of consumers in the context of online grocery shopping. It includes various trends such as online shopping is permanent, fresh and Increased demand for fresh and frozen categories, shift in e-commerce modality etc. Introducing Consumer Trends Evolving Online Grocery Market Navigating Landscape Of Online Grocery Shopping to increase your presentation threshold. Encompassed with five stages, this template is a great option to educate and entice your audience. Dispence information on Online Shopping, Frozen Categories, E Commerce Modality, using this template. Grab it now to reap its full benefits.
-
 Digital Marketing Techniques Kpi Dashboard To Determine Financial Performance Strategy SS V
This slide provides an overview of the dashboard that helps to determine the companys financial position. The dashboard includes return on assets, equity, debt-equity ratio, share price, PE ratio and working capital. Deliver an outstanding presentation on the topic using this Digital Marketing Techniques Kpi Dashboard To Determine Financial Performance Strategy SS V Dispense information and present a thorough explanation of Return On Assets, Return On Equity, Working Capital Ratio using the slides given. This template can be altered and personalized to fit your needs. It is also available for immediate download. So grab it now.
-
 Annual Financial Performance Report Dashboard
This slide represents annual financial performance report which includes key components such as revenue, costs, net profit, etc Introducing our Annual Financial Performance Report Dashboard set of slides. The topics discussed in these slides are Revenue, Costs, Net Profit. This is an immediately available PowerPoint presentation that can be conveniently customized. Download it and convince your audience.
-
 E Commerce Financial Fraud Transactions Dashboard
This slide illustrates e commerce fraud KPI or dashboard and includes defrauded amounts, fraudulent transactions, fraudulent customers, etc. Introducing our E Commerce Financial Fraud Transactions Dashboard set of slides. The topics discussed in these slides are Defrauded Amount, Fraudulent Transactions, Region And Field. This is an immediately available PowerPoint presentation that can be conveniently customized. Download it and convince your audience.
-
 Financial Analysis Dashboard Prepared By Performance Review Tool
This slide depicts various KPIs used for analyzing the financial performance of a company. It includes elements such as return on assets, working capital ratio, etc. Introducing our Financial Analysis Dashboard Prepared By Performance Review Tool set of slides. The topics discussed in these slides are Return On Assets, Working Capital Ratio, Balance Sheet. This is an immediately available PowerPoint presentation that can be conveniently customized. Download it and convince your audience.
-
 Company Profit And Loss Dashboard With The Ultimate Guide To Corporate Financial Distress
This slide provides a KPI dashboard that enables an organization to track revenue, expenses, and profit incurred in a specific period. It includes gross profit margin, OPEX ratio, operating profit margin, and net profit margin. Deliver an outstanding presentation on the topic using this Company Profit And Loss Dashboard With The Ultimate Guide To Corporate Financial Distress. Dispense information and present a thorough explanation of Operating Profit Margin, Net Profit Margin, Gross Profit Margin using the slides given. This template can be altered and personalized to fit your needs. It is also available for immediate download. So grab it now.
-
 KPI Dashboard Showcasing Organisation Financial The Ultimate Guide To Corporate Financial Distress
This slide showcases financial management dashboard that enables organizations to track and analyze the capital structure. It includes return on assets, return on equity, working capital ratio, debt-equity ratio, and return on equity. Present the topic in a bit more detail with this KPI Dashboard Showcasing Organisation Financial The Ultimate Guide To Corporate Financial Distress. Use it as a tool for discussion and navigation on Debit Equity Ratio, Working Capital Ratio, Return On Assets. This template is free to edit as deemed fit for your organization. Therefore download it now.
-
 Financial planning and reporting KPI dashboard
This slide represents a dashboard highlighting the report prepared by the financial planning team. It includes net product revenue, gross margin, cost of goods sold etc. Introducing our Financial planning and reporting KPI dashboard set of slides. The topics discussed in these slides are Net Product Revenue, Quarter Analysis, Gross Margin. This is an immediately available PowerPoint presentation that can be conveniently customized. Download it and convince your audience.
-
 KPI Marketing Dashboard For Insurance Financial Services Enterprise
Following slide highlights insurance financial service enterprise KPI marketing dashboard for networking opportunities. It further covers quoted vs actual data, campaign revenue analysis, product line campaign chart, etc. Introducing our KPI Marketing Dashboard For Insurance Financial Services Enterprise set of slides. The topics discussed in these slides are KPI Marketing Dashboard, Insurance Financial, Services Enterprise.This is an immediately available PowerPoint presentation that can be conveniently customized. Download it and convince your audience.
-
 KPI Marketing Plan Performance Dashboard For Financial Services Enterprise
Following slide represents financial services enterprise KPI marketing plan dashboard for lead generation status. It further covers new visitors, unique visitors, bounce rate, average time on site, etc. Presenting our well structured KPI Marketing Plan Performance Dashboard For Financial Services Enterprise. The topics discussed in this slide are New Visitors, Unique Visitor, Bounce Rate. This is an instantly available PowerPoint presentation that can be edited conveniently. Download it right away and captivate your audience.
-
 Analyzing Financial Strength With Cash Flow Dashboard
This slide highlights the Financial Strength Dashboards role in offering real-time insights for informed decision-making, optimizing performance, and ensuring financial sustainability in a manufacturing company. Presenting our well structured Analyzing Financial Strength With Cash Flow Dashboard. The topics discussed in this slide are Analyzing Financial Strength, Cash Flow Dashboard, Financial Sustainability. This is an instantly available PowerPoint presentation that can be edited conveniently. Download it right away and captivate your audience.
-
 KPI Dashboard For Effective Financial Asset Implementing Financial Asset Management Strategy
This slide covers dashboard to analyze financial asset information effectively. It involves details such as total assets, total revenue generated and sales. Present the topic in a bit more detail with this KPI Dashboard For Effective Financial Asset Implementing Financial Asset Management Strategy. Use it as a tool for discussion and navigation on Asset Under Management, Revenue, Sales. This template is free to edit as deemed fit for your organization. Therefore download it now.
-
 KPI Dashboard To Assess Portfolio Investment Implementing Financial Asset Management Strategy
This slide covers KPI dashboard to track return on portfolio investment. It involves KPIs such as total invested amount, total investment, rate of return and total investments on yearly basis. Deliver an outstanding presentation on the topic using this KPI Dashboard To Assess Portfolio Investment Implementing Financial Asset Management Strategy. Dispense information and present a thorough explanation of Total Invested Amount, Total Investments, Rate Of Return using the slides given. This template can be altered and personalized to fit your needs. It is also available for immediate download. So grab it now.
-
 Financial Services KPI Dashboard For Analyzing Transactions
This slide highlights KPI dashboard for banking sector. The purpose of this template is to help bank employees and customers in easy decision-making using visualized financial data. It includes elements such as revenue by branch, profit by branch, etc. Introducing our Financial Services KPI Dashboard For Analyzing Transactions set of slides. The topics discussed in these slides are Revenue By Branch, Expenses By Branch, Profit By Branch. This is an immediately available PowerPoint presentation that can be conveniently customized. Download it and convince your audience.
-
 Financial Planning Analytical Dashboard With Revenue Variance
This slide shows the dashboard representing financial planning of an organization. It highlights the set revenue targets and actual revenue with the help of graphs. Presenting our well structured Financial Planning Analytical Dashboard With Revenue Variance. The topics discussed in this slide are Revenue Detail, Revenue Variance, Revenue Delta. This is an instantly available PowerPoint presentation that can be edited conveniently. Download it right away and captivate your audience.
-
 SaaS Dashboard For Estimating Financial Health
This slide highlights SaaS dashboard for measuring financial stability. The purpose of this template is to help professionals in employing informed financial management and strategic planning for business. It includes elements such as MRR, m or m growth, runway, etc. Introducing our SaaS Dashboard For Estimating Financial Health set of slides. The topics discussed in these slides are Customers And Signups, SaaS Dashboard, Estimating Financial Health. This is an immediately available PowerPoint presentation that can be conveniently customized. Download it and convince your audience.
-
 Business Financial Projection Dashboard Analysis
The purpose of this slide is to showcase financial projection dashboard analysis, which helps in empowering informed decision making and agile responses to market dynamics. Presenting our well structured Business Financial Projection Dashboard Analysis The topics discussed in this slide are Revneue Expenses, Cash Balance, Net Income This is an instantly available PowerPoint presentation that can be edited conveniently. Download it right away and captivate your audience.
-
 Financial Operations Reporting Dashboard For Manufacturing Firm
This slide showcases the dashboard to track operational functioning of a manufacturing firm. The purpose of this slide is to help the business track metrics such as weekly production volume, operational machines, etc., in order to determine overall business efficiency. Introducing our Financial Operations Reporting Dashboard For Manufacturing Firm set of slides. The topics discussed in these slides are Top 5 Performing Products, Distribution Downtime Factors, Production Volume. This is an immediately available PowerPoint presentation that can be conveniently customized. Download it and convince your audience.
-
 Dashboard To Track Business Financial Performance Complete Guide To Business Analytics Data Analytics SS
This slide showcases dashboard illustrating company financial performance which helps in analyzing revenue growth and identifying gaps. It provide information regarding KPIs such as gross profit margin, opex ratio, earning before interest and taxes, vendor payment error rate etc. Present the topic in a bit more detail with this Dashboard To Track Business Financial Performance Complete Guide To Business Analytics Data Analytics SS. Use it as a tool for discussion and navigation on Dashboard To Track Business, Financial Performance, Post Strategy Implementation. This template is free to edit as deemed fit for your organization. Therefore download it now.
-
 Trade Promotion Practices To Increase Kpi Dashboard To Determine Financial Performance Strategy SS V
This slide provides an overview of the dashboard that helps to determine the company financial position. The dashboard includes return on assets, equity, debt-equity ratio, share price, P or E ratio and working capital. Present the topic in a bit more detail with this Trade Promotion Practices To Increase Kpi Dashboard To Determine Financial Performance Strategy SS V. Use it as a tool for discussion and navigation on KPI Dashboard, Financial Performance, Debt Equity Ratio, Working Capital. This template is free to edit as deemed fit for your organization. Therefore download it now.
-
 Merchant Web Onboarding Dashboard For Financial Institutions
This slide represents dashboard to track merchant web onboarding status which includes elements such ad approved cases, sent for e-sign, under review, etc. Presenting our well structured Merchant Web Onboarding Dashboard For Financial Institutions. The topics discussed in this slide are Merchant Volume, Business, Application Status. This is an instantly available PowerPoint presentation that can be edited conveniently. Download it right away and captivate your audience.
-
 KPI Dashboard To Determine Financial Trade Promotion To Increase Brand Strategy SS V
This slide provides an overview of the dashboard that helps to determine the companys financial position. The dashboard includes return on assets, equity, debt-equity ratio, share price, PE ratio and working capital. Deliver an outstanding presentation on the topic using this KPI Dashboard To Determine Financial Trade Promotion To Increase Brand Strategy SS V. Dispense information and present a thorough explanation of Working Capital Ratio, Debt-Equity Ratio, Return On Equity using the slides given. This template can be altered and personalized to fit your needs. It is also available for immediate download. So grab it now.
-
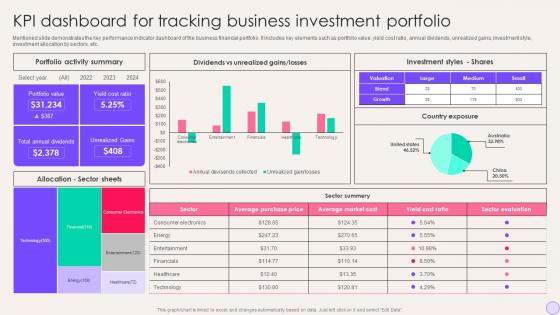 Kpi Dashboard For Tracking Business Investment Portfolio Financial Portfolio Expansion
Mentioned slide demonstrates the key performance indicator dashboard of the business financial portfolio. It includes key elements such as portfolio value, yield cost ratio, annual dividends, unrealized gains, investment style, investment allocation by sectors, etc. Deliver an outstanding presentation on the topic using this Kpi Dashboard For Tracking Business Investment Portfolio Financial Portfolio Expansion Dispense information and present a thorough explanation of Portfolio Activity Summary, Investment Styles Shares using the slides given. This template can be altered and personalized to fit your needs. It is also available for immediate download. So grab it now.
-
 Financial Performance Dashboard For International Business Strategies For Exponential
This slide presents financial performance dashboard for international business monitoring and funds management. It includes metrics such as return on assets, working capital ratio, return on equity and debt equity ratio. Present the topic in a bit more detail with this Financial Performance Dashboard For International Business Strategies For Exponential. Use it as a tool for discussion and navigation on Return On Equity, Return On Assets, Working Capital Ratio. This template is free to edit as deemed fit for your organization. Therefore download it now.


