Powerpoint Templates and Google slides for Financial Analytics
Save Your Time and attract your audience with our fully editable PPT Templates and Slides.
-
 Data Types Analytics Business Programming Financial Government Statistics
Engage buyer personas and boost brand awareness by pitching yourself using this prefabricated set. This Data Types Analytics Business Programming Financial Government Statistics is a great tool to connect with your audience as it contains high-quality content and graphics. This helps in conveying your thoughts in a well-structured manner. It also helps you attain a competitive advantage because of its unique design and aesthetics. In addition to this, you can use this PPT design to portray information and educate your audience on various topics. With twelve slides, this is a great design to use for your upcoming presentations. Not only is it cost-effective but also easily pliable depending on your needs and requirements. As such color, font, or any other design component can be altered. It is also available for immediate download in different formats such as PNG, JPG, etc. So, without any further ado, download it now.
-
 8 Column Table Analytics Software Financial Operational Performance Comparison
If you require a professional template with great design, then this 8 Column Table Analytics Software Financial Operational Performance Comparison is an ideal fit for you. Deploy it to enthrall your audience and increase your presentation threshold with the right graphics, images, and structure. Portray your ideas and vision using twelve slides included in this complete deck. This template is suitable for expert discussion meetings presenting your views on the topic. With a variety of slides having the same thematic representation, this template can be regarded as a complete package. It employs some of the best design practices, so everything is well-structured. Not only this, it responds to all your needs and requirements by quickly adapting itself to the changes you make. This PPT slideshow is available for immediate download in PNG, JPG, and PDF formats, further enhancing its usability. Grab it by clicking the download button.
-
 Data Analytics Organization Environment Representing Financial Information
Engage buyer personas and boost brand awareness by pitching yourself using this prefabricated set. This Data Analytics Organization Environment Representing Financial Information is a great tool to connect with your audience as it contains high-quality content and graphics. This helps in conveying your thoughts in a well-structured manner. It also helps you attain a competitive advantage because of its unique design and aesthetics. In addition to this, you can use this PPT design to portray information and educate your audience on various topics. With twelve slides, this is a great design to use for your upcoming presentations. Not only is it cost-effective but also easily pliable depending on your needs and requirements. As such color, font, or any other design component can be altered. It is also available for immediate download in different formats such as PNG, JPG, etc. So, without any further ado, download it now.
-
 Bizops Analytical Dashboard For Evaluating Financial Performance
This slide represents KPI dashboard for bizops monitoring and tracking of different business operations and ongoing processes. It includes metrics such as current monthly leads, estimated billed, current monthly projects, etc. Introducing our Bizops Analytical Dashboard For Evaluating Financial Performance set of slides. The topics discussed in these slides are Current Monthly Leads, Current Monthly Projects. This is an immediately available PowerPoint presentation that can be conveniently customized. Download it and convince your audience.
-
 Agile Financial Analytics Kpi Dashboard
This slide showcases financial analytics KPI dashboard. This slide aims to provide in depth insights into company financial status to add value to the company. It helps in improving financial performance through proper information about the expenses and revenue of the organization. Presenting our well structured Agile Financial Analytics Kpi Dashboard. The topics discussed in this slide are Current Ratio Mom Trend, Dimension Breakdown.This is an instantly available PowerPoint presentation that can be edited conveniently. Download it right away and captivate your audience.
-
 Financial Projections Mobile Analytics App Investor Funding Elevator Pitch Deck
This slide showcases forecasted growth of company that will assist investors to determine future potential of business and make investment decision that will be most profitable for them. Deliver an outstanding presentation on the topic using this Financial Projections Mobile Analytics App Investor Funding Elevator Pitch Deck. Dispense information and present a thorough explanation of Expected, Projections, Financial using the slides given. This template can be altered and personalized to fit your needs. It is also available for immediate download. So grab it now.
-
 Financial Projection Product Analytics Platform Offering Company Investor Funding Elevator Pitch Deck
This slide shows details regarding the revenue generated by the organization in each quarter in last three years which will help investors in making investment decision about whether to invest in the company or not. Deliver an outstanding presentation on the topic using this Financial Projection Product Analytics Platform Offering Company Investor Funding Elevator Pitch Deck Dispense information and present a thorough explanation of Continuous Revenue, Growth Of Company using the slides given. This template can be altered and personalized to fit your needs. It is also available for immediate download. So grab it now.
-
 Financial Planning Analytical Dashboard With Revenue Variance
This slide shows the dashboard representing financial planning of an organization. It highlights the set revenue targets and actual revenue with the help of graphs. Presenting our well structured Financial Planning Analytical Dashboard With Revenue Variance. The topics discussed in this slide are Revenue Detail, Revenue Variance, Revenue Delta. This is an instantly available PowerPoint presentation that can be edited conveniently. Download it right away and captivate your audience.
-
 Dashboard To Track Business Financial Performance Complete Guide To Business Analytics Data Analytics SS
This slide showcases dashboard illustrating company financial performance which helps in analyzing revenue growth and identifying gaps. It provide information regarding KPIs such as gross profit margin, opex ratio, earning before interest and taxes, vendor payment error rate etc. Present the topic in a bit more detail with this Dashboard To Track Business Financial Performance Complete Guide To Business Analytics Data Analytics SS. Use it as a tool for discussion and navigation on Dashboard To Track Business, Financial Performance, Post Strategy Implementation. This template is free to edit as deemed fit for your organization. Therefore download it now.
-
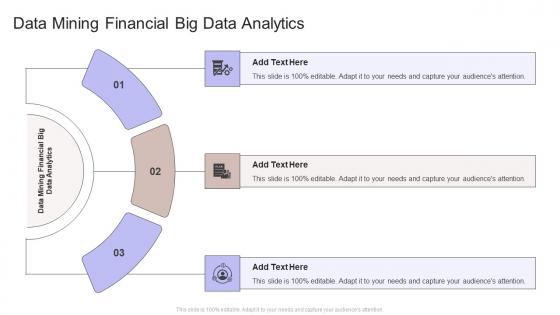 Data Mining Financial Big Data Analytics In Powerpoint And Google Slides Cpb
Presenting Data Mining Financial Big Data Analytics In Powerpoint And Google Slides Cpb slide which is completely adaptable. The graphics in this PowerPoint slide showcase three stages that will help you succinctly convey the information. In addition, you can alternate the color, font size, font type, and shapes of this PPT layout according to your content. This PPT presentation can be accessed with Google Slides and is available in both standard screen and widescreen aspect ratios. It is also a useful set to elucidate topics like Data Mining, Financial Big, Data Analytics. This well-structured design can be downloaded in different formats like PDF, JPG, and PNG. So, without any delay, click on the download button now.
-
 Financial Services Analytics Cases In Powerpoint And Google Slides Cpb
Presenting Financial Services Analytics Cases In Powerpoint And Google Slides Cpb slide which is completely adaptable. The graphics in this PowerPoint slide showcase four stages that will help you succinctly convey the information. In addition, you can alternate the color, font size, font type, and shapes of this PPT layout according to your content. This PPT presentation can be accessed with Google Slides and is available in both standard screen and widescreen aspect ratios. It is also a useful set to elucidate topics like Financial Services Analytics Cases. This well structured design can be downloaded in different formats like PDF, JPG, and PNG. So, without any delay, click on the download button now.
-
 Financial Transformation Through Data Analytics
This slide showcases the transformation through data analytics in finance sector which helps an organization to provide teams with real time insights and increase their productivity. It include details such as prioritize high value tasks, ensure making reliable decisions, etc. Presenting our set of slides with Financial Transformation Through Data Analytics. This exhibits information on Three stages of the process. This is an easy to edit and innovatively designed PowerPoint template. So download immediately and highlight information on High Value Tasks, Resource Allocation, Making Reliable Decisions.
-
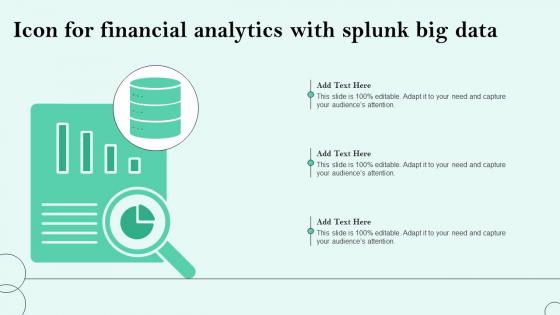 Icon For Financial Analytics With Splunk Big Data
Presenting our set of slides with Icon For Financial Analytics With Splunk Big Data This exhibits information on three stages of the process. This is an easy to edit and innovatively designed PowerPoint template. So download immediately and highlight information on Financial Analytics, Splunk Big Data.
-
 Client Data Insights And Analytics In Banking And Financial Sector
This slide shows various uses of customer analytics in the banking sector to frame marketing strategies and choose suitable channels. It includes uses such as improving customer experience, customer insights and managing customer experience, etc.Presenting our set of slides with Client Data Insights And Analytics In Banking And Financial Sector. This exhibits information on four stages of the process. This is an easy to edit and innovatively designed PowerPoint template. So download immediately and highlight information on Customer Acquisition, Customer Experience, Marketing Strategies.
-
 Financial Product Analytics In Powerpoint And Google Slides Cpb
Presenting Financial Product Analytics In Powerpoint And Google Slides Cpb slide which is completely adaptable. The graphics in this PowerPoint slide showcase three stages that will help you succinctly convey the information. In addition, you can alternate the color, font size, font type, and shapes of this PPT layout according to your content. This PPT presentation can be accessed with Google Slides and is available in both standard screen and widescreen aspect ratios. It is also a useful set to elucidate topics like Financial Product Analytics. This well-structured design can be downloaded in different formats like PDF, JPG, and PNG. So, without any delay, click on the download button now.
-
 Company Financial Data Growth Analytics Graph
Presenting our set of slides with Company Financial Data Growth Analytics Graph. This exhibits information on three stages of the process. This is an easy to edit and innovatively designed PowerPoint template. So download immediately and highlight information on Company Financial, Data Growth, Analytics Graph.
-
 Financial Performance Mobile Analytics App Investor Funding Elevator Pitch Deck
This slide showcases financial performance of business which assist investors to gain insights of business growth and development to make strategic investment decisions. Present the topic in a bit more detail with this Financial Performance Mobile Analytics App Investor Funding Elevator Pitch Deck. Use it as a tool for discussion and navigation on Revenue, Customer, Performance. This template is free to edit as deemed fit for your organization. Therefore download it now.
-
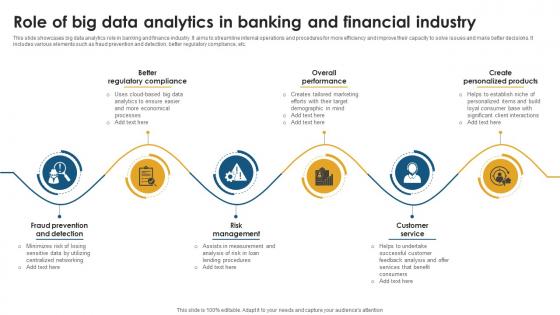 Role Of Big Data Analytics In Banking And Financial Industry
This slide showcases big data analytics role in banking and finance industry. It aims to streamline internal operations and procedures for more efficiency and improve their capacity to solve issues and make better decisions. It includes various elements such as fraud prevention and detection, better regulatory compliance, etc. Introducing our premium set of slides with Role Of Big Data Analytics In Banking And Financial Industry. Ellicudate the six stages and present information using this PPT slide. This is a completely adaptable PowerPoint template design that can be used to interpret topics like Better Regulatory Compliance, Overall Performance, Create Personalized Products. So download instantly and tailor it with your information.
-
 Financial Performance Product Analytics Platform Offering Company Investor Funding Elevator Pitch Deck
This slide shows information about the exit strategy for investors which can be used to take exit from the company. It includes initial public offer, private offerings and other strategies. Present the topic in a bit more detail with this Financial Performance Product Analytics Platform Offering Company Investor Funding Elevator Pitch Deck Use it as a tool for discussion and navigation on Initial Public Offering, Private Offering This template is free to edit as deemed fit for your organization. Therefore download it now.
-
 Financial Performance Analytics Colored Icon In Powerpoint Pptx Png And Editable Eps Format
Enhance your financial presentations with our vibrant PowerPoint icon, designed to represent improved financial performance. Featuring a bold color scheme and professional design, this icon is perfect for showcasing your companys success and growth. Elevate your presentations and impress your audience with our eye catching icon.
-
 Financial Performance Analytics Monotone Icon In Powerpoint Pptx Png And Editable Eps Format
This Monotone powerpoint icon is designed to help businesses improve their financial performance. With a sleek and modern design, this icon is perfect for presentations and reports related to financial strategies, budgeting, and revenue growth. Enhance your presentations with this powerful and professional icon.
-
 Data Analytics And AI Capabilities For Effective Implementing Financial Asset Management Strategy
This slide covers how data analytics and artificial intelligence capabilities helps in managing financial assets effectively. It involves key features such as risk assessment, performance attribution and portfolio optimization. Increase audience engagement and knowledge by dispensing information using Data Analytics And AI Capabilities For Effective Implementing Financial Asset Management Strategy. This template helps you present information on three stages. You can also present information on Risk Assessment And Management, Performance Attribution, Portfolio Optimization using this PPT design. This layout is completely editable so personaize it now to meet your audiences expectations.
-
 Comparison Of Financial Analytics Tools Used To Measure Complete Guide To Business Analytics Data Analytics SS
This slide showcases comparative assessment between various financial analytics software which helps in effective data reporting and visualization. It provides information regarding software, features, price, free trial and user ratings. Present the topic in a bit more detail with this Comparison Of Financial Analytics Tools Used To Measure Complete Guide To Business Analytics Data Analytics SS. Use it as a tool for discussion and navigation on Comparison Of Financial Analytics Tools, Business Growth, Effective Financial Reporting. This template is free to edit as deemed fit for your organization. Therefore download it now.
-
 Financial Data Analytics Icon Showing Industrial Growth
Introducing our premium set of slides with Financial Data Analytics Icon Showing Industrial Growth Ellicudate the three stages and present information using this PPT slide. This is a completely adaptable PowerPoint template design that can be used to interpret topics like Financial Data Analytics Icon, Showing Industrial Growth So download instantly and tailor it with your information.
-
 Daily Financial Analytics Reporting Icon
Introducing our premium set of slides with name Daily Financial Analytics Reporting Icon. Ellicudate the four stages and present information using this PPT slide. This is a completely adaptable PowerPoint template design that can be used to interpret topics like Daily Financial Analytics, Reporting. So download instantly and tailor it with your information.
-
 Financial Risk Emergency And Crisis Management With Software Analytics
This slide provides the scoring parameters and solutions for credit risk management in banking and finance using AI tools that helps to prevent business losses. The various parameters evaluated are range, factors responsible, etc. Introducing our Financial Risk Emergency And Crisis Management With Software Analytics set of slides. The topics discussed in these slides are Range, Factors Responsible, Solutions. This is an immediately available PowerPoint presentation that can be conveniently customized. Download it and convince your audience.
-
 Use Case Of Blockchain Analytics In Financial Institutions
This slide shows detailed information regarding various applications of blockchain analytics in finance business. These use cases are blocking risky transactions, identifying high risk customers and due diligence. Introducing our Use Case Of Blockchain Analytics In Financial Institutions set of slides. The topics discussed in these slides are Blocking Risky Transactions, Financial Institutions, Blockchain Analytics. This is an immediately available PowerPoint presentation that can be conveniently customized. Download it and convince your audience.
-
 A financial research and analytics services diagram powerpoint show
Presenting a financial research and analytics services diagram powerpoint show. This is a financial research and analytics services diagram powerpoint show. This is a five stage process. The stages in this process are survey result, mystery shops audits, inbound customer contacts, social and traditional media, employee feedback, thoughtful synthesis, analytical integration, data integration.
-
 Ai analytics investor pitch deck financial projections after launch of ai app
This template depicts revenue estimation in the first 18 months after launch of the AI application. Here we have includes key takeaways of the presentation and CTA of the project. Present the topic in a bit more detail with this Ai Analytics Investor Pitch Deck Financial Projections After Launch Of Ai App. Use it as a tool for discussion and navigation on Financial Projections After Launch Of AI App. This template is free to edit as deemed fit for your organization. Therefore download it now.
-
 Analytics Cloud Dashboard Snapshot For Financial Reporting Sap Analytics Cloud
This slide illustrates the SAP Analytics Cloud dashboard snapshot for financial reporting in terms of net revenue, operating profit, cost of goods sold, profitability trend and net revenue by country. It also provides details of net worth of incoming order and order distribution by country. Present the topic in a bit more detail with this Analytics Cloud Dashboard For Financial Reporting Sap Analytics Cloud. Use it as a tool for discussion and navigation on Analytics, Dashboard, Financial. This template is free to edit as deemed fit for your organization. Therefore download it now.
-
 Sap Analytics Cloud Financial Performance Of Organization
This slide visually present the financial performance of organization in terms of revenue, gross and net profit and earnings per share with key insights. Present the topic in a bit more detail with this Sap Analytics Cloud Financial Performance Of Organization. Use it as a tool for discussion and navigation on Financial Performance Of Organization. This template is free to edit as deemed fit for your organization. Therefore download it now.
-
 KPIS For Financial Service Delivery Servicenow Performance Analytics
This slide represents the KPIs for financial service delivery and how machine learning and AI can help to foresee the processes, insights that can benefit the financial sector. Deliver an outstanding presentation on the topic using this KPIS For Financial Service Delivery Servicenow Performance Analytics. Dispense information and present a thorough explanation of KPIS For Financial, Service Delivery using the slides given. This template can be altered and personalized to fit your needs. It is also available for immediate download. So grab it now.
-
 SAP Analytics Cloud Dashboard For Financial Reporting Business Intelligence Strategy For Data Driven Decisions
This slide illustrates the SAP Analytics Cloud dashboard for financial reporting in terms of net revenue, operating profit, cost of goods sold, profitability trend and net revenue by country. It also provides details of net worth of incoming order and order distribution by country. Present the topic in a bit more detail with this SAP Analytics Cloud Dashboard For Financial Reporting Business Intelligence Strategy For Data Driven Decisions. Use it as a tool for discussion and navigation on Operating Profit, Net Incoming Orders, Profitability Trend, Financial Reporting. This template is free to edit as deemed fit for your organization. Therefore download it now.
-
 SAP Analytics Cloud Dashboard For Financial Reporting Action Plan For Implementing BI
This slide illustrates the SAP Analytics Cloud dashboard for financial reporting in terms of net revenue, operating profit, cost of goods sold, profitability trend and net revenue by country. It also provides details of net worth of incoming order and order distribution by country. Deliver an outstanding presentation on the topic using this SAP Analytics Cloud Dashboard For Financial Reporting Action Plan For Implementing BI. Dispense information and present a thorough explanation of Profitability Trend, SAP Analytics, Cloud Dashboard, Financial Reporting using the slides given. This template can be altered and personalized to fit your needs. It is also available for immediate download. So grab it now.
-
 Forecasted Financial Data Analytics Growth Trends
This slide shows financial data analytics growth trends till 2029 that highlights geographical distribution of growth among different countries. It include key market players and geographical growth etc. Introducing our Forecasted Financial Data Analytics Growth Trends set of slides. The topics discussed in these slides are Market, Data, Growth. This is an immediately available PowerPoint presentation that can be conveniently customized. Download it and convince your audience.
-
 SAP Analytics Cloud Dashboard For Financial Reporting Strategic Business Planning
This slide illustrates the SAP Analytics Cloud dashboard for financial reporting in terms of net revenue, operating profit, cost of goods sold, profitability trend and net revenue by country. It also provides details of net worth of incoming order and order distribution by country. Deliver an outstanding presentation on the topic using this SAP Analytics Cloud Dashboard For Financial Reporting Strategic Business Planning. Dispense information and present a thorough explanation of SAP Analytics, Cloud Dashboard, Financial Reporting, Operating Pro using the slides given. This template can be altered and personalized to fit your needs. It is also available for immediate download. So grab it now.
-
 Using Behavioral Analytics For Multiple Transactions Reducing Business Frauds And Effective Financial Alm
The following slide illustrates usage of behavioral analytics for multiple transactions and profiles. It provides information about transaction, collaborative, behavior sorted, user defined, global intelligent, merchant, risk sensitivity, false positives, financial crimes, etc. Deliver an outstanding presentation on the topic using this Using Behavioral Analytics For Multiple Transactions Reducing Business Frauds And Effective Financial Alm. Dispense information and present a thorough explanation of Analytics, Transactions, Assessment using the slides given. This template can be altered and personalized to fit your needs. It is also available for immediate download. So grab it now.
-
 Financial Business Growth Data Analytics
Following slides shows the data analysis of business financial growth by setting up a target and actual growth attain which assist in forecasting the desired outcomes of the company. It covers the period from 2015 to 2023 Introducing our Financial Business Growth Data Analytics set of slides. The topics discussed in these slides are Targeted Sales, Least Achieved Target This is an immediately available PowerPoint presentation that can be conveniently customized. Download it and convince your audience.
-
 Financial Fraud Analytics Dashboard Of Companies
Following slides show the dashboard of financial fraud analytics of organization which will assist in preventing a foreseeing frauds. This includes KPI such as clients alert, risk entity, etc. Deliver an outstanding presentation on the topic using this Financial Fraud Analytics Dashboard Of Companies. Dispense information and present a thorough explanation of Total Alerts, Clients Alerts, Organization Alerts using the slides given. This template can be altered and personalized to fit your needs. It is also available for immediate download. So grab it now.
-
 Financial comparison business chart analytics and dashboard
Presenting this set of slides with name - Financial Comparison Business Chart Analytics And Dashboard. This is a one stage process. The stages in this process are Financial Comparison, Financial Analysis, Financial Statement.
-
 Financial comparison business report data analytics
Presenting this set of slides with name - Financial Comparison Business Report Data Analytics. This is a one stage process. The stages in this process are Financial Comparison, Financial Analysis, Financial Statement.
-
 Financial comparison person monitoring data analytics
Presenting this set of slides with name - Financial Comparison Person Monitoring Data Analytics. This is a two stage process. The stages in this process are Financial Comparison, Financial Analysis, Financial Statement.
-
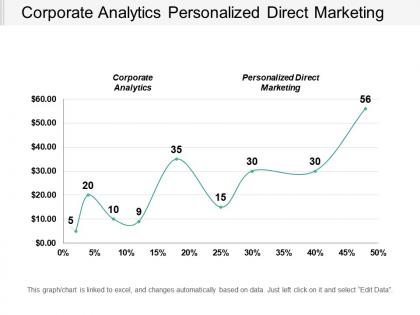 Corporate analytics personalized direct marketing financial performance work management cpb
Presenting this set of slides with name - Corporate Analytics Personalized Direct Marketing Financial Performance Work Management Cpb. This is an editable two stages graphic that deals with topics like Corporate Analytics, Personalized Direct Marketing Financial Performance, Work Management to help convey your message better graphically. This product is a premium product available for immediate download, and is 100 percent editable in Powerpoint. Download this now and use it in your presentations to impress your audience.
-
 Financial Analytics With Desktop Colored Icon In Powerpoint Pptx Png And Editable Eps Format
Give your next presentation a sophisticated, yet modern look with this 100 percent editable Financial analytics with desktop colored icon in powerpoint pptx png and editable eps format. Choose from a variety of customizable formats such as PPTx, png, eps. You can use these icons for your presentations, banners, templates, One-pagers that suit your business needs.
-
 Financial Analytics With Desktop Monotone Icon In Powerpoint Pptx Png And Editable Eps Format
Make your presentation profoundly eye-catching leveraging our easily customizable Financial analytics with desktop monotone icon in powerpoint pptx png and editable eps format. It is designed to draw the attention of your audience. Available in all editable formats, including PPTx, png, and eps, you can tweak it to deliver your message with ease.
-
 Data Analytics Use In Mitigating Financial Institution Risk
This slide illustrates data analytics in finance and baking sector used for mitigating risk associated with banking transition, capital raise and credit management. It includes fraud detection, risk modeling for investment bank, credit risk analysis and operation risk analysis. Presenting our set of slides with Data Analytics Use In Mitigating Financial Institution Risk. This exhibits information on four stages of the process. This is an easy to edit and innovatively designed PowerPoint template. So download immediately and highlight information on Operational Risk Analysis, Fraud Detection, Credit Risk Analysis.
-
 Financial Performance Analytics In Powerpoint And Google Slides Cpb
Presenting our Financial Performance Analytics In Powerpoint And Google Slides Cpb PowerPoint template design. This PowerPoint slide showcases three stages. It is useful to share insightful information on Financial Performance Analytics This PPT slide can be easily accessed in standard screen and widescreen aspect ratios. It is also available in various formats like PDF, PNG, and JPG. Not only this, the PowerPoint slideshow is completely editable and you can effortlessly modify the font size, font type, and shapes according to your wish. Our PPT layout is compatible with Google Slides as well, so download and edit it as per your knowledge.
-
 Financial Services Data Analytics In Powerpoint And Google Slides Cpb
Presenting Financial Services Data Analytics In Powerpoint And Google Slides Cpb slide which is completely adaptable. The graphics in this PowerPoint slide showcase five stages that will help you succinctly convey the information. In addition, you can alternate the color, font size, font type, and shapes of this PPT layout according to your content. This PPT presentation can be accessed with Google Slides and is available in both standard screen and widescreen aspect ratios. It is also a useful set to elucidate topics like Financial Services Data Analytics. This well structured design can be downloaded in different formats like PDF, JPG, and PNG. So, without any delay, click on the download button now.
-
 Financial Services Analytics In Powerpoint And Google Slides Cpb
Presenting Financial Services Analytics In Powerpoint And Google Slides Cpb slide which is completely adaptable. The graphics in this PowerPoint slide showcase three stages that will help you succinctly convey the information. In addition, you can alternate the color, font size, font type, and shapes of this PPT layout according to your content. This PPT presentation can be accessed with Google Slides and is available in both standard screen and widescreen aspect ratios. It is also a useful set to elucidate topics like Financial Services Analytics. This well structured design can be downloaded in different formats like PDF, JPG, and PNG. So, without any delay, click on the download button now.
-
 Financial Analytics Market In Powerpoint And Google Slides Cpb
Presenting our Financial Analytics Market In Powerpoint And Google Slides Cpb PowerPoint template design. This PowerPoint slide showcases three stages. It is useful to share insightful information on Financial Analytics Market This PPT slide can be easily accessed in standard screen and widescreen aspect ratios. It is also available in various formats like PDF, PNG, and JPG. Not only this, the PowerPoint slideshow is completely editable and you can effortlessly modify the font size, font type, and shapes according to your wish. Our PPT layout is compatible with Google Slides as well, so download and edit it as per your knowledge.
-
 Healthcare Financial Analytics In Powerpoint And Google Slides Cpb
Presenting our Healthcare Financial Analytics In Powerpoint And Google Slides Cpb PowerPoint template design. This PowerPoint slide showcases five stages. It is useful to share insightful information on Healthcare Financial Analytics This PPT slide can be easily accessed in standard screen and widescreen aspect ratios. It is also available in various formats like PDF, PNG, and JPG. Not only this, the PowerPoint slideshow is completely editable and you can effortlessly modify the font size, font type, and shapes according to your wish. Our PPT layout is compatible with Google Slides as well, so download and edit it as per your knowledge.
-
 Artificial Intelligence Analytics Tools Why Al Is The Future Of Financial Services
This slide covers the AI analytics tools such as albert, nudge, lexalytics, etc. along with its platform and feature details. Present the topic in a bit more detail with this Artificial Intelligence Analytics Tools Why Al Is The Future Of Financial Services. Use it as a tool for discussion and navigation on Artificial Intelligence, Analytics Tools, Lexalytics. This template is free to edit as deemed fit for your organization. Therefore download it now.
-
 Risk Analytics Bankink Financial Services In Powerpoint And Google Slides Cpb
Presenting our Risk Analytics Bankink Financial Services In Powerpoint And Google Slides Cpb PowerPoint template design. This PowerPoint slide showcases five stages. It is useful to share insightful information on Risk Analytics Bankink Financial Services This PPT slide can be easily accessed in standard screen and widescreen aspect ratios. It is also available in various formats like PDF, PNG, and JPG. Not only this, the PowerPoint slideshow is completely editable and you can effortlessly modify the font size, font type, and shapes according to your wish. Our PPT layout is compatible with Google Slides as well, so download and edit it as per your knowledge.
-
 Financial Highlights FY2023 Data Analytics Company Profile CPSSV
This slide highlights the Experian financial highlights for FY2023 which includes the revenue, revenue growth, EBIT, profit before tax, cash flow conversion, earning per share and ordinary dividends. Introducing Financial Highlights FY2023 Data Analytics Company Profile CPSSV to increase your presentation threshold. Encompassed with nine stages, this template is a great option to educate and entice your audience. Dispence information on Revenue, Growth, Profit, using this template. Grab it now to reap its full benefits.
-
 Financial Data And Analytics Growth Icon
Introducing our premium set of slides with Financial Data And Analytics Growth Icon. Ellicudate the three stages and present information using this PPT slide. This is a completely adaptable PowerPoint template design that can be used to interpret topics like Digital Marketing Data Growth Trends Icon. So download instantly and tailor it with your information.
-
 Banking Analytics And Financial Service Trends
The following slide displays the trends of banking and financial services using analytics and AI in shaping the future of data driven enterprise using mobile banking, regulatory technology, personalization and banking experience.Presenting our set of slides with Banking Analytics And Financial Service Trends. This exhibits information on four stages of the process. This is an easy to edit and innovatively designed PowerPoint template. So download immediately and highlight information on Information Transparency, Personalized Banking, Security Authentication.
-
 Financial Report With Data Analytics In Banking Icon
Introducing our premium set of slides with Financial Report With Data Analytics In Banking Icon. Ellicudate the three stages and present information using this PPT slide. This is a completely adaptable PowerPoint template design that can be used to interpret topics like Financial Report, Data Analytics, Banking Icon . So download instantly and tailor it with your information.
-
 Predictive Analytics In Banking And Financial Services
This slide outlines how banks make the use of predictive analytics to benefit their customer and users by managing risk. Key components are credit score, budgeting, risk prevention, finance management.Introducing our premium set of slides with Predictive Analytics In Banking And Financial Services. Ellicudate the four stages and present information using this PPT slide. This is a completely adaptable PowerPoint template design that can be used to interpret topics like Finance Management, Monitor Suspicious, Risk Prevention. So download instantly and tailor it with your information.
-
 Financial Budget For Implementing Customer Data Analytics Services
This slide consists of financial budget for integrating customer data analytics solution in business organization. Key elements are number of people, percentage time spent, salary etc.Introducing our Financial Budget For Implementing Customer Data Analytics Services set of slides. The topics discussed in these slides are Financial budget, implementing customer, data analytics services. This is an immediately available PowerPoint presentation that can be conveniently customized. Download it and convince your audience.
-
 Financial Crime Analytics In Powerpoint And Google Slides Cpb
Presenting our Financial Crime Analytics In Powerpoint And Google Slides Cpb PowerPoint template design. This PowerPoint slide showcases four stages. It is useful to share insightful information on Financial Crime Analytics. This PPT slide can be easily accessed in standard screen and widescreen aspect ratios. It is also available in various formats like PDF, PNG, and JPG. Not only this, the PowerPoint slideshow is completely editable and you can effortlessly modify the font size, font type, and shapes according to your wish. Our PPT layout is compatible with Google Slides as well, so download and edit it as per your knowledge.


