Powerpoint Templates and Google slides for Data Visualization Data Dashboard
Save Your Time and attract your audience with our fully editable PPT Templates and Slides.
-
 Statistical Analysis For Data Driven Dashboard For Data Visualization And Analytics
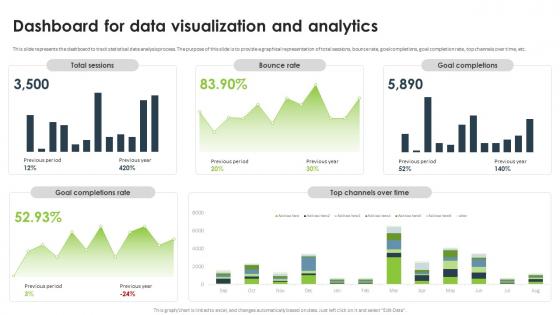
This slide represents the dashboard to track statistical data analysis process. The purpose of this slide is to provide a graphical representation of total sessions, bounce rate, goal completions, goal completion rate, top channels over time, etc. Present the topic in a bit more detail with this Statistical Analysis For Data Driven Dashboard For Data Visualization And Analytics. Use it as a tool for discussion and navigation on Data Visualization And Analytics, Bounce Rate, Goal Completions, Goal Completion Rate. This template is free to edit as deemed fit for your organization. Therefore download it now.
-
 Data visualization data dashboard ppt powerpoint presentation portfolio graphics template cpb
Presenting Data Visualization Data Dashboard Ppt Powerpoint Presentation Portfolio Graphics Template Cpb slide which is completely adaptable. The graphics in this PowerPoint slide showcase three stages that will help you succinctly convey the information. In addition, you can alternate the color, font size, font type, and shapes of this PPT layout according to your content. This PPT presentation can be accessed with Google Slides and is available in both standard screen and widescreen aspect ratios. It is also a useful set to elucidate topics like Data Visualization Data Dashboard. This well structured design can be downloaded in different formats like PDF, JPG, and PNG. So, without any delay, click on the download button now.


