Powerpoint Templates and Google slides for Data To Analytic Insights
Save Your Time and attract your audience with our fully editable PPT Templates and Slides.
-
 Leveraging Digital Analytics To Develop Data Insights And Optimize Business Operations Data Analytics CD
Ditch the Dull templates and opt for our engaging Leveraging Digital Analytics To Develop Data Insights And Optimize Business Operations Data Analytics CD deck to attract your audience. Our visually striking design effortlessly combines creativity with functionality, ensuring your content shines through. Compatible with Microsoft versions and Google Slides, it offers seamless integration of presentation. Save time and effort with our pre-designed PPT layout, while still having the freedom to customize fonts, colors, and everything you ask for. With the ability to download in various formats like JPG, JPEG, and PNG, sharing your slides has never been easier. From boardroom meetings to client pitches, this deck can be the secret weapon to leaving a lasting impression.
-
 Big Data Analytics Dashboard To Track Retail Performance Data Driven Insights Big Data Analytics SS V
This slide showcases dashboard for monitoring retail business performance which helps in improving revenue generation. It provides information regarding KPIs such as gross margin, sales, card abandonment rate, average unit price etc. Present the topic in a bit more detail with this Big Data Analytics Dashboard To Track Retail Performance Data Driven Insights Big Data Analytics SS V Use it as a tool for discussion and navigation on Big Data Analytics Dashboard, Track Retail Performance This template is free to edit as deemed fit for your organization. Therefore download it now.
-
 Data Analytics Dashboard To Track Hospital Performance Data Driven Insights Big Data Analytics SS V
This slide showcases dashboard for tracking hospitals activities which helps in improving performance efficiency. It provides information regarding bed occupancy rate, patient satisfaction rate, staff to patient ratio, room turnover etc. Deliver an outstanding presentation on the topic using this Data Analytics Dashboard To Track Hospital Performance Data Driven Insights Big Data Analytics SS V Dispense information and present a thorough explanation of Bed Occupancy Rates, Efficiency Costs, Satisfaction Service Indicators using the slides given. This template can be altered and personalized to fit your needs. It is also available for immediate download. So grab it now.
-
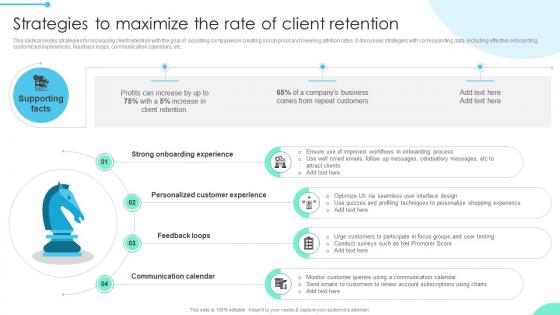 Strategies To Maximize Enhancing Business Insights Implementing Product Data Analytics SS V
This slide provides strategies for increasing client retention with the goal of assisting companies in creating social proof and lowering attrition rates. It discusses strategies with corresponding data, including effective onboarding, customized experiences, feedback loops, communication calendars, etc. Increase audience engagement and knowledge by dispensing information using Strategies To Maximize Enhancing Business Insights Implementing Product Data Analytics SS V. This template helps you present information on four stages. You can also present information on Onboarding Experience, Customer Experience, Feedback Loops using this PPT design. This layout is completely editable so personaize it now to meet your audiences expectations.
-
 Impact Of Driving Business Insights Using Leveraging Digital Analytics To Develop Data Analytics SS
This slide showcases benefits of informed decision making using digital analytics tools which helps in enhancing business performance. It provides information regarding marketing ROI, customer retention, conversion rates, data security and engagement rates and key takeaways. Present the topic in a bit more detail with this Impact Of Driving Business Insights Using Leveraging Digital Analytics To Develop Data Analytics SS. Use it as a tool for discussion and navigation on Pre Implementation, Post Implementation, Data Security, Engagement Rates. This template is free to edit as deemed fit for your organization. Therefore download it now.
-
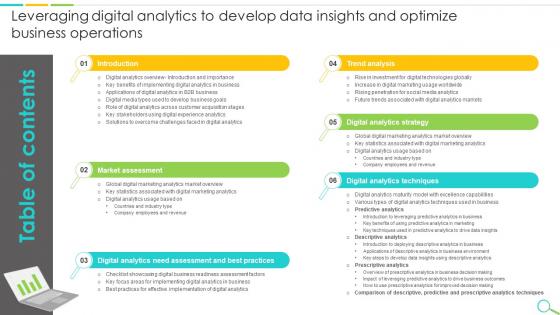 Table Of Contents Leveraging Digital Analytics To Develop Data Insights And Optimize Business Operations
Increase audience engagement and knowledge by dispensing information using Table Of Contents Leveraging Digital Analytics To Develop Data Insights And Optimize Business Operations. This template helps you present information on six stages. You can also present information on Market Assessment, Digital Analytics Strategy, Trend Analysis, Digital Analytics Techniques using this PPT design. This layout is completely editable so personaize it now to meet your audiences expectations.
-
 Big Data Marketing Overview Of Analytics To Gain Marketing Insights MKT SS V
The following slide illustrates meaning of marketing analytics to boost return on investment and gain useful insights. It includes elements such as product design, customer surveys, industry trends, customer support, consumers buying pattern, keyword search frequency etc. Introducing Big Data Marketing Overview Of Analytics To Gain Marketing Insights MKT SS V to increase your presentation threshold. Encompassed with Four stages, this template is a great option to educate and entice your audience. Dispence information on Customer Surveys, Industry Trends using this template. Grab it now to reap its full benefits.
-
 Overview Of Analytics To Gain Marketing Insights Marketing Data Analysis MKT SS V
The following slide illustrates meaning of marketing analytics to boost return on investment and gain useful insights. It includes elements such as product design, customer surveys, industry trends, customer support, consumers buying pattern, keyword search frequency etc. Increase audience engagement and knowledge by dispensing information using Overview Of Analytics To Gain Marketing Insights Marketing Data Analysis MKT SS V This template helps you present information on four stages. You can also present information on Product Design, Customer Surveys, Industry Trends using this PPT design. This layout is completely editable so personaize it now to meet your audiences expectations.
-
 Steps To Create Client Data Insights And Analytics Section
This slide show steps to create customer analytics section for business plan to align product features with customer needs. It include steps such as identify business customers, define customer needs and create customer persona etc.Presenting our set of slides with Steps To Create Client Data Insights And Analytics Section. This exhibits information on four stages of the process. This is an easy to edit and innovatively designed PowerPoint template. So download immediately and highlight information on Customer Needs, Highlight Benefits, Identify Potential Customers
-
 Implementing Big Data Analytics Supply Chain Data Types To Develop Business Insights CRP DK SS
This slide showcases various types of supply chain data which are collected such as stores, customers, products, sales, orders, shipping and delivery data. Introducing Implementing Big Data Analytics Supply Chain Data Types To Develop Business Insights CRP DK SS to increase your presentation threshold. Encompassed with seven stages, this template is a great option to educate and entice your audience. Dispence information on Retail Store Code, Store Employee Data, Product Code, Product Price, using this template. Grab it now to reap its full benefits.
-
 Big Data Types Analyzed To Drive Valuable Insights Big Data Analytics Applications Data Analytics SS
This slide showcases various types of big data that is used for data analysis which helps in creating deeper insights to enhance business operations. It provides information regarding structure , unstructured and semi structured data. Increase audience engagement and knowledge by dispensing information using Big Data Types Analyzed To Drive Valuable Insights Big Data Analytics Applications Data Analytics SS. This template helps you present information on three stages. You can also present information on Structured, Unstructured, Semi Structured using this PPT design. This layout is completely editable so personaize it now to meet your audiences expectations.
-
 Steps To Develop Data Driven Insights Using Descriptive Big Data Analytics Applications Data Analytics SS
This slide showcases steps involved in using descriptive analytics to create valuable business insights. It provides information regarding data collection, preparation, analysis and visualization. Increase audience engagement and knowledge by dispensing information using Steps To Develop Data Driven Insights Using Descriptive Big Data Analytics Applications Data Analytics SS. This template helps you present information on four stages. You can also present information on Data Collection, Data Preparation, Data Analysis using this PPT design. This layout is completely editable so personaize it now to meet your audiences expectations.
-
 Big Data Types Analyzed To Drive Valuable Insights Data Driven Insights Big Data Analytics SS V
This slide showcases various types of big data that is used for data analysis which helps in creating deeper insights to enhance business operations. It provides information regarding structure , unstructured and semi structured data. Present the topic in a bit more detail with this Big Data Types Analyzed To Drive Valuable Insights Data Driven Insights Big Data Analytics SS V Use it as a tool for discussion and navigation on Structured, Unstructured, Semi Structured This template is free to edit as deemed fit for your organization. Therefore download it now.
-
 Factors To Consider While Selecting Big Data Analytics Tools Data Driven Insights Big Data Analytics SS V
This slide highlights factors to be considered while choosing big data analytics tools to improve business processes. It provides information regarding data integration, scalability and pricing . Increase audience engagement and knowledge by dispensing information using Factors To Consider While Selecting Big Data Analytics Tools Data Driven Insights Big Data Analytics SS V This template helps you present information on three stages. You can also present information on Data Integration, Scalable, Pricing using this PPT design. This layout is completely editable so personaize it now to meet your audiences expectations.
-
 How To Use Big Data To Drive Business Outcomes Data Driven Insights Big Data Analytics SS V
This slide showcases various ways business uses big data to make informed business decisions which helps in improving performance and process efficiency. It includes elements such as retention, personalization, data security, asset efficiency, operational risk, innovation prospects etc. Introducing How To Use Big Data To Drive Business Outcomes Data Driven Insights Big Data Analytics SS V to increase your presentation threshold. Encompassed with five stages, this template is a great option to educate and entice your audience. Dispence information on Retain Potential Consumers, Business Operations, Decrease Data using this template. Grab it now to reap its full benefits.
-
 Introduction To Big Data Analytics For Optimizing Data Driven Insights Big Data Analytics SS V
This slide provides an overview of big data analytics which is used in business for making informed decisions based on data insights. It includes elements such as complex data sets, consumer behavior, machine learning, streaming analytics, risk identification, in cluster analysis etc. Increase audience engagement and knowledge by dispensing information using Introduction To Big Data Analytics For Optimizing Data Driven Insights Big Data Analytics SS V This template helps you present information on four stages. You can also present information on Analyze Large Data Sets, Recognize Patterns, Drive Insights From Data using this PPT design. This layout is completely editable so personaize it now to meet your audiences expectations.
-
 Introduction To Big Data Predictive Analytics Data Driven Insights Big Data Analytics SS V
This slide provides an overview of leveraging predictive analytics in analyzing big data which helps in driving valuable insights. It includes elements such as decision trees, neural networks, text analysis, structured data, operational efficiency, strategic decision making etc. Deliver an outstanding presentation on the topic using this Introduction To Big Data Predictive Analytics Data Driven Insights Big Data Analytics SS V Dispense information and present a thorough explanation of Business Operational Efficiency, Strategic Decision Making, Structured Data using the slides given. This template can be altered and personalized to fit your needs. It is also available for immediate download. So grab it now.
-
 Overview Of Prescriptive Analytics To Data Driven Insights Big Data Analytics SS V
This slide provides introduction to prescriptive analytics technique used for long term decision making. It provides information regarding accurate forecasting, strategic decision making, weighted projections etc. Present the topic in a bit more detail with this Overview Of Prescriptive Analytics To Data Driven Insights Big Data Analytics SS V Use it as a tool for discussion and navigation on Avoid Uncertain Events, Strategic Decision Making, Make Probability Weighted Projections This template is free to edit as deemed fit for your organization. Therefore download it now.
-
 Solutions To Overcome Challenges Faced In Big Data Driven Insights Big Data Analytics SS V
This slide showcases challenges faced In big with solutions to overcome these barriers. It provides information regarding improper understanding, data development problems and ineffective tool selection. Present the topic in a bit more detail with this Solutions To Overcome Challenges Faced In Big Data Driven Insights Big Data Analytics SS V Use it as a tool for discussion and navigation on Improper Understanding, Data Development Problems, Ineffective Tool Selection This template is free to edit as deemed fit for your organization. Therefore download it now.
-
 Steps To Develop Data Driven Insights Using Descriptive Analytics Data Driven Insights Big Data Analytics SS V
This slide showcases steps involved in using descriptive analytics to create valuable business insights. It provides information regarding data collection, preparation, analysis and visualization. Increase audience engagement and knowledge by dispensing information using Steps To Develop Data Driven Insights Using Descriptive Analytics Data Driven Insights Big Data Analytics SS V This template helps you present information on four stages. You can also present information on Data Collection, Data Preparation, Data Visualization using this PPT design. This layout is completely editable so personaize it now to meet your audiences expectations.
-
 When To Use Descriptive Analytics Technique Data Driven Insights Big Data Analytics SS V
This slide highlights applications of descriptive analytics in business environment which helps in data driven decision making. It provides information regarding studying past data, effective reporting, decision making and benchmarking. Increase audience engagement and knowledge by dispensing information using When To Use Descriptive Analytics Technique Data Driven Insights Big Data Analytics SS V This template helps you present information on four stages. You can also present information on Study Past Data, Decision Making, Effective Reporting using this PPT design. This layout is completely editable so personaize it now to meet your audiences expectations.
-
 Key Metrics Used To Track Enhancing Business Insights Implementing Product Data Analytics SS V
This slide outlines major metrics used by businesses to analyse product performance aimed at making necessary improvements. It covers key metrics such as engagement, retention, customer lifetime value, number of crashes and feature adoption rate with benefits. Present the topic in a bit more detail with this Key Metrics Used To Track Enhancing Business Insights Implementing Product Data Analytics SS V. Use it as a tool for discussion and navigation on Key Drivers, Align Teams, Customer Retention. This template is free to edit as deemed fit for your organization. Therefore download it now.
-
 Key Steps To Perform Enhancing Business Insights Implementing Product Data Analytics SS V
The following slide outlines steps to perform cohort analysis for helping organizations target user requirements and strategize products or services. It covers determining objectives, metrics, specific cohorts with conducting analysis and evaluating results. Introducing Key Steps To Perform Enhancing Business Insights Implementing Product Data Analytics SS V to increase your presentation threshold. Encompassed with five stages, this template is a great option to educate and entice your audience. Dispence information on Determining Objectives, Define Metrics, Specific Cohorts, using this template. Grab it now to reap its full benefits.
-
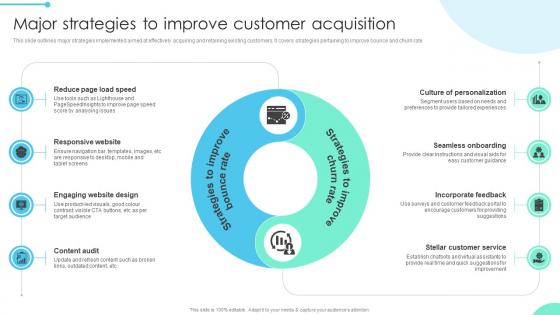 Major Strategies To Improve Enhancing Business Insights Implementing Product Data Analytics SS V
This slide outlines major strategies implemented aimed at effectively acquiring and retaining existing customers. It covers strategies pertaining to improve bounce and churn rate. Introducing Major Strategies To Improve Enhancing Business Insights Implementing Product Data Analytics SS V to increase your presentation threshold. Encompassed with two stages, this template is a great option to educate and entice your audience. Dispence information on Culture Of Personalization, Seamless Onboarding, Incorporate Feedback, using this template. Grab it now to reap its full benefits.
-
 Need To Implement Product Enhancing Business Insights Implementing Product Data Analytics SS V
This slide outlines challenges organisations faced before implementing product analytics aimed at boosting competitive advantage. It covers solutions to challenges such as lack of data driven decision making, inefficient resource allocation, product development, missed growth opportunities, etc. Deliver an outstanding presentation on the topic using this Need To Implement Product Enhancing Business Insights Implementing Product Data Analytics SS V. Dispense information and present a thorough explanation of Data Driven, Decision Making, Resource Allocation using the slides given. This template can be altered and personalized to fit your needs. It is also available for immediate download. So grab it now.
-
 Recommendations To Improve Enhancing Business Insights Implementing Product Data Analytics SS V
This slide outlines key practices to implement product analytics aimed at helping teams move with agility and make informed decisions. It covers cross functional collaboration, prioritize data management, implement data governance, integrations, etc. Introducing Recommendations To Improve Enhancing Business Insights Implementing Product Data Analytics SS V to increase your presentation threshold. Encompassed with five stages, this template is a great option to educate and entice your audience. Dispence information on Functional Collaboration, Data Management, Plan Instrumentation, using this template. Grab it now to reap its full benefits.
-
 Solutions To Challenges Enhancing Business Insights Implementing Product Data Analytics SS V
This slide provides solutions to major data democratization challenges faced in product analytics. The basis of challenges are complexity of data infrastructure, lack of centralization, data security and privacy, data literacy and data quality. Deliver an outstanding presentation on the topic using this Solutions To Challenges Enhancing Business Insights Implementing Product Data Analytics SS V. Dispense information and present a thorough explanation of Data Infrastructure, Centralization, Data Security using the slides given. This template can be altered and personalized to fit your needs. It is also available for immediate download. So grab it now.
-
 Steps To Build Attribution Enhancing Business Insights Implementing Product Data Analytics SS V
This slide outlines phases to develop attribution strategy aimed at tracking, aligning and prioritizing experiences. It covers steps such as determine objectives, store information, focus on behavior, analyze interactions, choose right model and optimize attribution window. Introducing Steps To Build Attribution Enhancing Business Insights Implementing Product Data Analytics SS V to increase your presentation threshold. Encompassed with six stages, this template is a great option to educate and entice your audience. Dispence information on Attribution Window, Right Model, Analyse Interactions, using this template. Grab it now to reap its full benefits.
-
 Steps To Conduct Retention Enhancing Business Insights Implementing Product Data Analytics SS V
This slide provides phases to conduct retention analysis aimed at helping businesses improve churn rate. It covers six steps such as calculate rate, choose retention KPIs, flag behaviours, determine triggers, identify behaviours and generate feedback. Increase audience engagement and knowledge by dispensing information using Steps To Conduct Retention Enhancing Business Insights Implementing Product Data Analytics SS V. This template helps you present information on six stages. You can also present information on Flag Behaviours, Retention Rate, Behaviours using this PPT design. This layout is completely editable so personaize it now to meet your audiences expectations.
-
 Steps To Create Customer Enhancing Business Insights Implementing Product Data Analytics SS V
This slide outlines phases to develop customer journey map aimed at tracking, aligning and prioritizing experiences. It covers steps such as define scope, list touchpoints, compile data, alignment, take journey, visualization, team pitching and share results. Introducing Steps To Create Customer Enhancing Business Insights Implementing Product Data Analytics SS V to increase your presentation threshold. Encompassed with eight stages, this template is a great option to educate and entice your audience. Dispence information on Scope, Compile Data, List Touchpoints, using this template. Grab it now to reap its full benefits.
-
 Agends Leveraging Digital Analytics To Develop Data Insights And Optimize Business Operations
Introducing Agends Leveraging Digital Analytics To Develop Data Insights And Optimize Business Operations to increase your presentation threshold. Encompassed with five stages, this template is a great option to educate and entice your audience. Dispence information on Concept Of Digital Analytics, Descriptive And Prescriptive Analytics, Digital Analytics In Business, using this template. Grab it now to reap its full benefits.
-
 Icons Slide Leveraging Digital Analytics To Develop Data Insights And Optimize Business Operations
Introducing our well researched set of slides titled Icons Slide Leveraging Digital Analytics To Develop Data Insights And Optimize Business Operations. It displays a hundred percent editable icons. You can use these icons in your presentation to captivate your audiences attention. Download now and use it multiple times.
-
 Key Steps To Develop Data Insights Using Leveraging Digital Analytics To Develop Data Analytics SS
This slide showcase various steps involved in driving valuable insights for business through using descriptive analytics techniques. It provides information regarding defining metrics for business, identifying data sources, gathering an preparing data, assessing data and develop data reports. Introducing Key Steps To Develop Data Insights Using Leveraging Digital Analytics To Develop Data Analytics SS to increase your presentation threshold. Encompassed with five stages, this template is a great option to educate and entice your audience. Dispence information on Define Metrics For Business, Gather And Prepare Data, Develop Data Report, Identify Data Sources, using this template. Grab it now to reap its full benefits.
-
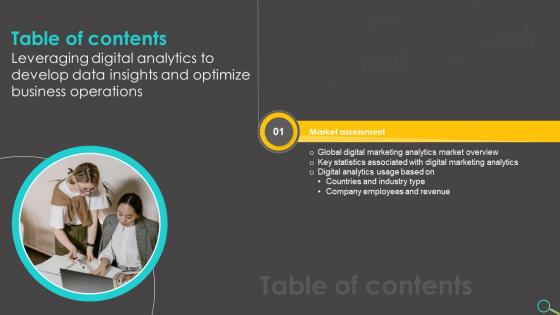 Table Of Contents For Leveraging Digital Analytics To Develop Data Insights And Optimize Business Operations
Introducing Table Of Contents For Leveraging Digital Analytics To Develop Data Insights And Optimize Business Operations to increase your presentation threshold. Encompassed with one stages, this template is a great option to educate and entice your audience. Dispence information on Digital Marketing Analytics, Countries And Industry Type, Company Employees And Revenue, using this template. Grab it now to reap its full benefits.
-
 How To Overcome Automated Discovery Of Insights Challenges Data Analytics And BI Playbook
This template illustrates that business needs is an intelligent analytics platform that can automatically discover valuable insights from the data. It also depicts that next generation analytics platform acts as an analyst for the organizations. Deliver an outstanding presentation on the topic using this How To Overcome Automated Discovery Of Insights Challenges Data Analytics And BI Playbook. Dispense information and present a thorough explanation of Top Short Description Values, Assignment Group, Automation Opportunities using the slides given. This template can be altered and personalized to fit your needs. It is also available for immediate download. So grab it now.
-
 Website Analytics Dashboard For Consumer Data Insights One To One Promotional Campaign
This slide showcases dashboard for website analytics that can help organization to gather data about visitors and formulate targeted marketing campaigns. It can also help to make individual and group buyer personas. Present the topic in a bit more detail with this Website Analytics Dashboard For Consumer Data Insights One To One Promotional Campaign. Use it as a tool for discussion and navigation on Demographics, Website Analytics, Social Networks. This template is free to edit as deemed fit for your organization. Therefore download it now.
-
 Steps To Convert Data Into Insights And Action Analyzing And Implementing HR Analytics In Enterprise
This slide shows the stages of converting data into actionable insights using HR analytics software. It includes four stages of converting data such as data, analysis, insights and action. Present the topic in a bit more detail with this Steps To Convert Data Into Insights And Action Analyzing And Implementing HR Analytics In Enterprise. Use it as a tool for discussion and navigation on Analysis, Insights, Actions, Insights And Action. This template is free to edit as deemed fit for your organization. Therefore download it now.
-
 Process To Derive Actionable Insights Through Data Analytics
The purpose of this slide is to represent steps to derive actionable insights by processing data sets for strategic decisions and to devise business plan. It covers various steps such as collecting customer feedback, setting key performance indicators and benchmarks, analyze and classify data, drive action and re-test and repeat. Presenting our set of slides with Process To Derive Actionable Insights Through Data Analytics. This exhibits information on five stages of the process. This is an easy to edit and innovatively designed PowerPoint template. So download immediately and highlight information on Process, Data, Analytics.


