Powerpoint Templates and Google slides for Data Statistical Analysis
Save Your Time and attract your audience with our fully editable PPT Templates and Slides.
-
 Statistical Analysis For Data Driven Decision Making Powerpoint Presentation Slides
Deliver an informational PPT on various topics by using this Statistical Analysis For Data Driven Decision Making Powerpoint Presentation Slides. This deck focuses and implements best industry practices, thus providing a birds-eye view of the topic. Encompassed with seventy one slides, designed using high-quality visuals and graphics, this deck is a complete package to use and download. All the slides offered in this deck are subjective to innumerable alterations, thus making you a pro at delivering and educating. You can modify the color of the graphics, background, or anything else as per your needs and requirements. It suits every business vertical because of its adaptable layout.
-
 Business logic diagram statistical techniques of data analysis 8 stages powerpoint slides
We are proud to present our business logic diagram statistical techniques of data analysis 8 stages powerpoint slides. This PowerPoint Diagram shows dependencies among parts of an organization or process. This diagram is made of eight stages of concentric circles. Present your views using our innovative slides and be assured of leaving a lasting impression.
-
 Statistical Analysis For Data Driven Budget For Statistical Analysis Training Program
This slide shows the cost breakup of statistical analysis training program for beginners. The purpose of this slide is to highlight the estimated cost of various training components, such as instructors cost, training material cost, etc. Present the topic in a bit more detail with this Statistical Analysis For Data Driven Budget For Statistical Analysis Training Program. Use it as a tool for discussion and navigation on Budget For Statistical Analysis, Training Program, Instructors Cost, Training Material Cost. This template is free to edit as deemed fit for your organization. Therefore download it now.
-
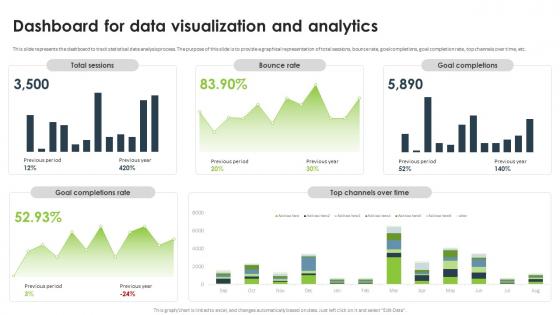 Statistical Analysis For Data Driven Dashboard For Data Visualization And Analytics
This slide represents the dashboard to track statistical data analysis process. The purpose of this slide is to provide a graphical representation of total sessions, bounce rate, goal completions, goal completion rate, top channels over time, etc. Present the topic in a bit more detail with this Statistical Analysis For Data Driven Dashboard For Data Visualization And Analytics. Use it as a tool for discussion and navigation on Data Visualization And Analytics, Bounce Rate, Goal Completions, Goal Completion Rate. This template is free to edit as deemed fit for your organization. Therefore download it now.
-
 Statistical Analysis For Data Driven Global Market Of Statistical Analysis Software
This slide depicts the forecast value of statistical analysis software market. The purpose of this slide is to highlight the expected contribution of different countries in global market of statistical data analysis software, such as North America, Europe, etc. Present the topic in a bit more detail with this Statistical Analysis For Data Driven Global Market Of Statistical Analysis Software. Use it as a tool for discussion and navigation on Statistical Analysis Software Market, Data Analysis Software, Global Market. This template is free to edit as deemed fit for your organization. Therefore download it now.
-
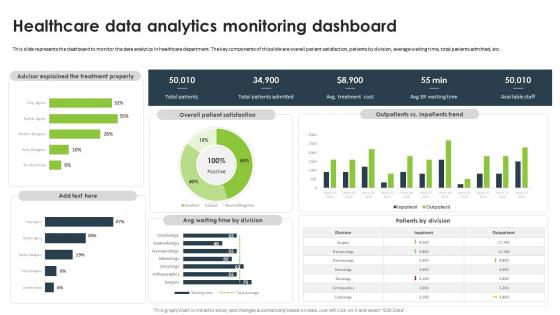 Statistical Analysis For Data Driven Healthcare Data Analytics Monitoring Dashboard
This slide represents the dashboard to monitor the data analytics in healthcare department. The key components of this slide are overall patient satisfaction, patients by division, average waiting time, total patients admitted, etc. Present the topic in a bit more detail with this Statistical Analysis For Data Driven Healthcare Data Analytics Monitoring Dashboard. Use it as a tool for discussion and navigation on Healthcare Data Analytics, Monitoring Dashboard, Healthcare Department. This template is free to edit as deemed fit for your organization. Therefore download it now.
-
 Statistical Analysis For Data Driven Market Size Of Statistical Data Analysis
The purpose of this slide is to illustrate the market size of statistical data analysis from year 2016 to 2023. This slide showcases how statistical analysis software market experienced an elevation in the mentioned years. Present the topic in a bit more detail with this Statistical Analysis For Data Driven Market Size Of Statistical Data Analysis. Use it as a tool for discussion and navigation on Statistical Data Analysis, Statistical Analysis Software, Market Experienced An Elevation. This template is free to edit as deemed fit for your organization. Therefore download it now.
-
 Purchase Price Variance Statistical Data For Trend Analysis
This slide demonstrates purchase price variance data for proactive and strategic approach to manage costs, optimize procurement process for overall financial health. It includes basis such as growth drivers, opportunities available and contributing factors. Introducing our Purchase Price Variance Statistical Data For Trend Analysis set of slides. The topics discussed in these slides are Monthly Purchase, Variance Graph, Trend Analysis This is an immediately available PowerPoint presentation that can be conveniently customized. Download it and convince your audience.
-
 Big Data Analysis Statistics By Global Insurance Industry Report IR SS
The slide examines the attributes on the basis of technology in the insurance industry. The purpose of this slide is to make readers aware about the tech updates available in the insurance sector. It capture the information related to technological change in the industry. It includes information related to insurance analytics and big data analysis market statistics in insurance industry. Present the topic in a bit more detail with this Big Data Analysis Statistics By Global Insurance Industry Report IR SS. Use it as a tool for discussion and navigation on Big Data Analytics, Insurance Market Statistics, Global Insurance Analytics. This template is free to edit as deemed fit for your organization. Therefore download it now.
-
 Statistical Analysis Techniques Healthcare Data Analytics Monitoring Dashboard
This slide represents the dashboard to monitor the data analytics in healthcare department. The key components of this slide are overall patient satisfaction, patients by division, average waiting time, total patients admitted, etc. Present the topic in a bit more detail with this Statistical Analysis Techniques Healthcare Data Analytics Monitoring Dashboard. Use it as a tool for discussion and navigation on Outpatient Vs Inpatients Trend, Overall Patient Satisfaction, Advisor Explained The Treatment Properly. This template is free to edit as deemed fit for your organization. Therefore download it now.
-
 Man Sends Statistics Data Analysis Statistical Analysis Illustration
This coloured powerpoint icon is perfect for presentations on data analysis. It features a man in a suit holding a graph, representing the transmission of statistical information. It is a great visual aid to demonstrate the importance of data in decision making.
-
 Statistics Highlighting Demand For Data Driven Decision Making Marketing Data Analysis MKT SS V
The following slide showcases some marketing analytics facts and figures to encourage business decisions based on big data. It includes elements such as higher return on investments, promotional expenses, competitive outputs, budget investments etc. Introducing Statistics Highlighting Demand For Data Driven Decision Making Marketing Data Analysis MKT SS V to increase your presentation threshold. Encompassed with six stages, this template is a great option to educate and entice your audience. Dispence information on Based Marketing, Marketing Analytics, Data Analytics using this template. Grab it now to reap its full benefits.
-
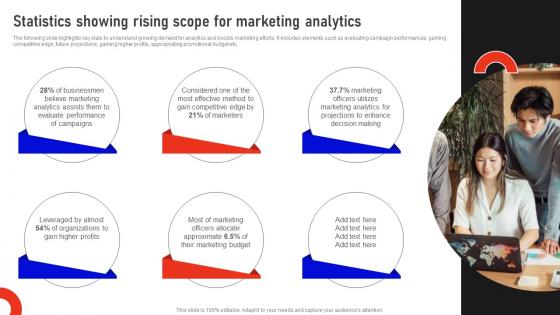 Statistics Showing Rising Scope For Marketing Analytics Marketing Data Analysis MKT SS V
The following slide highlights key stats to understand growing demand for analytics and boosts marketing efforts. It includes elements such as evaluating campaign performances, gaining competitive edge, future projections, gaining higher profits, appropriating promotional budget etc. Increase audience engagement and knowledge by dispensing information using Statistics Showing Rising Scope For Marketing Analytics Marketing Data Analysis MKT SS V This template helps you present information on six stages. You can also present information on Businessmen, Marketing Budget, Decision Making using this PPT design. This layout is completely editable so personaize it now to meet your audiences expectations.
-
 Types Of Statistical Analysis For Survey Data Interpretations
This slide showcases the various phases of survey data analysis and interpretation. The purpose of this slide is to help the researcher accurately derive conclusions and present insights after thorough analysis and research. It includes steps such as formulation of survey questions, data cleaning, data interpretation, etc. Presenting our set of slides with Types Of Statistical Analysis For Survey Data Interpretations. This exhibits information on four stages of the process. This is an easy to edit and innovatively designed PowerPoint template. So download immediately and highlight information on Regression Analysis, Cluster Analysis, Analysis Variance.
-
 Statistical Data Analysis Strategies For Machine Learning
This slide highlights statistical data analysis planning for machine learning. The purpose of this template is to provide methods for implementing statistical data analysis. The methods include linear regression, classification, resampling, tree-based and unsupervised learning. Introducing our premium set of slides with Statistical Data Analysis Strategies For Machine Learning. Ellicudate the five stages and present information using this PPT slide. This is a completely adaptable PowerPoint template design that can be used to interpret topics like Linear Regression, Tree Based Method, Classification. So download instantly and tailor it with your information.
-
 Working On Data Analysis Statistical Illustration
This colourful PowerPoint icon is perfect for presentations on working on analysis. It features a magnifying glass, a chart, and a pen, representing the process of researching and analysing data. Its a great visual aid to help explain your ideas.
-
 Agenda For Statistical Analysis For Data Driven Decision Making
Introducing Agenda For Statistical Analysis For Data Driven Decision Making to increase your presentation threshold. Encompassed with six stages, this template is a great option to educate and entice your audience. Dispence information on Statistical Analysis, Data Driven Decision Making, Healthcare, Market Research, using this template. Grab it now to reap its full benefits.
-
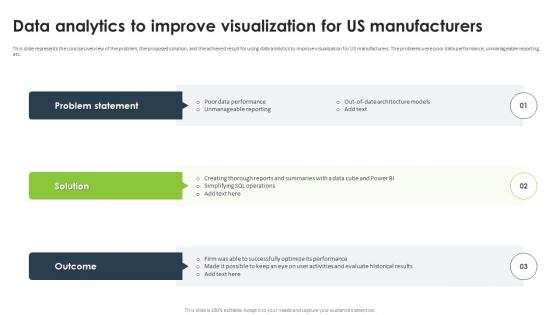 Data Analytics To Improve Visualization For Us Manufacturers Statistical Analysis For Data Driven
This slide represents the concise overview of the problem, the proposed solution, and the achieved result for using data analytics to improve visualization for US manufacturers. The problems were poor data performance, unmanageable reporting, etc. Increase audience engagement and knowledge by dispensing information using Data Analytics To Improve Visualization For Us Manufacturers Statistical Analysis For Data Driven. This template helps you present information on three stages. You can also present information on Poor Data Performance, Unmanageable Reporting, Data Analytics, Visualization For US Manufacturers using this PPT design. This layout is completely editable so personaize it now to meet your audiences expectations.
-
 Icons Slide For Statistical Analysis For Data Driven Decision Making
Introducing our well researched set of slides titled Icons Slide For Statistical Analysis For Data Driven Decision Making. It displays a hundred percent editable icons. You can use these icons in your presentation to captivate your audiences attention. Download now and use it multiple times.
-
 Statistical Analysis For Data Driven 30 60 90 Days Plan To Perform Statistical Data Analysis
This slide represents 30-60-90 plan to conduct statistical data analysis. The purpose of this slide is to illustrate the plans of the first 90 days from the start of the project including steps to be followed at interval of one month. Introducing Statistical Analysis For Data Driven 30 60 90 Days Plan To Perform Statistical Data Analysis to increase your presentation threshold. Encompassed with three stages, this template is a great option to educate and entice your audience. Dispence information on Statistical Data Analysis, Result Interpretation, Hypothesis And Plan Research Design, using this template. Grab it now to reap its full benefits.
-
 Statistical Analysis For Data Driven Before Vs After Performing Statistical Analysis
This slide shows the before vs. after comparison of statistical analysis of business data. The different aspects compared in this slide are decision-making, operational efficiency, customer insights, product quality, revenue generation, supply chain efficiency, etc. Present the topic in a bit more detail with this Statistical Analysis For Data Driven Before Vs After Performing Statistical Analysis. Use it as a tool for discussion and navigation on Decision Making, Operational Efficiency, Revenue Generation, Supply Chain Efficiency. This template is free to edit as deemed fit for your organization. Therefore download it now.
-
 Statistical Analysis For Data Driven Benefits Of Statistical Analysis Software Over Manual Analysis
This slide highlights the drawbacks of manual analysis process. The purpose of this slide is to represent how statistical analysis solves the limitations of manual analysis. The drawbacks are error in sampling, oversimplified solutions, causation, etc. Deliver an outstanding presentation on the topic using this Statistical Analysis For Data Driven Before Vs After Performing Statistical Analysis. Dispense information and present a thorough explanation of Statistical Analysis Software, Identifies Causation, Ensures Accurate Predictions using the slides given. This template can be altered and personalized to fit your needs. It is also available for immediate download. So grab it now.
-
 Statistical Analysis For Data Driven Benefits Of Using Statistical Analysis In Business
This slide discusses the advantages of statistical analysis for organizations. These benefits are cut operating costs, perform market analysis, boost workplace efficiency and improve decision making. It also outlines the examples of each advantage. Present the topic in a bit more detail with this Statistical Analysis For Data Driven Benefits Of Using Statistical Analysis In Business. Use it as a tool for discussion and navigation on Perform Market Analysis, Boost Workplace Efficiency, Improve Decision Making. This template is free to edit as deemed fit for your organization. Therefore download it now.
-
 Statistical Analysis For Data Driven Budget For Performing Statistical Data Analysis
This slide outlines the different costs involved in conducting statistical data analysis. The cost categories are software and tools, hardware and infrastructure, data collection and cleaning, personnel, reporting and documentation, data storage, etc. Deliver an outstanding presentation on the topic using this Statistical Analysis For Data Driven Budget For Performing Statistical Data Analysis. Dispense information and present a thorough explanation of Reporting And Documentation, Data Collection And Cleaning, Statistical Data Analysis using the slides given. This template can be altered and personalized to fit your needs. It is also available for immediate download. So grab it now.
-
 Statistical Analysis For Data Driven Checklist To Perform Statistical Data Analysis
This slide represents the checklist to conduct statistical data analysis. The fundamental approaches are writing hypothesis and plan research design, collect data from a sample, summarize data with descriptive statistics, test hypotheses, result interpretation, etc. Deliver an outstanding presentation on the topic using this Statistical Analysis For Data Driven Checklist To Perform Statistical Data Analysis. Dispense information and present a thorough explanation of Result Interpretation, Perform Statistical Data Analysis, Hypothesis And Plan Research Design using the slides given. This template can be altered and personalized to fit your needs. It is also available for immediate download. So grab it now.
-
 Statistical Analysis For Data Driven Comparison Between Data Analysis And Statistical Analysis
The purpose of this slide is to outline the differences between data analysis and statistical analysis. The comparison is based on several factors such as focus, tools, audience, purpose, proof and predictions, etc. Present the topic in a bit more detail with this Statistical Analysis For Data Driven Comparison Between Data Analysis And Statistical Analysis. Use it as a tool for discussion and navigation on Data Analysis, Statistical Analysis, Audience, Proof And Predictions. This template is free to edit as deemed fit for your organization. Therefore download it now.
-
 Statistical Analysis For Data Driven Criteria Used To Select Statistical Analysis Software
This slide represents the features and cost of various statistical analysis software available in the market. The purpose of this slide is to provide insights about the criteria used to select suitable statistical tool for data analytics. Deliver an outstanding presentation on the topic using this Statistical Analysis For Data Driven Criteria Used To Select Statistical Analysis Software. Dispense information and present a thorough explanation of Open Source Integration, Automated Reporting, Statistical Functions, Statistical Analysis Software using the slides given. This template can be altered and personalized to fit your needs. It is also available for immediate download. So grab it now.
-
 Statistical Analysis For Data Driven Critical Steps Involved In Statistical Analysis
This slide represents the working process of statistical data analysis. The steps involved in performing statistical analysis are data collection, data cleaning, descriptive analysis, inferential analysis, interpretation, etc. Increase audience engagement and knowledge by dispensing information using Statistical Analysis For Data Driven Critical Steps Involved In Statistical Analysis. This template helps you present information on six stages. You can also present information on Descriptive Analysis, Inferential Analysis, Data Collection, Data Cleaning, Statistical Analysis using this PPT design. This layout is completely editable so personaize it now to meet your audiences expectations.
-
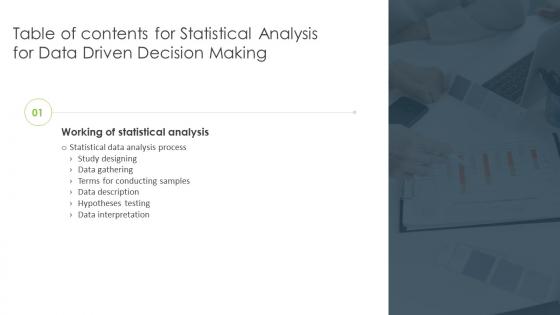 Statistical Analysis For Data Driven Decision Making For Table Of Contents
Introducing Statistical Analysis For Data Driven Decision Making For Table Of Contents to increase your presentation threshold. Encompassed with one stages, this template is a great option to educate and entice your audience. Dispence information on Study Designing, Data Gathering, Terms For Conducting Samples, Data Description, using this template. Grab it now to reap its full benefits.
-
 Statistical Analysis For Data Driven Descriptive And Inferential Methods Of Statistical Analysis
This slide represents the different techniques of descriptive and inferential statistical analysis. These are univariate, bivariate, multivariate, central limit theorem, binomial theorem, hypothesis testing, normal distribution, applied to means, etc. Increase audience engagement and knowledge by dispensing information using Statistical Analysis For Data Driven Descriptive And Inferential Methods Of Statistical Analysis. This template helps you present information on two stages. You can also present information on Statistical Analysis, Hypothesis Testing, Normal Distribution, Univariate, Bivariate using this PPT design. This layout is completely editable so personaize it now to meet your audiences expectations.
-
 Statistical Analysis For Data Driven Different Uses Of Statistical Analysis For Business
This slide outlines the different applications of statistical analysis in business. The uses of this analysis include research, modelling, pricing decisions, optimal product pricing, credit decisions, customer segmentation, and commodity forecasting. Introducing Statistical Analysis For Data Driven Different Uses Of Statistical Analysis For Business to increase your presentation threshold. Encompassed with six stages, this template is a great option to educate and entice your audience. Dispence information on Customer Segmentation, Commodity Forecasting, Pricing Decisions, Statistical Analysis For Business, using this template. Grab it now to reap its full benefits.
-
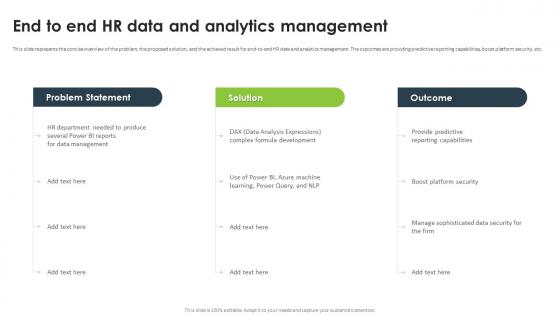 Statistical Analysis For Data Driven End To End Hr Data And Analytics Management
This slide represents the concise overview of the problem, the proposed solution, and the achieved result for end-to-end HR data and analytics management. The outcomes are providing predictive reporting capabilities, boost platform security, etc. Deliver an outstanding presentation on the topic using this Statistical Analysis For Data Driven End To End HR Data And Analytics Management. Dispense information and present a thorough explanation of Predictive Reporting Capabilities, Data Analysis Expressions, Boost Platform Security using the slides given. This template can be altered and personalized to fit your needs. It is also available for immediate download. So grab it now.
-
 Statistical Analysis For Data Driven Health Record Management Using Statistical Analysis
This slide represents the concise overview of the problem, the proposed solution, and the achieved result for using data analytics in health record management. The outcomes are plan quicker follow-ups, make more appointment bookings, etc. Deliver an outstanding presentation on the topic using this Statistical Analysis For Data Driven Health Record Management Using Statistical Analysis. Dispense information and present a thorough explanation of Health Record Management, Statistical Analysis, Data Analytics, Constrained Development Possibilities using the slides given. This template can be altered and personalized to fit your needs. It is also available for immediate download. So grab it now.
-
 Statistical Analysis For Data Driven Identifying Need For Statistical Analysis Plan
This slide demonstrates the importance of Statistical Analysis Plan SAP. The components of this slide are sufficiency of protocol description, complexity demands, initial application evaluation and detailed analysis instructions. Increase audience engagement and knowledge by dispensing information using Statistical Analysis For Data Driven Identifying Need For Statistical Analysis Plan. This template helps you present information on four stages. You can also present information on Sufficiency Of Protocol Description, Initial Application Evaluation, Detailed Analysis Instructions using this PPT design. This layout is completely editable so personaize it now to meet your audiences expectations.
-
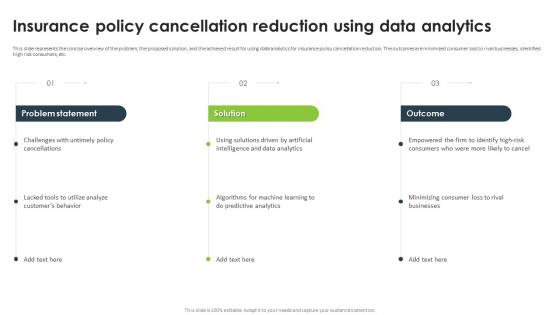 Statistical Analysis For Data Driven Insurance Policy Cancellation Reduction Using Data Analytics
This slide represents the concise overview of the problem, the proposed solution, and the achieved result for using data analytics for insurance policy cancellation reduction. The outcomes are minimized consumer loss to rival businesses, identified high risk consumers, etc. Deliver an outstanding presentation on the topic using this Statistical Analysis For Data Driven Insurance Policy Cancellation Reduction Using Data Analytics. Dispense information and present a thorough explanation of Insurance Policy Cancellation, Reduction Using Data Analytics, Identified High Risk Consumers using the slides given. This template can be altered and personalized to fit your needs. It is also available for immediate download. So grab it now.
-
 Statistical Analysis For Data Driven Key Components Of Statistical Analysis Plan
This slide outlines the various sections of Statistical Analysis Plan SAP. The components include document information, sample size calculation, analysis goals and objectives, outcome measures, data analysis procedures, statistical significance, etc. Present the topic in a bit more detail with this Statistical Analysis For Data Driven Key Components Of Statistical Analysis Plan. Use it as a tool for discussion and navigation on Analysis Goals And Objectives, Statistical Significance, Protocol Variations And Compliance, Presentation Of Results. This template is free to edit as deemed fit for your organization. Therefore download it now.
-
 Statistical Analysis For Data Driven Key Statistical Terms For Conducting Samples
The purpose of this slide is to outline the statistical measures involved in sampling data for analytical processes. These terms are population standard deviation, statistical power, expected effect size, significance level, etc. Deliver an outstanding presentation on the topic using this Statistical Analysis For Data Driven Key Statistical Terms For Conducting Samples. Dispense information and present a thorough explanation of Population Standard Deviation, Predetermined Threshold, Probability Of Rejecting A Null Hypothesis using the slides given. This template can be altered and personalized to fit your needs. It is also available for immediate download. So grab it now.
-
 Statistical Analysis For Data Driven Methods To Perform Statistical Analysis Of Data
This slide demonstrates the different methods employed to perform statistical analysis of business data, which helps in deriving various patterns. These include mean, regression, standard deviation, hypothesis testing, and sample size distribution. Introducing Statistical Analysis For Data Driven Methods To Perform Statistical Analysis Of Data to increase your presentation threshold. Encompassed with five stages, this template is a great option to educate and entice your audience. Dispence information on Hypothesis Testing, Sample Size Determination, Statistical Analysis Of Data, Standard Deviation, using this template. Grab it now to reap its full benefits.
-
 Statistical Analysis For Data Driven Overview Of Different Types Of Statistical Analysis
This slide outlines the various types of statistical analysis. These are mechanistic analysis, descriptive statistical analysis, inferential statistical analysis, predictive statistical analysis, prescriptive statistical analysis, exploratory data analysis, etc. Increase audience engagement and knowledge by dispensing information using Statistical Analysis For Data Driven Overview Of Different Types Of Statistical Analysis. This template helps you present information on nine stages. You can also present information on Inferential Statistical Analysis, Descriptive Statistical Analysis, Prescriptive Statistical Analysis, Regression Analysis using this PPT design. This layout is completely editable so personaize it now to meet your audiences expectations.
-
 Statistical Analysis For Data Driven Ppdac Cycle Of Statistical Analysis Process
This slide showcases the PPDAC Problem Plan Data Analysis Conclusion model of statistical data analysis. The purpose of this slide is to briefly explain the five stages of statistical analysis lifecycle, which are problem, plan, data, analysis, and conclusion. Introducing Statistical Analysis For Data Driven Ppdac Cycle Of Statistical Analysis Process to increase your presentation threshold. Encompassed with five stages, this template is a great option to educate and entice your audience. Dispence information on Result Interpretation, Communication, Data Collection, Data Management, using this template. Grab it now to reap its full benefits.
-
 Statistical Analysis For Data Driven Roadmap For Step By Step Statistical Data Analysis Process
This slide shows the timeline for performing statistical data analysis. The key steps include writing hypothesis and plan research design, collect data from a sample, summarize data with descriptive statistics, test hypotheses, result interpretation, etc. Increase audience engagement and knowledge by dispensing information using Statistical Analysis For Data Driven Roadmap For Step By Step Statistical Data Analysis Process. This template helps you present information on four stages. You can also present information on Statistical Data Analysis Process, Test Hypotheses, Result Interpretation, Plan Research Design using this PPT design. This layout is completely editable so personaize it now to meet your audiences expectations.
-
 Statistical Analysis For Data Driven Statistical Analysis Challenges And Possible Solutions
The purpose of this slide is to discuss the limitations of statistical analysis and their possible solutions. The challenges of statistical analytics are data integration and quality, skill gap, scalability, data security and budget constraints. Deliver an outstanding presentation on the topic using this Statistical Analysis For Data Driven Statistical Analysis Challenges And Possible Solutions. Dispense information and present a thorough explanation of Data Integration And Quality, Statistical Analysis Challenges, Data Security, Budget Constraints using the slides given. This template can be altered and personalized to fit your needs. It is also available for immediate download. So grab it now.
-
 Statistical Analysis For Data Driven Statistical Analysis Impact On Business Performance
This slide illustrates the business impact of performing statistical analysis. The parameters described in this slide are data-driven decision-making, operational efficiency, customer insights, quality control, revenue optimization, risk management, etc. Present the topic in a bit more detail with this Statistical Analysis For Data Driven Statistical Analysis Impact On Business Performance. Use it as a tool for discussion and navigation on Data Driven Decision Making, Revenue Optimization, Operational Efficiency, Business Performance. This template is free to edit as deemed fit for your organization. Therefore download it now.
-
 Statistical Analysis For Data Driven Statistical Analysis Plan Overview And Components
This slide discusses the overview of Statistical Analysis Plan SAP. The purpose of this slide is to highlight the components of Statistical Analysis Plan, such as endpoints, both primary and secondary, methods of analysis, comparisons, significance levels, etc. Deliver an outstanding presentation on the topic using this Statistical Analysis For Data Driven Statistical Analysis Plan Overview And Components. Dispense information and present a thorough explanation of Comparisons And Significance Levels, Exploratory Data Analyses, Statistical Analysis Plan using the slides given. This template can be altered and personalized to fit your needs. It is also available for immediate download. So grab it now.
-
 Statistical Analysis For Data Driven Statistical Analysis Software Features And Benefits
The purpose of this slide is to outline the different software used to perform statistical analysis. This slide represents the primary features and benefits of various statistical software available in the market. Present the topic in a bit more detail with this Statistical Analysis For Data Driven Statistical Analysis Software Features And Benefits. Use it as a tool for discussion and navigation on Statistical Analysis Software, Future Proof Data Analysis, Support For Regression Analysis, Time Series Analysis. This template is free to edit as deemed fit for your organization. Therefore download it now.
-
 Statistical Analysis For Data Driven Statistical Analysis Training Program For Beginners
This slide represents the training program for performing statistical data analysis. The purpose of this slide is to outline the mode, cost, agenda, and schedule for the training programs. Deliver an outstanding presentation on the topic using this Statistical Analysis For Data Driven Statistical Analysis Training Program For Beginners. Dispense information and present a thorough explanation of Statistical Analysis Training, Program For Beginners, Training Programs, Performing Statistical Data Analysis using the slides given. This template can be altered and personalized to fit your needs. It is also available for immediate download. So grab it now.
-
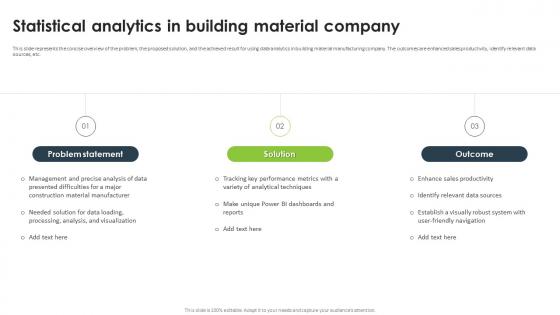 Statistical Analysis For Data Driven Statistical Analytics In Building Material Company
This slide represents the concise overview of the problem, the proposed solution, and the achieved result for using data analytics in building material manufacturing company. The outcomes are enhanced sales productivity, identify relevant data sources, etc. Introducing Statistical Analysis For Data Driven Statistical Analytics In Building Material Company to increase your presentation threshold. Encompassed with three stages, this template is a great option to educate and entice your audience. Dispence information on Statistical Analytics, Building Material Company, Identify Relevant Data Sources, Enhanced Sales Productivity, using this template. Grab it now to reap its full benefits.
-
 Statistical Analysis For Data Driven Statistical Analytics In Food Processing Outlet
This slide represents the concise overview of the problem, the proposed solution, and the achieved result for using data analytics in food processing outlet. The outcomes are precise food quantity forecasts, optimized resource allocation, etc. Increase audience engagement and knowledge by dispensing information using Statistical Analysis For Data Driven Statistical Analytics In Food Processing Outlet. This template helps you present information on three stages. You can also present information on Statistical Analytics, Food Processing Outlet, Optimized Resource Allocation, Data Analytics using this PPT design. This layout is completely editable so personaize it now to meet your audiences expectations.
-
 Statistical Analysis For Data Driven Statistical And Data Analysis Techniques Used In Different Domains
This slide outlines the statistical and data analysis methods applied in different fields. These domains are spatial models, time series, survival analysis, market segmentation, recommendation systems, attribution modeling, clustering, etc. Present the topic in a bit more detail with this Statistical Analysis For Data Driven Statistical And Data Analysis Techniques Used In Different Domains. Use it as a tool for discussion and navigation on Recommendation Systems, Survival Analysis, Market Segmentation, Predictive Modeling. This template is free to edit as deemed fit for your organization. Therefore download it now.
-
 Statistical Analysis For Data Driven Statistical Data Analysis Process Hypotheses Testing
The purpose of this slide is to demonstrate the hypothesis testing phase of statistical data analysis. The different steps involved in this phase are hypothesis formulation, analysis plan, collect and analyse sample data and result evaluation. Introducing Statistical Analysis For Data Driven Statistical Data Analysis Process Hypotheses Testing to increase your presentation threshold. Encompassed with four stages, this template is a great option to educate and entice your audience. Dispence information on Hypothesis Formulation, Analysis Plan, Hypotheses Testing, Statistical Data Analysis Process, using this template. Grab it now to reap its full benefits.
-
 Statistical Analysis For Data Driven Tasks Performed By Statistical Data Analysis
This slide demonstrates the major activities involved in statistical analysis. These are offers insight into complex data, informs the decision-making process, assesses hypotheses, evaluates the efficacy of interventions and supports predictive modeling. Increase audience engagement and knowledge by dispensing information using Statistical Analysis For Data Driven Tasks Performed By Statistical Data Analysis. This template helps you present information on five stages. You can also present information on Tasks Performed, Statistical Data Analysis, Supports Predictive Modeling, Assesses Hypotheses using this PPT design. This layout is completely editable so personaize it now to meet your audiences expectations.
-
 Statistical Analysis For Data Driven Timeline To Conduct Statistical Data Analysis
This slide shows the timeline for performing statistical data analysis. The key steps include writing hypothesis and plan research design, collect data from a sample, summarize data with descriptive statistics, test hypotheses, result interpretation, etc. Introducing Statistical Analysis For Data Driven Timeline To Conduct Statistical Data Analysis to increase your presentation threshold. Encompassed with five stages, this template is a great option to educate and entice your audience. Dispence information on Statistical Data Analysis, Test Hypotheses, Result Interpretation, Plan Research Design, using this template. Grab it now to reap its full benefits.
-
 Statistical Analysis For Data Driven Understanding The Concept Of Statistical Data Analysis
The purpose of this slide is to discuss the statistical data analysis. This slide highlights the key tasks performed by the statistical analysis of data for several benefits. These tasks are quantification, variability and confidence level associated with these variations. Increase audience engagement and knowledge by dispensing information using Statistical Analysis For Data Driven Understanding The Concept Of Statistical Data Analysis. This template helps you present information on two stages. You can also present information on Statistical Data Analysis, Variability And Confidence Level, Associated With These Variations using this PPT design. This layout is completely editable so personaize it now to meet your audiences expectations.
-
 Statistical Data Analysis Process Data Description Statistical Analysis For Data Driven
This slide discusses the data description phase of statistical analysis, which includes methods such as scatter plot, bar chart, frequency distribution, etc. This slide also outlines the different types of skewed distribution techniques. Deliver an outstanding presentation on the topic using this Statistical Data Analysis Process Data Description Statistical Analysis For Data Driven. Dispense information and present a thorough explanation of Statistical Data Analysis Process, Data Description, Skewed Distribution Techniques, Bar Chart using the slides given. This template can be altered and personalized to fit your needs. It is also available for immediate download. So grab it now.
-
 Statistical Data Analysis Process Data Gathering Statistical Analysis For Data Driven
This slide discusses the data-gathering phase of the statistical data analysis process. The purpose of this slide is to outline reliable and non-reliable sampling methods, such as simple random, stratified random, cluster random, voluntary response, etc. Present the topic in a bit more detail with this Statistical Data Analysis Process Data Gathering Statistical Analysis For Data Driven. Use it as a tool for discussion and navigation on Statistical Data Analysis Process, Data Gathering, Stratified Random, Cluster Random, Voluntary Response. This template is free to edit as deemed fit for your organization. Therefore download it now.
-
 Statistical Data Analysis Process Data Interpretation Statistical Analysis For Data Driven
This slide represents the data interpretation phase of statistical analysis. The steps involved are compare P-value to significance level, assess probability, answer original questions, defend against objections, acknowledge limitations, iterate, etc. Deliver an outstanding presentation on the topic using this Statistical Data Analysis Process Data Interpretation Statistical Analysis For Data Driven. Dispense information and present a thorough explanation of Statistical Data Analysis Process, Data Interpretation, Acknowledge Limitations, Determine Statistical Significance using the slides given. This template can be altered and personalized to fit your needs. It is also available for immediate download. So grab it now.
-
 Statistical Data Analysis Process Study Designing Statistical Analysis For Data Driven
This slide discusses the study designing phase of statistical data analysis. The purpose of this slide is to outline the statistical tests used in different research designs, such as descriptive design, correlational design, and experimental design. Present the topic in a bit more detail with this Statistical Data Analysis Process Study Designing Statistical Analysis For Data Driven. Use it as a tool for discussion and navigation on Statistical Data Analysis Process, Study Designing, Correlational Design, Experimental Design. This template is free to edit as deemed fit for your organization. Therefore download it now.
-
 Table Of Contents For Statistical Analysis For Data Driven Decision Making
Introducing Table Of Contents For Statistical Analysis For Data Driven Decision Making to increase your presentation threshold. Encompassed with thirteen stages, this template is a great option to educate and entice your audience. Dispence information on Working Of Statistical Analysis, Monitoring Dashboards, Statistical Analysis Plan, Training And Budget, using this template. Grab it now to reap its full benefits.
-
 Introduction To Data Integration With Key Statistics Marketing Technology Stack Analysis
Following slide provides information about the concept of data integration in marketing. It includes key elements such as description, key statistics, advantages, and limitations. Deliver an outstanding presentation on the topic using this Introduction To Data Integration With Key Statistics Marketing Technology Stack Analysis Dispense information and present a thorough explanation of Organization Data, Efficiency, Increased Productivity using the slides given. This template can be altered and personalized to fit your needs. It is also available for immediate download. So grab it now.
-
 Benefit Data Analysis Icon Showcasing Statistics
Introducing our premium set of slides with Benefit Data Analysis Icon Showcasing Statistics Ellicudate the three stages and present information using this PPT slide. This is a completely adaptable PowerPoint template design that can be used to interpret topics like Benefit Data Analysis, Showcasing Statistics So download instantly and tailor it with your information.


