Powerpoint Templates and Google slides for Data Showing
Save Your Time and attract your audience with our fully editable PPT Templates and Slides.
-
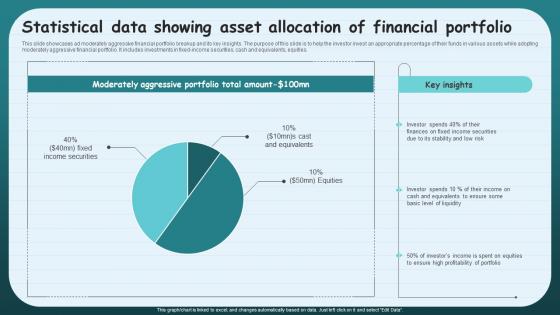 Statistical Data Showing Asset Allocation Of Financial Portfolio
This slide showcases ad moderately aggressive financial portfolio breakup and its key insights. The purpose of this slide is to help the investor invest an appropriate percentage of their funds in various assets while adopting moderately aggressive financial portfolio. It includes investments in fixed income securities, cash and equivalents, equities. Presenting our well structured Statistical Data Showing Asset Allocation Of Financial Portfolio. The topics discussed in this slide are Moderately Aggressive Portfolio, Basic Level Of Liquidity.This is an instantly available PowerPoint presentation that can be edited conveniently. Download it right away and captivate your audience.
-
 Stats Showing Adoption Of Big Data By Finance Professionals
The following slide illustrates the adoption statistics of big data among accounting professionals, highlighting points such as AI-based automation, potential for business growth, and integration of new technologies, aiding organizations in understanding the industry landscape. Introducing our Stats Showing Adoption Of Big Data By Finance Professionals set of slides. The topics discussed in these slides are Grow Business, Client Relationships, Technology Adopters. This is an immediately available PowerPoint presentation that can be conveniently customized. Download it and convince your audience.
-
 Dashboard Showcasing Big Data Analytics In E Commerce
This slide showcases the dashboard showcasing big data analytics in e-commerce which helps an organization to boost marketing and ensure predictive modeling, scoring. It include details such as balance of account, new consumers, total sales, orders, etc. Presenting our well structured Dashboard Showcasing Big Data Analytics In E Commerce. The topics discussed in this slide are Balance Of Account, New Consumers, Breakdown Of Orders. This is an instantly available PowerPoint presentation that can be edited conveniently. Download it right away and captivate your audience.
-
 Assessing Patient No Show Appointments Definitive Guide To Implement Data Analytics SS
This slide showcases dashboard for tracking patient no show appointments which helps in identifying reasons for rescheduling appointments. It provides information regarding late cancellations, no show appointment per clinic, telemed appointments, longer waiting times, bed occupancy rate etc. Present the topic in a bit more detail with this Assessing Patient No Show Appointments Definitive Guide To Implement Data Analytics SS. Use it as a tool for discussion and navigation on Analyze, Dashboard, Psychological Factors, Transportation. This template is free to edit as deemed fit for your organization. Therefore download it now.
-
 Graph Showing Organization Data Strategy Framework
This slide illustrates data strategy framework and includes market drivers and key factors. Deliver an outstanding presentation on the topic using this Graph Showing Organization Data Strategy Framework. Dispense information and present a thorough explanation of Foster Innovation, Least Used Method, Market Drivers, Key Factors using the slides given. This template can be altered and personalized to fit your needs. It is also available for immediate download. So grab it now.
-
 Kpi Dashboard Showcasing Cybersecurity In Big Data Analytics
This slide highlights big data analytics cybersecurity threats showcasing KPI dashboard for user awareness against insecure systems. It further covers risk and compliance, threat detection, top threat by class, security control table, etc. Presenting our well structured Kpi Dashboard Showcasing Cybersecurity In Big Data Analytics. The topics discussed in this slide are KPI Dashboard, Showcasing Cybersecurity, Big Data Analytics, Security Control Table. This is an instantly available PowerPoint presentation that can be edited conveniently. Download it right away and captivate your audience.
-
 Product Bundling Dashboard Showcasing Sales Data
This slide depicts a dashboard highlighting sales strategic decision-making and performance evaluation. Presenting our well structured Product Bundling Dashboard Showcasing Sales Data. The topics discussed in this slide are Product Bundling Dashboard, Showcasing Sales Data. This is an instantly available PowerPoint presentation that can be edited conveniently. Download it right away and captivate your audience.
-
 Statistics Showcasing Benefits Of Data Visualization
This slide showcases the statistics representing benefits of data visualization which helps an organization to provide deeper insights of conditions occurring within different information sets. It include details such as provides actionable items, etc. Introducing our Statistics Showcasing Benefits Of Data Visualization set of slides. The topics discussed in these slides are Data Visualization, Statistics Showcasing, Actionable ItemsThis is an immediately available PowerPoint presentation that can be conveniently customized. Download it and convince your audience.
-
 Statistics Showcasing Detailed Employee Exit Data
This slide showcases report about employee leaving an organization with overall satisfaction. It includes aspects related to surveys completed, training and development, monthly exits, etc. Introducing our Statistics Showcasing Detailed Employee Exit Data set of slides. The topics discussed in these slides are Exiting Employees, Completed Surveys, Leaving For New JobThis is an immediately available PowerPoint presentation that can be conveniently customized. Download it and convince your audience.
-
 Collate data payroll source ppt powerpoint presentation show microsoft cpb
Presenting Collate Data Payroll Source Ppt Powerpoint Presentation Show Microsoft Cpb slide which is completely adaptable. The graphics in this PowerPoint slide showcase four stages that will help you succinctly convey the information. In addition, you can alternate the color, font size, font type, and shapes of this PPT layout according to your content. This PPT presentation can be accessed with Google Slides and is available in both standard screen and widescreen aspect ratios. It is also a useful set to elucidate topics like Collate Data Payroll Source. This well structured design can be downloaded in different formats like PDF, JPG, and PNG. So, without any delay, click on the download button now.
-
 Analytical tools data analysis ppt powerpoint presentation show picture cpb
Presenting Analytical Tools Data Analysis Ppt Powerpoint Presentation Show Picture Cpb slide which is completely adaptable. The graphics in this PowerPoint slide showcase four stages that will help you succinctly convey the information. In addition, you can alternate the color, font size, font type, and shapes of this PPT layout according to your content. This PPT presentation can be accessed with Google Slides and is available in both standard screen and widescreen aspect ratios. It is also a useful set to elucidate topics like Analytical Tools Data Analysis. This well structured design can be downloaded in different formats like PDF, JPG, and PNG. So, without any delay, click on the download button now.
-
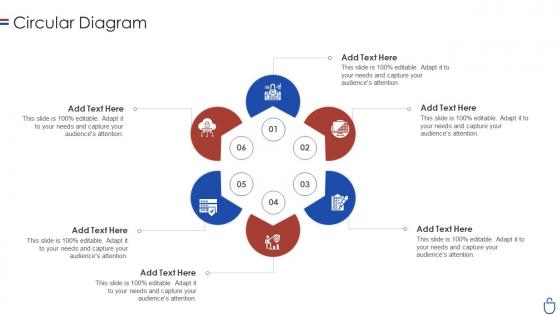 Data security it circular diagram ppt slides show
Introducing Data Security IT Circular Diagram Ppt Slides Show to increase your presentation threshold. Encompassed with six stages, this template is a great option to educate and entice your audience. Dispence information on Circular Diagram, using this template. Grab it now to reap its full benefits.
-
 Selling research data ppt powerpoint presentation summary show cpb
Presenting our Selling Research Data Ppt Powerpoint Presentation Summary Show Cpb PowerPoint template design. This PowerPoint slide showcases six stages. It is useful to share insightful information on Selling Research Data This PPT slide can be easily accessed in standard screen and widescreen aspect ratios. It is also available in various formats like PDF, PNG, and JPG. Not only this, the PowerPoint slideshow is completely editable and you can effortlessly modify the font size, font type, and shapes according to your wish. Our PPT layout is compatible with Google Slides as well, so download and edit it as per your knowledge.
-
 Managing data science projects ppt powerpoint presentation show example cpb
Presenting Managing Data Science Projects Ppt Powerpoint Presentation Show Example Cpb slide which is completely adaptable. The graphics in this PowerPoint slide showcase four stages that will help you succinctly convey the information. In addition, you can alternate the color, font size, font type, and shapes of this PPT layout according to your content. This PPT presentation can be accessed with Google Slides and is available in both standard screen and widescreen aspect ratios. It is also a useful set to elucidate topics like Managing Data Science Projects. This well-structured design can be downloaded in different formats like PDF, JPG, and PNG. So, without any delay, click on the download button now.
-
 Icon Showing Data Insights At Edge Analytics
Presenting our set of slides with Icon Showing Data Insights At Edge Analytics. This exhibits information on four stages of the process. This is an easy to edit and innovatively designed PowerPoint template. So download immediately and highlight information on Icon Showing Data, Insights At Edge Analytics.
-
 Statistics Showing Industry Employee Engagement Data Effective Employee Engagement
The following slide reveals employee engagement industry insights to assess market condition. It includes facts related to percentage of employees disengaged at workplace, cost incurred due to poor engagement, profitability due to high participation etc. Increase audience engagement and knowledge by dispensing information using Statistics Showing Industry Employee Engagement Data Effective Employee Engagement. This template helps you present information on six stages. You can also present information on Employees Lies Between, Organizations, Workplace Culture using this PPT design. This layout is completely editable so personaize it now to meet your audiences expectations.
-
 F1656 Dark Data And Its Utilization Table Of Contents Ppt Show Example Introduction
Introducing F1656 Dark Data And Its Utilization Table Of Contents Ppt Show Example Introduction to increase your presentation threshold. Encompassed with one stages, this template is a great option to educate and entice your audience. Dispence information on Utilization, Information, Technology, using this template. Grab it now to reap its full benefits.
-
 Table Of Contents For Dark Data And Its Utilization Ppt Show Designs Download
Introducing Table Of Contents For Dark Data And Its Utilization Ppt Show Designs Download to increase your presentation threshold. Encompassed with nine stages, this template is a great option to educate and entice your audience. Dispence information on Overview Of Dark Data, Challenges With Dark Data, Case Studies And Examples, using this template. Grab it now to reap its full benefits.
-
 Financial Data Science Icon Showcasing Market Analysis
Introducing our Financial Data Science Icon Showcasing Market Analysis set of slides. The topics discussed in these slides are Financial Data Science Icon, Showcasing Market Analysis. This is an immediately available PowerPoint presentation that can be conveniently customized. Download it and convince your audience.
-
 Text Mining System Showcasing Data Analysis Icon
Introducing our premium set of slides with Text Mining System Showcasing Data Analysis Icon. Ellicudate the Three stages and present information using this PPT slide. This is a completely adaptable PowerPoint template design that can be used to interpret topics like Text Mining System, Showcasing Data Analysis Icon. So download instantly and tailor it with your information.
-
 Big Data Marketing Statistics Showing Rising Scope For Marketing Analytics MKT SS V
The following slide highlights key stats to understand growing demand for analytics and boosts marketing efforts. It includes elements such as evaluating campaign performances, gaining competitive edge, future projections, gaining higher profits, appropriating promotional budget etc. Introducing Big Data Marketing Statistics Showing Rising Scope For Marketing Analytics MKT SS V to increase your presentation threshold. Encompassed with Six stages, this template is a great option to educate and entice your audience. Dispence information on Performance Of Campaigns, Higher Profits, Marketing Budget using this template. Grab it now to reap its full benefits.
-
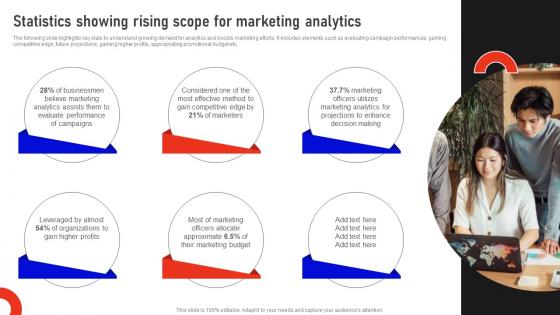 Statistics Showing Rising Scope For Marketing Analytics Marketing Data Analysis MKT SS V
The following slide highlights key stats to understand growing demand for analytics and boosts marketing efforts. It includes elements such as evaluating campaign performances, gaining competitive edge, future projections, gaining higher profits, appropriating promotional budget etc. Increase audience engagement and knowledge by dispensing information using Statistics Showing Rising Scope For Marketing Analytics Marketing Data Analysis MKT SS V This template helps you present information on six stages. You can also present information on Businessmen, Marketing Budget, Decision Making using this PPT design. This layout is completely editable so personaize it now to meet your audiences expectations.
-
 Icon Showing Online Data Theft By Hacker
Presenting our set of slides with Icon Showing Online Data Theft By Hacker. This exhibits information on three stages of the process. This is an easy to edit and innovatively designed PowerPoint template. So download immediately and highlight information on Online, Data, Hacker.
-
 Stats Showing Adoption Of Big Data By Accounting Professionals
The following slide illustrates the adoption statistics of big data among accounting professionals, highlighting points such as AI-based automation, potential for business growth, and integration of new technologies, aiding organizations in understanding the industry landscape Presenting our set of slides with Stats Showing Adoption Of Big Data By Accounting Professionals. This exhibits information on six stages of the process. This is an easy to edit and innovatively designed PowerPoint template. So download immediately and highlight information on Automation Based, Grow Business, Client Relationships.
-
 Customer Data Platform Adoption Process Timeline Showing Expected Results Post CDP
The following slide depicts milestone timeline highlighting projected benefits after CSP execution to facilitate investment decision and formulate strategies. It includes elements such as accurate performance tracking, personalized campaign, grabbing opportunities, data driven decisions etc. Introducing Customer Data Platform Adoption Process Timeline Showing Expected Results Post CDP to increase your presentation threshold. Encompassed with four stages, this template is a great option to educate and entice your audience. Dispence information on Demographics, Enhancement, Management, using this template. Grab it now to reap its full benefits.
-
 Statistical Data Showcasing Technological Usage For Employee Marketing
This slide showcases the marketing trends to increase employee engagement using artificial intelligence which helps an organization to reach towards goals efficiently. It include details such as gamified AI to generate employee participation, gamified AI for employee voice, etc. Introducing our Statistical Data Showcasing Technological Usage For Employee Marketing set of slides. The topics discussed in these slides are Statistical Data, Showcasing Technological, Employee Marketing. This is an immediately available PowerPoint presentation that can be conveniently customized. Download it and convince your audience.
-
 Data Migration Plan Icon Showing Files Transfer
Introducing our Data Migration Plan Icon Showing Files Transfer set of slides. The topics discussed in these slides are Data Migration Plan, Showing Files Transfer. This is an immediately available PowerPoint presentation that can be conveniently customized. Download it and convince your audience.
-
 Icon Showing Strategic Data Analytics For Enhanced Internal Audits
Introducing our Icon Showing Strategic Data Analytics For Enhanced Internal Audits set of slides. The topics discussed in these slides are Showing Strategic Data, Analytics Enhanced Internal. This is an immediately available PowerPoint presentation that can be conveniently customized. Download it and convince your audience.
-
 Timeline Showing Expected Results Post CDP Implementation Gathering Real Time Data With CDP Software MKT SS V
The following slide depicts milestone timeline highlighting projected benefits after CSP execution to facilitate investment decision and formulate strategies. It includes elements such as accurate performance tracking, personalized campaign, grabbing opportunities, data driven decisions etc. Increase audience engagement and knowledge by dispensing information using Timeline Showing Expected Results Post CDP Implementation Gathering Real Time Data With CDP Software MKT SS V. This template helps you present information on Four stages. You can also present information on Testing And Enhancement, Products, Personalized Campaign Management using this PPT design. This layout is completely editable so personaize it now to meet your audiences expectations.
-
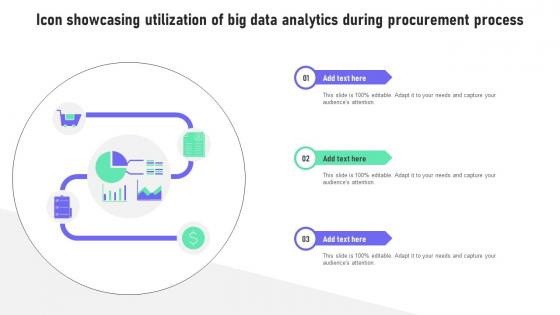 Icon Showcasing Utilization Of Big Data Analytics During Procurement Process
Presenting Our Set Of Slides With Icon Showcasing Utilization Of Big Data Analytics During Procurement Process. This Exhibits Information On Three Stages Of The Process. This Is An Easy To Edit And Innovatively Designed Powerpoint Template. So Download Immediately And Highlight Information On Utilization, Analytics, Procurement Process.
-
 Icon Showing Data Analytics Chart For Estimating Companies Outcomes
Presenting our well structured Icon Showing Data Analytics Chart For Estimating Companies Outcomes. The topics discussed in this slide are Icon Showing Data, Analytics Chart, Estimating Companies Outcomes. This is an instantly available PowerPoint presentation that can be edited conveniently. Download it right away and captivate your audience.
-
 Data Centre Colocations Icon Showing Shared Network
Introducing our premium set of slides with Data Centre Colocations Icon Showing Shared Network Ellicudate the Three stages and present information using this PPT slide. This is a completely adaptable PowerPoint template design that can be used to interpret topics like Data Centre Colocations Icon, Showing Shared Network So download instantly and tailor it with your information.
-
 App Development Technologies Icon Showcasing Data Transfer
Introducing our premium set of slides with App Development Technologies Icon Showcasing Data Transfer Ellicudate the three stages and present information using this PPT slide. This is a completely adaptable PowerPoint template design that can be used to interpret topics like App Development, Technologies, Icon Showcasing, Data Transfer So download instantly and tailor it with your information.
-
 Cloud Virtualization Icon Showcasing Data Security
Presenting our set of slides with name Cloud Virtualization Icon Showcasing Data Security This exhibits information on Threestages of the process. This is an easy to edit and innovatively designed PowerPoint template. So download immediately and highlight information on Cloud Virtualization Icon, Showcasing Data Security
-
 System Integration Icon Showcasing Data Management
Presenting our set of slides with name System Integration Icon Showcasing Data Management. This exhibits information on one stages of the process. This is an easy to edit and innovatively designed PowerPoint template. So download immediately and highlight information on System Integration, Icon Showcasing, Data Management.
-
 E Commerce Big Data Analytics Icon Showcasing Online Shopping
Presenting our set of slides with E Commerce Big Data Analytics Icon Showcasing Online Shopping. This exhibits information on three stages of the process. This is an easy to edit and innovatively designed PowerPoint template. So download immediately and highlight information on E-Commerce, Big Data Analytics Icon, Showcasing Online Shopping.
-
 Survey Findings Showing Patient Expectations Definitive Guide To Implement Data Analytics SS
This slide highlights patient requirements from hospitals which helps in improving healthcare staff performance and enhance quality of care. It includes elements such as shorter wait times, advanced communication, schedule appointments accurate diagnosis, respectful treatment, emergency room availability etc. Present the topic in a bit more detail with this Survey Findings Showing Patient Expectations Definitive Guide To Implement Data Analytics SS. Use it as a tool for discussion and navigation on Emergency Room Availability, Communication, Treatment Costs, Allocation And Treatment Diagnosis. This template is free to edit as deemed fit for your organization. Therefore download it now.
-
 Icon Showcasing Data Discovery Using Blockchain Intelligence
Presenting our set of slides with Icon Showcasing Data Discovery Using Blockchain Intelligence This exhibits information on three stages of the process. This is an easy to edit and innovatively designed PowerPoint template. So download immediately and highlight information on Icon Showcasing, Data Discovery Using, Blockchain Intelligence
-
 Benefit Data Analysis Icon Showcasing Statistics
Introducing our premium set of slides with Benefit Data Analysis Icon Showcasing Statistics Ellicudate the three stages and present information using this PPT slide. This is a completely adaptable PowerPoint template design that can be used to interpret topics like Benefit Data Analysis, Showcasing Statistics So download instantly and tailor it with your information.
-
 Data Analytics Dashboard Benefits Icon Showcasing Status
Introducing our premium set of slides with Data Analytics Dashboard Benefits Icon Showcasing Status Ellicudate the three stages and present information using this PPT slide. This is a completely adaptable PowerPoint template design that can be used to interpret topics like Data Analytics, Dashboard Benefits, Showcasing Status So download instantly and tailor it with your information.
-
 Data Analytics Candle Chart Icon Showing Industrial Growth
Presenting our set of slides with Data Analytics Candle Chart Icon Showing Industrial Growth This exhibits information on three stages of the process. This is an easy to edit and innovatively designed PowerPoint template. So download immediately and highlight information on Data Analytics Candle Chart, Icon Showing Industrial Growth
-
 Financial Data Analytics Icon Showing Industrial Growth
Introducing our premium set of slides with Financial Data Analytics Icon Showing Industrial Growth Ellicudate the three stages and present information using this PPT slide. This is a completely adaptable PowerPoint template design that can be used to interpret topics like Financial Data Analytics Icon, Showing Industrial Growth So download instantly and tailor it with your information.
-
 Checklist Showcasing Digital Business Leveraging Digital Analytics To Develop Data Analytics SS
This slide highlights various factors which need to be considered before implementing digital analytics in business. It provides information regarding data security, governance, resource availability and technological environment. Introducing Checklist Showcasing Digital Business Leveraging Digital Analytics To Develop Data Analytics SS to increase your presentation threshold. Encompassed with four stages, this template is a great option to educate and entice your audience. Dispence information on Data Governance, Resource Availability, Technological Environment, using this template. Grab it now to reap its full benefits.
-
 Choosing method of data collection powerpoint show
Presenting choosing method of data collection powerpoint show. This is a choosing method of data collection powerpoint show. This is a five stage process. The stages in this process are choosing an area of research, review of studies, sources of feedback, complete proposal, choosing method of data collection.
-
 Sales process improvement data flow powerpoint slide show
Presenting sales process improvement data flow powerpoint slide show. This is a sales process improvement data flow powerpoint slide show. This is a three stage process. The stages in this process are tasks, events, calls, emails, activities, campaigns, lead, optional opportunity, contact, account.
-
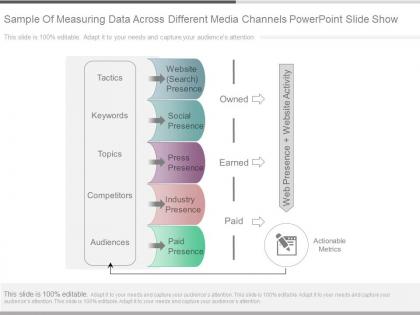 Sample of measuring data across different media channels powerpoint slide show
Presenting sample of measuring data across different media channels powerpoint slide show. This is a sample of measuring data across different media channels powerpoint slide show. This is a five stage process. The stages in this process are tactics, keywords, topics, competitors, audiences, website search presence, social presence, press presence, industry presence, paid presence, owned, earned, paid, web presence, website activity, actionable metrics.
-
 Concealed data aggregation template powerpoint show
Presenting concealed data aggregation template powerpoint show. This is a concealed data aggregation template powerpoint show. This is a four stage process. The stages in this process are decisions, service access, reliability performance, authorization.
-
 Business data intelligence and analytics powerpoint show
Presenting business data intelligence and analytics powerpoint show. This is a business data intelligence and analytics powerpoint show. This is a five stage process. The stages in this process are business app, scenario and devices, automated systems, email, custom apps.
-
 Process of data governance implementation diagram powerpoint show
Presenting process of data governance implementation diagram powerpoint show. This is a process of data governance implementation diagram powerpoint show. This is a six stage process. The stages in this process are data quality management, document and contain management, business, intelligence management, meta data management, database security management, data architecture and modelling management.
-
 Example of cloud data migration process diagram powerpoint show
Presenting example of cloud data migration process diagram powerpoint show. This is a example of cloud data migration process diagram powerpoint show. This is a six stage process. The stages in this process are assessment, pilot, migration strategy, migrate, leverage, monitor.
-
 Sales data analysis template powerpoint slide show
Presenting sales data analysis template powerpoint slide show. This is sales data analysis template powerpoint slide show. This is a five stage process. The stages in this process are data analysis, better alignment, data sources, focused team, skill training.
-
 Data management strategies diagram powerpoint slide show
Presenting data management strategies diagram powerpoint slide show. This is a data management strategies diagram powerpoint slide show. This is a six stage process. The stages in this process are research, analysis, execution and deployment, quality and monitoring, coding, data entry.
-
 Data warehouse it current situation of the company ppt slides show
This slide depicts the current situation of our company by displaying the ratio of unstructured and structured data stored in the database. Present the topic in a bit more detail with this Data Warehouse IT Current Situation Of The Company Ppt Slides Show. Use it as a tool for discussion and navigation on Organizational Data, Text Format, 2018 To 2022. This template is free to edit as deemed fit for your organization. Therefore download it now.
-
 Role of digital twin and iot healthcare dashboard snapshot showing analytical data
This slide shows the healthcare dashboard that presents analytical data such as occupancy, patient turnover, efficiency and costs, satisfaction and service indicators. Deliver an outstanding presentation on the topic using this Role Of Digital Twin And Iot Healthcare Dashboard Snapshot Showing Analytical Data. Dispense information and present a thorough explanation of Healthcare, Dashboard, Analytical using the slides given. This template can be altered and personalized to fit your needs. It is also available for immediate download. So grab it now.
-
 Dashboard Showing Medical Data Of Patient With Daily Activities
Introducing our Dashboard Showing Medical Data Of Patient With Daily Activities set of slides. The topics discussed in these slides are Dashboard Showing Medical Data Of Patient With Daily Activities. This is an immediately available PowerPoint presentation that can be conveniently customized. Download it and convince your audience.
-
 Medical Dashboard Showing Patient Stays Data By Specialty
Introducing our Medical Dashboard Showing Patient Stays Data By Specialty set of slides. The topics discussed in these slides are Medical Dashboard Showing Patient Stays Data By Specialty. This is an immediately available PowerPoint presentation that can be conveniently customized. Download it and convince your audience.
-
 KPI Dashboard Snapshot Showing Warehouse Data And Fleet Status
Presenting our well structured KPI Dashboard Snapshot Showing Warehouse Data And Fleet Status. The topics discussed in this slide are Profit, Costs, Revenue. This is an instantly available PowerPoint presentation that can be edited conveniently. Download it right away and captivate your audience.
-
 KPI Data Of Warehouse Showing Transaction Per Hour And Value
Introducing our KPI Data Of Warehouse Showing Transaction Per Hour And Value set of slides. The topics discussed in these slides are KPI Data Of Warehouse Showing Transaction Per Hour And Value. This is an immediately available PowerPoint presentation that can be conveniently customized. Download it and convince your audience.
-
 Cost benefits iot digital twins implementation healthcare dashboard showing analytical data
This slide shows the healthcare dashboard that presents analytical data such as occupancy, patient turnover, efficiency and costs, satisfaction and service indicators. Deliver an outstanding presentation on the topic using this Cost Benefits Iot Digital Twins Implementation Healthcare Dashboard Showing Analytical Data. Dispense information and present a thorough explanation of Healthcare Dashboard Showing Analytical Data using the slides given. This template can be altered and personalized to fit your needs. It is also available for immediate download. So grab it now.
-
 Corporate KPI Dashboard Showing Bounce Rate With New Users Data
This graph or chart is linked to excel, and changes automatically based on data. Just left click on it and select Edit Data. Presenting our well structured Corporate KPI Dashboard Showing Bounce Rate With New Users Data. The topics discussed in this slide are New Sessions, Unique Pageviews, Time on Page, Bounce Rate, User Demographics, Visitor Statistics. This is an instantly available PowerPoint presentation that can be edited conveniently. Download it right away and captivate your audience.


