Powerpoint Templates and Google slides for Data analysis
Save Your Time and attract your audience with our fully editable PPT Templates and Slides.
-
 Business concept diagram analysis of data 5 stages powerpoint templates ppt backgrounds for slides
We are proud to present our business concept diagram analysis of data 5 stages powerpoint templates ppt backgrounds for slides. Deliver amazing Presentations with our above template. This PowerPoint Diagram contains an image of pie chart with five stages. It displays fractions and distributions. Use this diagram for marketing research, planning and targeting. Create captivating presentations to deliver comparative and weighted arguments.
-
 Business flow diagram example circular ring data analysis and interpretation powerpoint templates
We are proud to present our business flow diagram example circular ring data analysis and interpretation powerpoint templates. This five step process diagram is laid out in a concentric format or ring diagram. This diagram can be useful for creating visually appealing charts. They help to lay the base of your trend of thought.
-
 Real World Data Developing Framework Evidence Research Analysis
This complete presentation has PPT slides on wide range of topics highlighting the core areas of your business needs. It has professionally designed templates with relevant visuals and subject driven content. This presentation deck has total of ten slides. Get access to the customizable templates. Our designers have created editable templates for your convenience. You can edit the colour, text and font size as per your need. You can add or delete the content if required. You are just a click to away to have this ready-made presentation. Click the download button now.
-
 Data Extraction Process Analysis Transformation Requirements
This complete presentation has PPT slides on wide range of topics highlighting the core areas of your business needs. It has professionally designed templates with relevant visuals and subject driven content. This presentation deck has total of ten slides. Get access to the customizable templates. Our designers have created editable templates for your convenience. You can edit the colour, text and font size as per your need. You can add or delete the content if required. You are just a click to away to have this ready-made presentation. Click the download button now.
-
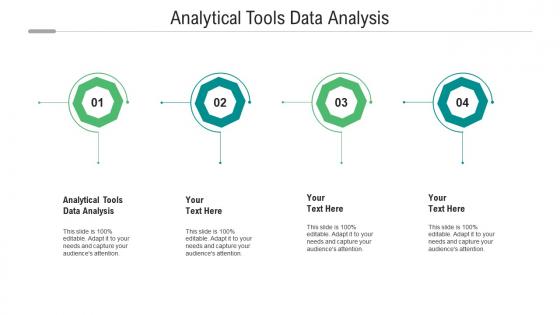 Analytical tools data analysis ppt powerpoint presentation show picture cpb
Presenting Analytical Tools Data Analysis Ppt Powerpoint Presentation Show Picture Cpb slide which is completely adaptable. The graphics in this PowerPoint slide showcase four stages that will help you succinctly convey the information. In addition, you can alternate the color, font size, font type, and shapes of this PPT layout according to your content. This PPT presentation can be accessed with Google Slides and is available in both standard screen and widescreen aspect ratios. It is also a useful set to elucidate topics like Analytical Tools Data Analysis. This well structured design can be downloaded in different formats like PDF, JPG, and PNG. So, without any delay, click on the download button now.
-
 Data analysis strategy using artificial intelligence methodologies
Presenting our set of slides with Data Analysis Strategy Using Artificial Intelligence Methodologies. This exhibits information on four stages of the process. This is an easy to edit and innovatively designed PowerPoint template. So download immediately and highlight information on Data Processing, Prediction, Spatial Analysis.
-
 Analyst checking data points for win loss analysis
Presenting our set of slides with Analyst Checking Data Points For Win Loss Analysis. This exhibits information on four stages of the process. This is an easy to edit and innovatively designed PowerPoint template. So download immediately and highlight information on Analyst Checking Data Points For Win Loss Analysis.
-
 Primary data points for win loss analysis
Introducing our premium set of slides with Primary Data Points For Win Loss Analysis. Ellicudate the four stages and present information using this PPT slide. This is a completely adaptable PowerPoint template design that can be used to interpret topics like Sales Data, Prospect Feedback, Marketing Data. So download instantly and tailor it with your information.
-
 Data analysis mistakes ppt powerpoint presentation layouts clipart cpb
Presenting Data Analysis Mistakes Ppt Powerpoint Presentation Layouts Clipart Cpb slide which is completely adaptable. The graphics in this PowerPoint slide showcase four stages that will help you succinctly convey the information. In addition, you can alternate the color, font size, font type, and shapes of this PPT layout according to your content. This PPT presentation can be accessed with Google Slides and is available in both standard screen and widescreen aspect ratios. It is also a useful set to elucidate topics like Data Analysis Mistakes. This well-structured design can be downloaded in different formats like PDF, JPG, and PNG. So, without any delay, click on the download button now.
-
 Delphi Method Questionnaire To Gather Data Environmental Analysis To Optimize
Following slide illustrates use of delphi method to gather accurate information from experts. It further covers project overview, type of questions and conclusion.Deliver an outstanding presentation on the topic using this Delphi Method Questionnaire To Gather Data Environmental Analysis To Optimize. Dispense information and present a thorough explanation of Positive Impact, Conclusion Made, Efficiency Medical using the slides given. This template can be altered and personalized to fit your needs. It is also available for immediate download. So grab it now.
-
 Survey Form To Collect Accurate Data Environmental Analysis To Optimize
Following slide shows customer satisfaction survey to collect information about factors influencing business product sales. Survey questions are related to prices, shopping preferences, product quality etc.Present the topic in a bit more detail with this Survey Form To Collect Accurate Data Environmental Analysis To Optimize. Use it as a tool for discussion and navigation on Prefer Purchasing, Features Complete, Strongly Agree . This template is free to edit as deemed fit for your organization. Therefore download it now.
-
 Various Research Methods To Collect Data Environmental Analysis To Optimize
Following slide represents methods to collect information using desk research approach. It includes methods such as internet, business information sources and government agencies.Increase audience engagement and knowledge by dispensing information using Various Research Methods To Collect Data Environmental Analysis To Optimize. This template helps you present information on three stages. You can also present information on Business Information, Access Abundant, Understand Impact using this PPT design. This layout is completely editable so personaize it now to meet your audiences expectations.
-
 Business Analyst Data Analysis In Powerpoint And Google Slides Cpb
Presenting our Business Analyst Data Analysis In Powerpoint And Google Slides Cpb PowerPoint template design. This PowerPoint slide showcases four stages. It is useful to share insightful information on Business Analyst Data Analysis This PPT slide can be easily accessed in standard screen and widescreen aspect ratios. It is also available in various formats like PDF, PNG, and JPG. Not only this, the PowerPoint slideshow is completely editable and you can effortlessly modify the font size, font type, and shapes according to your wish. Our PPT layout is compatible with Google Slides as well, so download and edit it as per your knowledge.
-
 Space Radar Data Analysis Colored Icon In Powerpoint Pptx Png And Editable Eps Format
This coloured powerpoint icon is perfect for presentations about space exploration. It features a radar dish with a rocket in the background, representing the search for new worlds and the possibilities of space. It is sure to make your presentation stand out.
-
 Space Radar Data Analysis Monotone Icon In Powerpoint Pptx Png And Editable Eps Format
A Monotone powerpoint icon on Space Radar is a simple yet powerful graphic element to enhance your presentation. It features a sleek, modern design with a single color palette that is perfect for creating a professional and captivating presentation. It is easy to customize and can be used to illustrate any concept related to space.
-
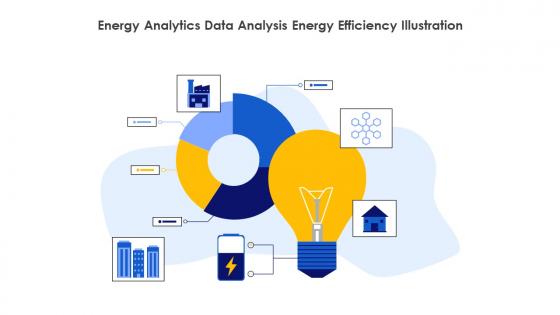 Energy Analytics Data Analysis Energy Efficiency Illustration
This colourful PowerPoint icon is perfect for presentations on energy analytics. It features a graph with a green and yellow background, representing the rise and fall of energy consumption. Its a great visual aid for any energy-related discussion.
-
 Customer Data Analysis On Company Level Improving Customer Satisfaction By Developing MKT SS V
The following slide showcases quantitative analysis of customer data based on company level. Its purpose is to assess decision makers in company to target them and improve customer experiences It showcases elements such as department, industry and revenue. Increase audience engagement and knowledge by dispensing information using Customer Data Analysis On Company Level Improving Customer Satisfaction By Developing MKT SS V. This template helps you present information on Three stages. You can also present information on Analysis By Department, Analysis By Industry, Analysis By Revenue using this PPT design. This layout is completely editable so personaize it now to meet your audiences expectations.
-
 Customer Data Analysis On Individual Level Improving Customer Satisfaction By Developing MKT SS V
The following slide showcases quantitative analysis of customer data based on individual level. It showcases elements such as age group, gender, education, designation, income and country. Introducing Customer Data Analysis On Individual Level Improving Customer Satisfaction By Developing MKT SS V to increase your presentation threshold. Encompassed with Six stages, this template is a great option to educate and entice your audience. Dispence information on Analysis By Age Group, Analysis By Gender, Analysis By Education, using this template. Grab it now to reap its full benefits.
-
 Customer Data Collection For Quantitative Analysis Improving Customer Satisfaction By Developing MKT SS V
The following slide showcases customer demographic and revenue data to perform quantitative analysis and gain valuable insights. It showcases elements such as age group, gender, education, designation, department, income, industry, country and revenue. Present the topic in a bit more detail with this Customer Data Collection For Quantitative Analysis Improving Customer Satisfaction By Developing MKT SS V. Use it as a tool for discussion and navigation on Age Group, Education, Designation, Department. This template is free to edit as deemed fit for your organization. Therefore download it now.
-
 Data Analysis Business Decisions In Powerpoint And Google Slides Cpb
Presenting Data Analysis Business Decisions In Powerpoint And Google Slides Cpb slide which is completely adaptable. The graphics in this PowerPoint slide showcase four stages that will help you succinctly convey the information. In addition, you can alternate the color, font size, font type, and shapes of this PPT layout according to your content. This PPT presentation can be accessed with Google Slides and is available in both standard screen and widescreen aspect ratios. It is also a useful set to elucidate topics like Data Analysis Business Decisions. This well structured design can be downloaded in different formats like PDF, JPG, and PNG. So, without any delay, click on the download button now.
-
 Analysis Science Data Colored Icon In Powerpoint Pptx Png And Editable Eps Format
This coloured PowerPoint icon features a microscope and a beaker, representing the scientific field. It is perfect for presentations on scientific topics and research. The vibrant colours make it stand out and add a professional touch to your slides.
-
 Analysis Science Data Monotone Icon In Powerpoint Pptx Png And Editable Eps Format
This monotone PowerPoint icon is perfect for any presentation on science. It features a microscope, beaker, and test tubes, making it ideal for any scientific topic. The black and white design adds a modern touch to any presentation.
-
 Data Analysis Mining Colored Icon In Powerpoint Pptx Png And Editable Eps Format
This coloured PowerPoint icon is an ideal visual aid for presentations on data mining. It is a simple, eye-catching graphic that conveys the concept of data mining in a clear and concise way. Perfect for slideshows, reports, and other documents.
-
 Data Analysis Mining Monotone Icon In Powerpoint Pptx Png And Editable Eps Format
This monotone PowerPoint icon is perfect for presentations on data mining. It features a magnifying glass with a data symbol in the center, symbolizing the process of searching for valuable information. It is a great way to illustrate the power of data mining.
-
 Identifying Gaps In Workplace Common Data Sources For HR Analysis
This slide exhibits different types of data sources that help organisations in HR analysis efforts.It includes two types of data sources such as internal data and external data. Deliver an outstanding presentation on the topic using this Identifying Gaps In Workplace Common Data Sources For HR Analysis Dispense information and present a thorough explanation of Paper Records, Manual Electronic Files using the slides given. This template can be altered and personalized to fit your needs. It is also available for immediate download. So grab it now.
-
 Data Analysis Processing Colored Icon In Powerpoint Pptx Png And Editable Eps Format
This coloured powerpoint icon depicts data processing. It features a laptop with a graph and a magnifying glass, representing the analysis and research involved in data processing. Use this icon to illustrate data processing in your presentations.
-
 Data Analysis Processing Monotone Icon In Powerpoint Pptx Png And Editable Eps Format
This Monotone PowerPoint Icon is perfect for representing data processing in presentations. It features a simple, black and white design that is sure to draw attention to the data processing topic. It is ideal for illustrating data flow and other related concepts.
-
 Big Data Analysis Architecture For Traditional Database System
This slide represents architecture of big data analysis for traditional database systems. It further includes Data sources, data storage, batch processing, real time message ingestion, stream processing, analytical data store, analysis and reporting, etc. Introducing our Big Data Analysis Architecture For Traditional Database System set of slides. The topics discussed in these slides are Data Sources, Data Storage, Batch Processing, Stream Processing. This is an immediately available PowerPoint presentation that can be conveniently customized. Download it and convince your audience.
-
 Comparative Analysis Of Big Data Tools
This slide illustrates tools and software for big data for cost efficiency. It further includes tools such as Hadoop, Zoho Analytics, and Atlas.ti, HPCC, and their description and trials, etc. Introducing our Comparative Analysis Of Big Data Tools set of slides. The topics discussed in these slides are Hadoop, Zoho Analytics, Analyzing Data, Provides Improved Performance. This is an immediately available PowerPoint presentation that can be conveniently customized. Download it and convince your audience.
-
 Comparative Analysis Of Data Quality Process Tools
This slide depicts the comparative analysis among several data quality processing tools. The purpose of this slide is to help determine and correct errors in data entry to aid decision making and business operations. Introducing our Comparative Analysis Of Data Quality Process Tools set of slides. The topics discussed in these slides are Parameters, Ideal Users, Industries, Market Segments. This is an immediately available PowerPoint presentation that can be conveniently customized. Download it and convince your audience.
-
 Research Project Data Analysis Research Methodology Illustration
This coloured PowerPoint Illustration is perfect for representing a research project. It features a magnifying glass over a stack of books, symbolizing exploration and knowledge. The vibrant colours will make your slides stand out and draw attention to your research.
-
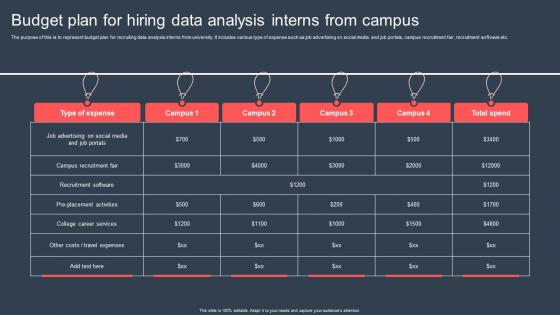 Budget Plan For Hiring Data Analysis Interns From Campus
The purpose of this is to represent budget plan for recruiting data analysis interns from university. It includes various type of expense such as job advertising on social media and job portals, campus recruitment fair, recruitment software etc. Introducing our Budget Plan For Hiring Data Analysis Interns From Campus set of slides. The topics discussed in these slides are Campus Recruitment Fair, College Career Services. This is an immediately available PowerPoint presentation that can be conveniently customized. Download it and convince your audience.
-
 Data Analysis Research Techniques In Powerpoint And Google Slides Cpb
Presenting Data Analysis Research Techniques In Powerpoint And Google Slides Cpb slide which is completely adaptable. The graphics in this PowerPoint slide showcase five stages that will help you succinctly convey the information. In addition, you can alternate the color, font size, font type, and shapes of this PPT layout according to your content. This PPT presentation can be accessed with Google Slides and is available in both standard screen and widescreen aspect ratios. It is also a useful set to elucidate topics like Data Analysis Research Techniques. This well structured design can be downloaded in different formats like PDF, JPG, and PNG. So, without any delay, click on the download button now.
-
 Advanced Data Analysis In Powerpoint And Google Slides Cpb
Presenting our Advanced Data Analysis In Powerpoint And Google Slides Cpb PowerPoint template design. This PowerPoint slide showcases three stages. It is useful to share insightful information on Advanced Data Analysis This PPT slide can be easily accessed in standard screen and widescreen aspect ratios. It is also available in various formats like PDF, PNG, and JPG. Not only this, the PowerPoint slideshow is completely editable and you can effortlessly modify the font size, font type, and shapes according to your wish. Our PPT layout is compatible with Google Slides as well, so download and edit it as per your knowledge.
-
 Comprehensive Analysis Of Different Data Lineage Illustration
This coloured PowerPoint icon is a visual representation of a comprehensive analysis of different data lineage classification. It is a helpful tool for understanding the complexities of data lineage and how it affects data processing. It is an ideal resource for data scientists and professionals alike.
-
 Data AI Artificial Intelligence Connect Plus Tool For App Performance Analysis AI SS
The slide highlights ConnectPlus, data analysis tool for app performance. It combines data from multiple sources, monitors metrics, and provides a configurable dashboard. It track key metrics, unify app data without integration, compare performance, and gain insights with revenue comparison, benchmarking, and data sharing. Increase audience engagement and knowledge by dispensing information using Data AI Artificial Intelligence Connect Plus Tool For App Performance Analysis AI SS. This template helps you present information on two stages. You can also present information on Data Analysis Tool, App Performance, Data From Multiple Sources, Monitors Metrics, Configurable Dashboard, Benchmarking using this PPT design. This layout is completely editable so personaize it now to meet your audiences expectations.
-
 Data AI Artificial Intelligence Data AI Ascend Cross Platform Data Analysis Tool AI SS
The slide highlights a cross-platform data analysis tool called Data.AI ascend. It offers data aggregation, visualization, normalization, and analysis from various sources. It provides multiple visualization options to analyze trends and patterns related to mobile apps, giving a unified view of data insights. Increase audience engagement and knowledge by dispensing information using Data AI Artificial Intelligence Data AI Ascend Cross Platform Data Analysis Tool AI SS. This template helps you present information on five stages. You can also present information on Data Aggregation From Multiple Sources, Data Visualization, Data Normalization, Data Analysis, Customized Solution using this PPT design. This layout is completely editable so personaize it now to meet your audiences expectations.
-
 Data AI Artificial Intelligence Data AI Ascend Tool Analysis And Customization AI SS
The slide highlights the analysis and customization capabilities of the Data.AI ascend tool. It contAIns features such as pivot tables for performance evaluation and customization options for revenue analytics and data ingestion, including API aggregation for comprehensive analytics. Deliver an outstanding presentation on the topic using this Data AI Artificial Intelligence Data AI Ascend Tool Analysis And Customization AI SS. Dispense information and present a thorough explanation of Analysis And Customization, Capabilities Of The Data AI, Performance Evaluation, Customization Options, Data Ingestion using the slides given. This template can be altered and personalized to fit your needs. It is also available for immediate download. So grab it now.
-
 Data AI Artificial Intelligence Data AI Pulse For Data Tracking And Analysis AI SS
The slide highlights a pulse solution for data tracking and analysis. It provides real-time data tracking, customizable dashboards, and reports, AI algorithms for insights, and metrics to review app performance. It enables monitoring brand image, analyzing market trends, predicting customer preferences, and making data-driven business decisions for increased revenue and ROI. Increase audience engagement and knowledge by dispensing information using Data AI Artificial Intelligence Data AI Pulse For Data Tracking And Analysis AI SS. This template helps you present information on three stages. You can also present information on Monitor Brand Image, Analyze Market Trends, Competitive Analysis, Predict Customer Preferences, Identify Opportunities using this PPT design. This layout is completely editable so personaize it now to meet your audiences expectations.
-
 Data AI Artificial Intelligence Free Vs Premium Comparative Analysis For Data AI Tools AI SS
The slide highlights a comprehensive comparative analysis between free and premium Data.AI tools, covering app store tracking, optimization, reviews, pAId search, download and revenue estimates, app usage, game iq, advertising, sdk insights, data delivery, support services, and platform functionalities, including Data.AI connectplus. Deliver an outstanding presentation on the topic using this Data AI Artificial Intelligence Free Vs Premium Comparative Analysis For Data AI Tools AI SS. Dispense information and present a thorough explanation of Comprehensive Comparative Analysis, Free And Premium Data AI, Download And Revenue Estimates, Support Services using the slides given. This template can be altered and personalized to fit your needs. It is also available for immediate download. So grab it now.
-
 Data Research Analysis Collection Illustration
This coloured PowerPoint icon is perfect for presentations on data research. It features a magnifying glass and a graph, symbolizing the process of data collection and analysis. The vibrant colours make it stand out and help to convey the message quickly and effectively.
-
 Learning Process Knowledge Acquisition Data Analysis Illustration
This coloured powerpoint icon is the perfect visual aid to illustrate the learning process. It is vibrant and eye-catching, making it ideal for presentations or educational materials. It can be easily resized and edited to fit any project. Perfect for teachers, students, and professionals alike.
-
 Data Analysis Intelligence Technology Colored Icon In Powerpoint Pptx Png And Editable Eps Format
This colored PowerPoint icon is a perfect representation of Data Intelligence. It is a great visual aid to help explain the concept of data analysis and how it can be used to make informed decisions. It is a great tool to help visualize the power of data and its potential.
-
 Data Analysis Intelligence Technology Monotone Icon In Powerpoint Pptx Png And Editable Eps Format
This Monotone Powerpoint Icon on Data Intelligence is perfect for presentations. It features a black and white image of a brain with a graph and a magnifying glass to represent data analysis. Its a great visual to illustrate the concept of data intelligence.
-
 Binary Data Analysis Colored Icon In Powerpoint Pptx Png And Editable Eps Format
This colourful PowerPoint icon is perfect for presentations on Binary Analysis. It features a computer monitor with a binary code pattern in the background, representing the complex data analysis involved in this field.
-
 Binary Data Analysis Monotone Icon In Powerpoint Pptx Png And Editable Eps Format
This monotone PowerPoint icon is perfect for presentations on binary analysis. It features a black and white image of a computer monitor displaying a binary code sequence. Its a great way to illustrate the complexity of binary analysis.
-
 Checklist For Data Collection To Gain Executing Competitor Analysis To Assess
The following slide showcases various information to be gathered for understanding rivalry business and perform competitor analysis. It showcases components such as employee count, founding year, investors, number of customers, merger and acquisitions, market share and business strength and weakness.Present the topic in a bit more detail with this Checklist For Data Collection To Gain Executing Competitor Analysis To Assess. Use it as a tool for discussion and navigation on Mergers Acquisitions, Business Operating, Total Capital Raised. This template is free to edit as deemed fit for your organization. Therefore download it now.
-
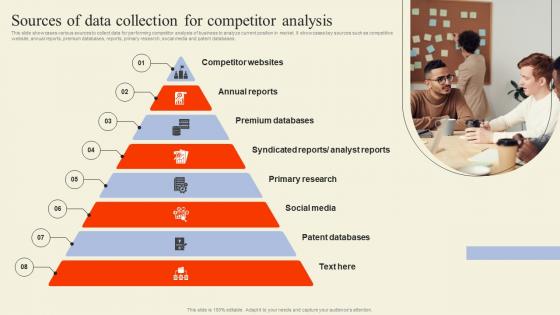 Sources Of Data Collection For Competitor Analysis Executing Competitor Analysis To Assess
This slide showcases various sources to collect data for performing competitor analysis of business to analyze current position in market. It showcases key sources such as competitive website, annual reports, premium databases, reports, primary research, social media and patent databases.Introducing Sources Of Data Collection For Competitor Analysis Executing Competitor Analysis To Assess to increase your presentation threshold. Encompassed with eight stages, this template is a great option to educate and entice your audience. Dispence information on Competitor Websites, Annual Reports, Premium Databases, using this template. Grab it now to reap its full benefits.
-
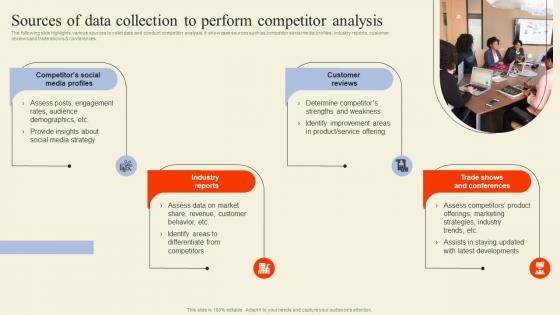 Sources Of Data Collection To Perform Competitor Analysis Executing Competitor Analysis To Assess
The following slide highlights various sources to collet data and conduct competitor analysis. It showcase sources such as competitor social media profiles, industry reports, customer reviews and trade shows conferences.Increase audience engagement and knowledge by dispensing information using Sources Of Data Collection To Perform Competitor Analysis Executing Competitor Analysis To Assess. This template helps you present information on four stages. You can also present information on Industry Reports, Trade Shows Conferences, Offerings Marketing using this PPT design. This layout is completely editable so personaize it now to meet your audiences expectations.
-
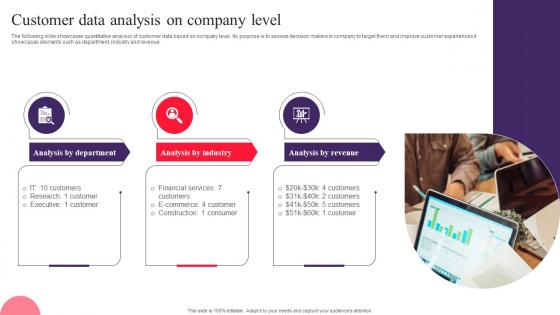 Customer Data Analysis On Company Level Drafting Customer Avatar To Boost Sales MKT SS V
The following slide showcases quantitative analysis of customer data based on company level. Its purpose is to assess decision makers in company to target them and improve customer experiences it showcases elements such as department, industry and revenue. Introducing Customer Data Analysis On Company Level Drafting Customer Avatar To Boost Sales MKT SS V to increase your presentation threshold. Encompassed with three stages, this template is a great option to educate and entice your audience. Dispence information on Department, Industry, Revenue, using this template. Grab it now to reap its full benefits.
-
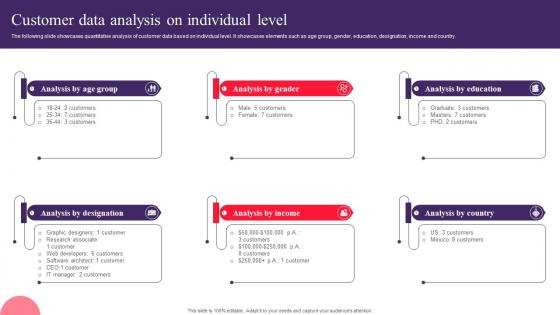 Customer Data Analysis On Individual Level Drafting Customer Avatar To Boost Sales MKT SS V
The following slide showcases quantitative analysis of customer data based on individual level. It showcases elements such as age group, gender, education, designation, income and country. Increase audience engagement and knowledge by dispensing information using Customer Data Analysis On Individual Level Drafting Customer Avatar To Boost Sales MKT SS V. This template helps you present information on six stages. You can also present information on Analysis, Designation, Income using this PPT design. This layout is completely editable so personaize it now to meet your audiences expectations.
-
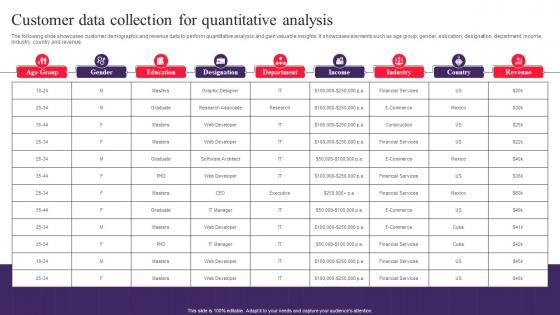 Customer Data Collection For Quantitative Analysis Drafting Customer Avatar To Boost Sales MKT SS V
The following slide showcases customer demographic and revenue data to perform quantitative analysis and gain valuable insights. It showcases elements such as age group, gender, education, designation, department, income, industry, country and revenue. Present the topic in a bit more detail with this Customer Data Collection For Quantitative Analysis Drafting Customer Avatar To Boost Sales MKT SS V. Use it as a tool for discussion and navigation on Customer, Data, Collection. This template is free to edit as deemed fit for your organization. Therefore download it now.
-
 Bot Data Analysis Technology Colored Icon In Powerpoint Pptx Png And Editable Eps Format
This colourful PowerPoint icon depicts a friendly robot, perfect for adding a modern tech touch to any presentation. The icon is bright and inviting, ideal for creating a positive atmosphere.
-
 Bot Data Analysis Technology Monotone Icon In Powerpoint Pptx Png And Editable Eps Format
This monotone PowerPoint icon depicts a robotic figure with a circular head, two arms, and two legs. It is a perfect choice for presentations about robots, automation, and artificial intelligence.
-
 Cloud Data Analysis Warning Colored Icon In Powerpoint Pptx Png And Editable Eps Format
This coloured powerpoint icon features a warning cloud with an exclamation mark, perfect for adding to presentations to warn viewers of potential risks or issues. It is a simple yet effective way to draw attention and communicate important information.
-
 Cloud Data Analysis Warning Monotone Icon In Powerpoint Pptx Png And Editable Eps Format
This Monotone Powerpoint Icon on Cloud Warning is a perfect visual aid for presentations and documents. It is a simple yet effective design that conveys the message of a warning in the cloud. It is easy to use, and can be easily customized to fit your needs.
-
 Case Study Real Time Data Analysis Through Comprehensive Guide For IoT Edge IOT SS
Following slide showcases case study of company that implemented IoT devices for edge computing to improve efficiency and decision making process. It includes elements such as overview, challenges, solutions and impact.Increase audience engagement and knowledge by dispensing information using Case Study Real Time Data Analysis Through Comprehensive Guide For IoT Edge IOT SS. This template helps you present information on three stages. You can also present information on Limited Network, Implement Encryption, Network Bandwidth using this PPT design. This layout is completely editable so personaize it now to meet your audiences expectations.
-
 Steps Research Data Analysis In Powerpoint And Google Slides Cpb
Presenting our Steps Research Data Analysis In Powerpoint And Google Slides Cpb PowerPoint template design. This PowerPoint slide showcases four stages. It is useful to share insightful information on Steps Research Data Analysis This PPT slide can be easily accessed in standard screen and widescreen aspect ratios. It is also available in various formats like PDF, PNG, and JPG. Not only this, the PowerPoint slideshow is completely editable and you can effortlessly modify the font size, font type, and shapes according to your wish. Our PPT layout is compatible with Google Slides as well, so download and edit it as per your knowledge.
-
 Machine Data Analysis In Powerpoint And Google Slides Cpb
Presenting our Machine Data Analysis In Powerpoint And Google Slides Cpb PowerPoint template design. This PowerPoint slide showcases three stages. It is useful to share insightful information on Machine Data Analysis. This PPT slide can be easily accessed in standard screen and widescreen aspect ratios. It is also available in various formats like PDF, PNG, and JPG. Not only this, the PowerPoint slideshow is completely editable and you can effortlessly modify the font size, font type, and shapes according to your wish. Our PPT layout is compatible with Google Slides as well, so download and edit it as per your knowledge.
-
 Comparative Analysis Of Big Data And HR Analytics Tools
This slide showcases comparative analysis of tools of big data and hr analytics. It further includes the name of the tool, provided features, free trial, rating out of five, the price for a month, and additional comments. Presenting our well structured Comparative Analysis Of Big Data And HR Analytics Tools. The topics discussed in this slide are Tool, Rating, Analytics. This is an instantly available PowerPoint presentation that can be edited conveniently. Download it right away and captivate your audience.


