Powerpoint Templates and Google slides for Dashboards
Save Your Time and attract your audience with our fully editable PPT Templates and Slides.
-
 Merchant Web Onboarding Dashboard For Financial Institutions
This slide represents dashboard to track merchant web onboarding status which includes elements such ad approved cases, sent for e-sign, under review, etc. Presenting our well structured Merchant Web Onboarding Dashboard For Financial Institutions. The topics discussed in this slide are Merchant Volume, Business, Application Status. This is an instantly available PowerPoint presentation that can be edited conveniently. Download it right away and captivate your audience.
-
 Mitigating Supplier Risks Through Optimized Kpi Dashboard Measuring Procurement Efficiency
This slide presents a dashboard to measure procurement efficiency, directly associated with supplier performance, measures KPIs such as average procurement cycle, contract compliance. Deliver an outstanding presentation on the topic using this Mitigating Supplier Risks Through Optimized Kpi Dashboard Measuring Procurement Efficiency. Dispense information and present a thorough explanation of Procurement Efficiency, Supplier Performance, Average Procurement Cycle, Contract Compliance using the slides given. This template can be altered and personalized to fit your needs. It is also available for immediate download. So grab it now.
-
 Customer Interaction Management Dashboard For Admin
The purpose of this slide is to showcase a customer interaction management dashboard designed for admin to track metrics such as pending daily tasks, average response time, etc. Presenting our well structured Customer Interaction Management Dashboard For Admin. The topics discussed in this slide are Management, Dashboard, Resolution. This is an instantly available PowerPoint presentation that can be edited conveniently. Download it right away and captivate your audience.
-
 Customer Interaction Management Dashboard For Pipeline Deals
The purpose of this slide is to present a customer interaction management dashboard specifically designed for managing pipeline deals and sales processes. Introducing our Customer Interaction Management Dashboard For Pipeline Deals set of slides. The topics discussed in these slides are Interaction, Management, Dashboard. This is an immediately available PowerPoint presentation that can be conveniently customized. Download it and convince your audience.
-
 Employee Recruitment Database Analytical Dashboard
This slide depicts the dashboard evaluating the employee recruitment database to provide real time insights and metrics to optimize recruitment processes and decision making. It includes metrics such as hires per month, hires by department etc. Introducing our Employee Recruitment Database Analytical Dashboard set of slides. The topics discussed in these slides are Business Development, Database Analytical Dashboard This is an immediately available PowerPoint presentation that can be conveniently customized. Download it and convince your audience.
-
 Employee Training Database Evaluation Dashboard
This slide depicts the dashboard evaluating employee training database to track and analyze training program effectiveness and employee performance metrics. It includes parameters such as number of participants, hours of training, training type etc. Presenting our well structured Employee Training Database Evaluation Dashboard The topics discussed in this slide are Employee Training, Database Evaluation Dashboard This is an instantly available PowerPoint presentation that can be edited conveniently. Download it right away and captivate your audience.
-
 Hr Dashboard To Monitor Workforce Employee Database
This slide depicts the dashboard analyzing the time and attendance database of employees. It includes metrics such as average absenteeism rate, average overtime per week, average overtime by age group, etc. Introducing our Hr Dashboard To Monitor Workforce Employee Database set of slides. The topics discussed in these slides are Overtime Hours, Avg Overtime, Employee Database This is an immediately available PowerPoint presentation that can be conveniently customized. Download it and convince your audience.
-
 Assessment Centre Dashboard For Student Performance Monitoring
This slide illustrates KPI Dashboard of assessment centre and includes total assessments, completed, pending all assessments, and overall performance. Presenting our well structured Assessment Centre Dashboard For Student Performance Monitoring. The topics discussed in this slide are Assessment, Dashboard, Performance. This is an instantly available PowerPoint presentation that can be edited conveniently. Download it right away and captivate your audience.
-
 Dashboard Indicating Growth Hacking Strategies Impact
The purpose of the slide is to showcase the dashboard indicating growth hacking strategies impact. It include elements such as performance tracker, link clicks, number of leads, page likes, campaign details, total clicks etc. Introducing our Dashboard Indicating Growth Hacking Strategies Impact set of slides. The topics discussed in these slides are Dashboard, Strategies Impact, Performance. This is an immediately available PowerPoint presentation that can be conveniently customized. Download it and convince your audience.
-
 Dashboard To Track Improvements Made Credit Risk Management To Streamline Capital CRP DK SS
This slide showcases tracking various KPIs related to management of credit risks including probability of default, exposure at default, etc. Deliver an outstanding presentation on the topic using this Dashboard To Track Improvements Made Credit Risk Management To Streamline Capital CRP DK SS. Dispense information and present a thorough explanation of Exposure By Credit Rating, Exposure By Sectors, Loss Given Default using the slides given. This template can be altered and personalized to fit your needs. It is also available for immediate download. So grab it now.
-
 Business Performance Dashboard To Trade Promotion To Increase Brand Strategy SS V
This slide provides an overview of the dashboard depicting performance of the firm. It includes new customer, sales revenue, profit, average revenue, customer lifetime, acquisition cost, etc. Deliver an outstanding presentation on the topic using this Business Performance Dashboard To Trade Promotion To Increase Brand Strategy SS V. Dispense information and present a thorough explanation of Customer Lifetime Value, Customer Acquisition Cost, Average Revenue Per Unit using the slides given. This template can be altered and personalized to fit your needs. It is also available for immediate download. So grab it now.
-
 KPI Dashboard To Determine Financial Trade Promotion To Increase Brand Strategy SS V
This slide provides an overview of the dashboard that helps to determine the companys financial position. The dashboard includes return on assets, equity, debt-equity ratio, share price, PE ratio and working capital. Deliver an outstanding presentation on the topic using this KPI Dashboard To Determine Financial Trade Promotion To Increase Brand Strategy SS V. Dispense information and present a thorough explanation of Working Capital Ratio, Debt-Equity Ratio, Return On Equity using the slides given. This template can be altered and personalized to fit your needs. It is also available for immediate download. So grab it now.
-
 KPI Dashboard To Measure And Track Trade Promotion To Increase Brand Strategy SS V
This slide provides an overview of the dashboard that helps to determine the progress of marketing activities. This slide includes search, mentions, customer value, budget utilization, conversion, etc. Present the topic in a bit more detail with this KPI Dashboard To Measure And Track Trade Promotion To Increase Brand Strategy SS V. Use it as a tool for discussion and navigation on Demogaphic Breakdown, Budget Utilization, Customer Value. This template is free to edit as deemed fit for your organization. Therefore download it now.
-
 Customer Churn Prediction KPI Dashboard For Customer Churn Analysis ML SS
This slide covers a dashboard for evaluating customer churn metrics such as subscribers churning, revenue lost, and churn-to-retention proportion, top churn drivers, etc. Present the topic in a bit more detail with this Customer Churn Prediction KPI Dashboard For Customer Churn Analysis ML SS. Use it as a tool for discussion and navigation on Total Subscriber, Total Revenue, Subscribers Churning, Revenue Lost. This template is free to edit as deemed fit for your organization. Therefore download it now.
-
 Dashboard To Track Electronics Product Sales Storyboard SS
The purpose of this slide is to highlight monitor and analyze sales trends to inform strategic decisions including elements such as units sold by category, count orders by day, etc. Presenting our well structured Dashboard To Track Electronics Product Sales Storyboard SS. The topics discussed in this slide are Dashboard, Electronics, Product. This is an instantly available PowerPoint presentation that can be edited conveniently. Download it right away and captivate your audience.
-
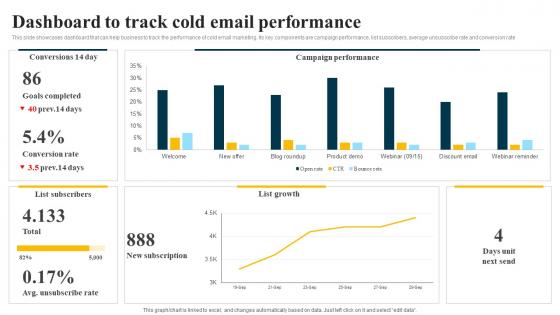 Dashboard To Track Cold Email Performance Inbound Sales Strategy SS V
This slide showcases dashboard that can help business to track the performance of cold email marketing. Its key components are campaign performance, list subscribers, average unsubscribe rate and conversion rate Present the topic in a bit more detail with this Dashboard To Track Cold Email Performance Inbound Sales Strategy SS V Use it as a tool for discussion and navigation on Campaign Performance, List Subscribers, Conversion Rate This template is free to edit as deemed fit for your organization. Therefore download it now.
-
 Dashboard To Track Performance Of Inside Sales Call Executives Inbound Sales Strategy SS V
This slide showcases dashboard that can help organization to track the performance of different inside sales call executives. Its key elements are average time per lead, call back ration, total conversion, leads called etc. Deliver an outstanding presentation on the topic using this Dashboard To Track Performance Of Inside Sales Call Executives Inbound Sales Strategy SS V Dispense information and present a thorough explanation of Track Performance, Sales Call Executives using the slides given. This template can be altered and personalized to fit your needs. It is also available for immediate download. So grab it now.
-
 Lead Generation Strategies To Improve Lead Generation Dashboard To Monitor Business Performance SA SS
The purpose of this slide is to measure performance of company post-implementing lead generation strategies and take data-driven decisions accordingly. Deliver an outstanding presentation on the topic using this Lead Generation Strategies To Improve Lead Generation Dashboard To Monitor Business Performance SA SS. Dispense information and present a thorough explanation of Lead Generation Dashboard, Monitor Business Performance, Data Driven Decisions Accordingly using the slides given. This template can be altered and personalized to fit your needs. It is also available for immediate download. So grab it now.
-
 Lead Generation Strategies To Improve Sales Leads Tracking Dashboard Of Company SA SS
The purpose of this slide is to display key performance indicator KPI dashboard through which companies can analyze how well their lead generation strategies perform. Present the topic in a bit more detail with this Lead Generation Strategies To Improve Sales Leads Tracking Dashboard Of Company SA SS. Use it as a tool for discussion and navigation on Sales Leads Tracking Dashboard, Lead Generation Strategies Perform, Key Performance Indicator. This template is free to edit as deemed fit for your organization. Therefore download it now.
-
 Market Activity Plan To Improve Brand KPI Dashboard To Track SMM Channels
The purpose of this slide is to showcase KPI dashboard for monitoring social media channels. It includes various KPIs such as engagements, total likes, views, clicks, etc. Deliver an outstanding presentation on the topic using this Market Activity Plan To Improve Brand KPI Dashboard To Track SMM Channels. Dispense information and present a thorough explanation of KPI Dashboard, Monitoring Social Media Channels, Audience Growth using the slides given. This template can be altered and personalized to fit your needs. It is also available for immediate download. So grab it now.
-
 Applicant Tracking Dashboard To Track Candidates By Analyzing Evolving Landscape Of Applicant
The following slide highlights the ATS dashboard to track employee hiring based on job-type. It includes various metrics such as technical hiring, non-technical hiring, etc.Deliver an outstanding presentation on the topic using this Applicant Tracking Dashboard To Track Candidates By Analyzing Evolving Landscape Of Applicant. Dispense information and present a thorough explanation of Current Hiring Pipeline, Technical Hiring, Non Technical Hiring using the slides given. This template can be altered and personalized to fit your needs. It is also available for immediate download. So grab it now.
-
 E Commerce Strategy Dashboard For Revenue Growth
The purpose of this slide is enhance e-commerce revenue growth with strategic insights from a comprehensive strategy dashboard, optimizing sales channels, and enhancing customer experiences. Introducing our E Commerce Strategy Dashboard For Revenue Growth set of slides. The topics discussed in these slides are Strategy, Dashboard, Growth. This is an immediately available PowerPoint presentation that can be conveniently customized. Download it and convince your audience.
-
 Ticket Sales Analysis Dashboard For Strategic Growth
The purpose of this slide is to illustrate ticket sales analysis dashboard to identify trends, top events by ticket sales, revenue by ticket type, etc. Introducing our Ticket Sales Analysis Dashboard For Strategic Growth set of slides. The topics discussed in these slides are Analysis, Dashboard, Growth. This is an immediately available PowerPoint presentation that can be conveniently customized. Download it and convince your audience.
-
 Ecosystem Value Realization Platform Dashboard
This slide displays KPI or Dashboard to provide real-time view of value being generated within ecosystem from various transactions and interactions along with value realization summary, value realized types, etc. Presenting our well structured Ecosystem Value Realization Platform Dashboard. The topics discussed in this slide are Realization Platform, Dashboard, Investments. This is an instantly available PowerPoint presentation that can be edited conveniently. Download it right away and captivate your audience.
-
 Value Realization Dashboard To Optimize Campaign Strategy
This slide illustrates KPI or Dashboard to analyze tactics and channels in driving desired outcomes by improving campaign performance including campaign sales, performance, sales vs sessions and general performance. Introducing our Value Realization Dashboard To Optimize Campaign Strategy set of slides. The topics discussed in these slides are Realization, Dashboard, Strategy. This is an immediately available PowerPoint presentation that can be conveniently customized. Download it and convince your audience.
-
 Google Ads Sem Report Dashboard Of E Commerce Business
This slide analyzing metrics like revenue, conversion rate, and cost per conversion through which we gain valuable insights about user behavior. This data empowers us to optimize campaigns, maximize return on ad spend ROAS, and ultimately drive sales growth. Introducing our Google Ads Sem Report Dashboard Of E Commerce Business set of slides. The topics discussed in these slides are Business, Dashboard, Conversions. This is an immediately available PowerPoint presentation that can be conveniently customized. Download it and convince your audience.
-
 Monthly Sem Dashboard Report Of Organisation
This slide shows a comprehensive dashboard report, offering a monthly snapshot of our Search Engine Marketing SEM efforts. The data allows us to track trends, identify areas for improvement, and optimize our strategies to maximize return on investment ROI Introducing our Monthly Sem Dashboard Report Of Organisation set of slides. The topics discussed in these slides are Organization, Dashboard, Goal Completions. This is an immediately available PowerPoint presentation that can be conveniently customized. Download it and convince your audience.
-
 Sem Reporting Software Kpi Dashboard
This slide shows the keyword performance rank dashboards, which cover various aspects as well. The other KPIs are organic traffic charts, cost per lead, tola page likes, exit rates, organic CTR, etc. Presenting our well structured Sem Reporting Software Kpi Dashboard. The topics discussed in this slide are Dashboard, Software, Performance. This is an instantly available PowerPoint presentation that can be edited conveniently. Download it right away and captivate your audience.
-
 Website Performance Sem Report Dashboard
This slide shows the website performance dashboards which covers various KPIs such as total sessions, channel, top devices used of evaluation, landing pages results etc. Presenting our well structured Website Performance Sem Report Dashboard. The topics discussed in this slide are Performance, Dashboard, Returning Sessions. This is an instantly available PowerPoint presentation that can be edited conveniently. Download it right away and captivate your audience.
-
 White Labelled Sem Report Dashboard
This slide shows the conversion trends over time analyzing both sales and signups assists in identifying patterns and trends, such as peak conversion times. The reasons for the increase in sales and signups because of website interface change, promotions, marketing campaigns Presenting our well structured White Labelled Sem Report Dashboard. The topics discussed in this slide are Dashboard, Conversions, Marketing Campaigns. This is an instantly available PowerPoint presentation that can be edited conveniently. Download it right away and captivate your audience.
-
 Customer Project Feedback Results Dashboard
This slide shows the complete feedback dashboard of clients to evaluate how many customer fill the feedback survey forms in which how many feedbacks are positive and negative. Introducing our Customer Project Feedback Results Dashboard set of slides. The topics discussed in these slides are Dashboard, Feedback Of Total, Articles In Feedback Log . This is an immediately available PowerPoint presentation that can be conveniently customized. Download it and convince your audience.
-
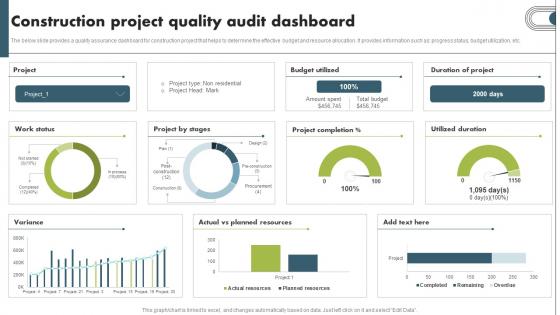 Construction Project Quality Audit Dashboard
The below slide provides a quality assurance dashboard for construction project that helps to determine the effective budget and resource allocation. It provides information such as progress status, budget utilization, etc. Presenting our well structured Construction Project Quality Audit Dashboard The topics discussed in this slide are Utilized Duration, Project Completion, Budget Utilized This is an instantly available PowerPoint presentation that can be edited conveniently. Download it right away and captivate your audience.
-
 Dashboard To Breakdown Staff Utilization
This slide displays dashboard to monitor average productive hours to measure staff utilization rate. It includes elements such as late arrival, booking cancelation, duration breakdown, etc. Introducing our Dashboard To Breakdown Staff Utilization set of slides. The topics discussed in these slides are Total Miles Traveled, Breakdown Staff Utilization This is an immediately available PowerPoint presentation that can be conveniently customized. Download it and convince your audience.
-
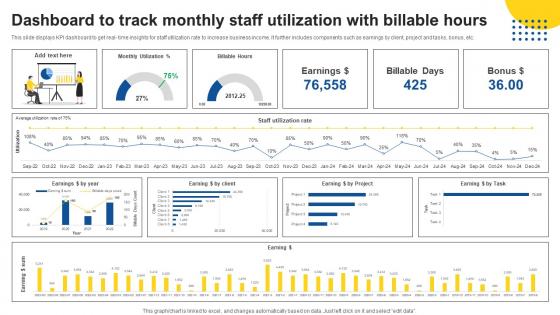 Dashboard To Track Monthly Staff Utilization With Billable Hours
This slide displays KPI dashboard to get real time insights for staff utilization rate to increase business income. It further includes components such as earnings by client, project and tasks, bonus, etc. Presenting our well structured Dashboard To Track Monthly Staff Utilization With Billable Hours The topics discussed in this slide are Track Monthly Staff, Utilization With Billable Hours This is an instantly available PowerPoint presentation that can be edited conveniently. Download it right away and captivate your audience.
-
 Staff Allocation Dashboard For Effective Utilization Of Manpower
This slide displays staff utilization dashboard to help organization in best allocation of idle resources. It includes key components such as capacity forecast, allocation audit, users, unstaffed demand, etc. Presenting our well structured Staff Allocation Dashboard For Effective Utilization Of Manpower The topics discussed in this slide are Capacity Forecast, Staff Allocation Dashboard, Effective Utilization This is an instantly available PowerPoint presentation that can be edited conveniently. Download it right away and captivate your audience.
-
 Staff Utilization Dashboard To Measure Productivity
This slide showcases KPI dashboard to track and monitor staff utilization levels and team wise average productivity. It includes key metrics such as goals achieved, top teams, productive hours per day, etc. Presenting our well structured Staff Utilization Dashboard To Measure Productivity The topics discussed in this slide are Biggest Increase, Biggest Decline, Measure Productivity This is an instantly available PowerPoint presentation that can be edited conveniently. Download it right away and captivate your audience.
-
 Dashboard To Track E Commerce Subscription Rate
This slide provides a dashboard analysis to track the monthly subscription rate using a software management system. It provides information such as cancellation rate, trend analysis, top revenue companies, etc. Introducing our Dashboard To Track E Commerce Subscription Rate set of slides. The topics discussed in these slides are Trend Analysis, Total Invoice, Subscription By StatusThis is an immediately available PowerPoint presentation that can be conveniently customized. Download it and convince your audience.
-
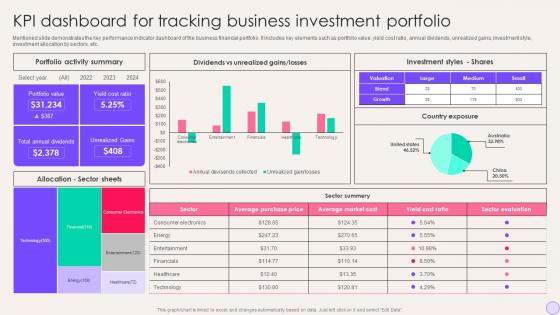 Kpi Dashboard For Tracking Business Investment Portfolio Financial Portfolio Expansion
Mentioned slide demonstrates the key performance indicator dashboard of the business financial portfolio. It includes key elements such as portfolio value, yield cost ratio, annual dividends, unrealized gains, investment style, investment allocation by sectors, etc. Deliver an outstanding presentation on the topic using this Kpi Dashboard For Tracking Business Investment Portfolio Financial Portfolio Expansion Dispense information and present a thorough explanation of Portfolio Activity Summary, Investment Styles Shares using the slides given. This template can be altered and personalized to fit your needs. It is also available for immediate download. So grab it now.
-
 Fast Moving Consumer Goods KPI Dashboard
This slide depicts consumer packaged goods to determine accurate details regarding stocks, performance of deliveries from consumers view point, percent of goods sold within freshness date, etc. Presenting our well structured Fast Moving Consumer Goods KPI Dashboard. The topics discussed in this slide are Products, Inventory Turnover, Target. This is an instantly available PowerPoint presentation that can be edited conveniently. Download it right away and captivate your audience.
-
 Mobile App Adoption Analytics Dashboard For Fashion Industry
The purpose of this slide is to introduce a mobile app adoption analytics dashboard tailored for the fashion industry, providing insights into user engagement by analyzing new and returning users. Introducing our Mobile App Adoption Analytics Dashboard For Fashion Industry set of slides. The topics discussed in these slides are App Version Adoption, Acquisition Source, Returning Users. This is an immediately available PowerPoint presentation that can be conveniently customized. Download it and convince your audience.
-
 Mobile App Performance Dashboard For Ecommerce Industry
The purpose of this slide is to showcase a performance dashboard for mobile apps in the e commerce industry, tracking metrics such as app downloads, active users, etc. Introducing our Mobile App Performance Dashboard For Ecommerce Industry set of slides. The topics discussed in these slides are Mobile App Performance, Dashboard, Ecommerce Industry. This is an immediately available PowerPoint presentation that can be conveniently customized. Download it and convince your audience.
-
 Email Monetization Quarterly Performance Measure Dashboard
The purpose of this slide is to provide actionable insights and analytics on email monetization performance. It facilitates informed decision-making and optimization strategies for revenue generation. Presenting our well structured Email Monetization Quarterly Performance Measure Dashboard. The topics discussed in this slide are Performance, Measure, Dashboard. This is an instantly available PowerPoint presentation that can be edited conveniently. Download it right away and captivate your audience.
-
 Dashboard Indicating Integrated Retail Marketing Impact
The slide depicts omnichannel retail marketing impact dashboard enabling retailers to analyze campaign performance. It include elements such as total conversations, customer satisfaction rate, incoming conversations, abandon rate etc. Introducing our Dashboard Indicating Integrated Retail Marketing Impact set of slides. The topics discussed in these slides are Dashboard Indicating Integrated, Retail Marketing Impact, Incoming Conversations, Abandon Rate. This is an immediately available PowerPoint presentation that can be conveniently customized. Download it and convince your audience.
-
 IT Incident Management KPI Dashboard
The purpose of this slide is to help business track real time status of IT incidents through dashboard visualizations. It covers insights regarding incident priority breakdown, status and cumulative creation records. Introducing our IT Incident Management KPI Dashboard set of slides. The topics discussed in these slides are Incident Status, Incident Priority, Incident Management This is an immediately available PowerPoint presentation that can be conveniently customized. Download it and convince your audience.
-
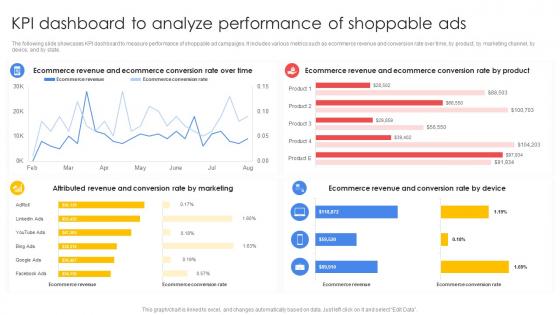 Improving E Commerce Revenue KPI Dashboard To Analyze Performance
The following slide showcases KPI dashboard to measure performance of shoppable ad campaigns. It includes various metrics such as ecommerce revenue and conversion rate over time, by product, by marketing channel, by device, and by state. Present the topic in a bit more detail with this Improving E Commerce Revenue KPI Dashboard To Analyze Performance. Use it as a tool for discussion and navigation on Ecommerce Revenue, Ecommerce Conversion Rate Over Time. This template is free to edit as deemed fit for your organization. Therefore download it now.
-
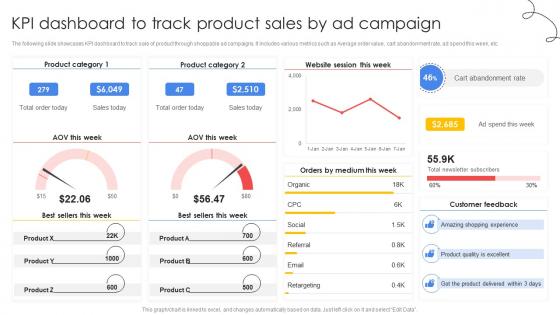 Improving E Commerce Revenue KPI Dashboard To Track Product Sales By Ad
The following slide showcases KPI dashboard to track sale of product through shoppable ad campaigns. It includes various metrics such as Average order value, cart abandonment rate, ad spend this week, etc. Present the topic in a bit more detail with this Improving E Commerce Revenue KPI Dashboard To Track Product Sales By Ad. Use it as a tool for discussion and navigation on Amazing Shopping Experience, Product Quality Is Excellent, Cart Abandonment Rate. This template is free to edit as deemed fit for your organization. Therefore download it now.
-
 Ai Network Security Kpi Dashboard Of Organisation
This slide shows the KPI dashboard after deploying Artificial intelligence in network security to track threat detection and risk compliance. The major KPIs are risk rating breakdown, top threats, and top vulnerabilities. Introducing our Ai Network Security Kpi Dashboard Of Organisation set of slides. The topics discussed in these slides are Dashboard, Organization, Network Security. This is an immediately available PowerPoint presentation that can be conveniently customized. Download it and convince your audience.
-
 Cyber Protection Dashboard To Track Data Loss Safeguarding Business With Data Loss Cybersecurity SS
This slide provides information regarding cybersecurity dashboard to track activities such as malware blocked, vulnerabilities detected, patches ready to install, protection status, active alerts, to ensure minimum data loss.Present the topic in a bit more detail with this Cyber Protection Dashboard To Track Data Loss Safeguarding Business With Data Loss Cybersecurity SS. Use it as a tool for discussion and navigation on Protection Status, Active Alerts Summary, Activities. This template is free to edit as deemed fit for your organization. Therefore download it now.
-
 Dashboard To Leverage Cybersecurity Across Workplace Safeguarding Business With Data Loss Cybersecurity SS
This slide provides information regarding the dashboard to handle cybersecurity across firm by tracking patches applied, vulnerabilities detected, intrusion attempted, security score, etc.Deliver an outstanding presentation on the topic using this Dashboard To Leverage Cybersecurity Across Workplace Safeguarding Business With Data Loss Cybersecurity SS. Dispense information and present a thorough explanation of Intrusion Attempts, Successful Intrusions, Security Score using the slides given. This template can be altered and personalized to fit your needs. It is also available for immediate download. So grab it now.
-
 Manufacturing Operations Analytics Dashboard Manufacturing Execution System
This slide presents structured dashboard to track manufacturing effectiveness including KPI such as produced quantity, production quality, cost and monthly order tracking. Deliver an outstanding presentation on the topic using this Manufacturing Operations Analytics Dashboard Manufacturing Execution System. Dispense information and present a thorough explanation of Production Cost, Production Quality, Produced Quantity, Cost Efficiency using the slides given. This template can be altered and personalized to fit your needs. It is also available for immediate download. So grab it now.
-
 Production Process Monitoring Dashboard With Runtime Manufacturing Execution System
This slide presents the performance of assets and production processes including key performance metrics such as overall equipment effectiveness, performance, quality, planned production, scheduled loss, etc. Present the topic in a bit more detail with this Production Process Monitoring Dashboard With Runtime Manufacturing Execution System. Use it as a tool for discussion and navigation on Overall Equipment Effectiveness, Availability, Performance. This template is free to edit as deemed fit for your organization. Therefore download it now.
-
 Nft Marketing Campaign Performance Dashboard
This slide represents dashboard to trach and monitor NFT marketing campaign performance which includes KPIs such as CPA per campaign, Total budget, total spending, etc. Presenting our well structured Nft Marketing Campaign Performance Dashboard. The topics discussed in this slide are Performance, Dashboard, Marketing. This is an instantly available PowerPoint presentation that can be edited conveniently. Download it right away and captivate your audience.
-
 Walmart Inventory Management Dashboard Exploring Competitive Strategies Contributing Strategy SS
The following slide depicts Walmarts stock management KPI dashboard to track inventory level. It includes elements such as average stock, product details, units per store per week, etc. Present the topic in a bit more detail with this Walmart Inventory Management Dashboard Exploring Competitive Strategies Contributing Strategy SS. Use it as a tool for discussion and navigation on Walmart Inventory, Management Dashboard, Walmarts Stock Management. This template is free to edit as deemed fit for your organization. Therefore download it now.
-
 Walmart Profitability Assessment Kpi Dashboard Exploring Competitive Strategies Contributing Strategy SS
The following slide depicts key performance dashboard of Walmart retail store indicating profitability. It includes elements such as gross merchandise value, year-over-year growth, month-over-month, net profit margin, etc. Present the topic in a bit more detail with this Walmart Profitability Assessment Kpi Dashboard Exploring Competitive Strategies Contributing Strategy SS. Use it as a tool for discussion and navigation on Walmart Profitability, KPI Dashboard, Gross Merchandise Value. This template is free to edit as deemed fit for your organization. Therefore download it now.
-
 Walmart Sales Analytics Performance Management Dashboard Exploring Competitive Strategies Strategy SS
The following slide depicts sales management dashboard to review business performance. It includes elements such as number of orders, sales mix, performance by channel, projected versus actual sales, etc. Deliver an outstanding presentation on the topic using this Walmart Sales Analytics Performance Management Dashboard Exploring Competitive Strategies Strategy SS. Dispense information and present a thorough explanation of Walmart Sales Analytics, Performance Management Dashboard, Projected Versus Actual Sales using the slides given. This template can be altered and personalized to fit your needs. It is also available for immediate download. So grab it now.
-
 Dashboard For Analyzing Global Customer Support International Business Strategies For Exponential
This slide presents dashboard for analyzing global customer support, helpful in determining customer satisfaction through resolutions offered. It includes resolution rate for 1st time contacts, top performing agents by ratings and Net promoter score. Present the topic in a bit more detail with this Dashboard For Analyzing Global Customer Support International Business Strategies For Exponential. Use it as a tool for discussion and navigation on Occupancy Rate, Top Performing Agents, Average First Contact Resolution Rate. This template is free to edit as deemed fit for your organization. Therefore download it now.
-
 Dashboard For Monitoring International Marketing International Business Strategies For Exponential
This slide presents dashboard for monitoring international marketing campaigns across countries, helpful in maintaining record of good and bad performing initiatives. It includes metrics such as total spend, total impressions, etc. on campaigns by countries. Deliver an outstanding presentation on the topic using this Dashboard For Monitoring International Marketing International Business Strategies For Exponential. Dispense information and present a thorough explanation of Cost Per Acquisition, Total Acquisitions, Total Clicks, Total Impressions using the slides given. This template can be altered and personalized to fit your needs. It is also available for immediate download. So grab it now.
-
 Financial Performance Dashboard For International Business Strategies For Exponential
This slide presents financial performance dashboard for international business monitoring and funds management. It includes metrics such as return on assets, working capital ratio, return on equity and debt equity ratio. Present the topic in a bit more detail with this Financial Performance Dashboard For International Business Strategies For Exponential. Use it as a tool for discussion and navigation on Return On Equity, Return On Assets, Working Capital Ratio. This template is free to edit as deemed fit for your organization. Therefore download it now.
-
 Sales Performance Dashboard For International Business Strategies For Exponential
This slide presents sales performance dashboard for international business, helpful in tracking target accomplishment and overall sales achieved. It includes metrics such as average revenue per unit, customer lifetime value, customer acquisition cost. Present the topic in a bit more detail with this Sales Performance Dashboard For International Business Strategies For Exponential. Use it as a tool for discussion and navigation on Average Revenue Per Unit, Customer Lifetime Value, Customer Acquisition Cost. This template is free to edit as deemed fit for your organization. Therefore download it now.
-
 Warehouse Supervision Dashboard For International Business Strategies For Exponential
This slide presents warehouse supervision dashboard for international operations, helpful in tracking shipments and storage cost. It includes metrics such as average monthly costs for warehouse, total shipments in different countries and percentage of on-time shipments. Deliver an outstanding presentation on the topic using this Warehouse Supervision Dashboard For International Business Strategies For Exponential. Dispense information and present a thorough explanation of On-Time Shipments, Total Shipments By Country, Perfect Order Rate, Warehouse Operating Costs using the slides given. This template can be altered and personalized to fit your needs. It is also available for immediate download. So grab it now.


