Powerpoint Templates and Google slides for Dashboards
Save Your Time and attract your audience with our fully editable PPT Templates and Slides.
-
 CRM Marketing Pipeline Kpi Dashboard CRM Marketing MKT SS V
This slide represents key metrics dashboard to track and analyze the performance of CRM marketing pipeline. It includes details related to KPIs such as open pipeline value, pipeline value forecast, top 5 sales opportunities etc. Present the topic in a bit more detail with this CRM Marketing Pipeline Kpi Dashboard CRM Marketing MKT SS V Use it as a tool for discussion and navigation on Organic Content Marketing, Email Marketing, Social Media Marketing This template is free to edit as deemed fit for your organization. Therefore download it now.
-
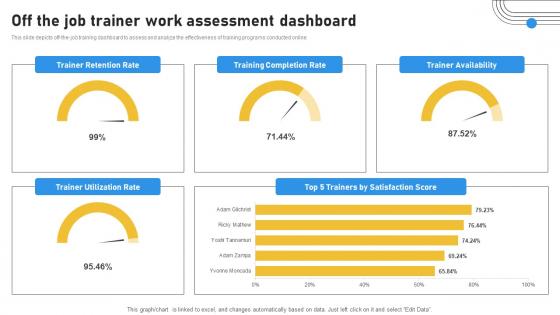 Off The Job Trainer Work Assessment Dashboard
This slide depicts off-the-job training dashboard to assess and analyze the effectiveness of training programs conducted online. Introducing our Off The Job Trainer Work Assessment Dashboard set of slides. The topics discussed in these slides are Off The Job Trainer, Work Assessment Dashboard. This is an immediately available PowerPoint presentation that can be conveniently customized. Download it and convince your audience.
-
 Off The Job Training Evaluation Dashboard
This slide depicts off-the-job training dashboard to assess and analyze the effectiveness of training programs conducted online. Introducing our Off The Job Training Evaluation Dashboard set of slides. The topics discussed in these slides are Number Of Participants, House Of Training, Training By Subject Matter. This is an immediately available PowerPoint presentation that can be conveniently customized. Download it and convince your audience.
-
 New And Advanced Tech Dashboard To Evaluate Digital Transformation Process
Deliver an outstanding presentation on the topic using this New And Advanced Tech Dashboard To Evaluate Digital Transformation Process Dispense information and present a thorough explanation of Strategy, Data, Customer Experience using the slides given. This template can be altered and personalized to fit your needs. It is also available for immediate download. So grab it now.
-
 Highlight Potential Bottlenecks Using Incident Tracking Dashboard
This slide illustrates incident tracking dashboard for monitoring, analyzing and managing issues effectively by informed decision making. It includes metrics such as initiative, element, outstanding, median resolution time, new vs resolved issues, tickets by status, etc. Introducing our Highlight Potential Bottlenecks Using Incident Tracking Dashboard set of slides. The topics discussed in these slides are New Vs Resolved Issues, Median Resolution Time, Completed Tickets. This is an immediately available PowerPoint presentation that can be conveniently customized. Download it and convince your audience.
-
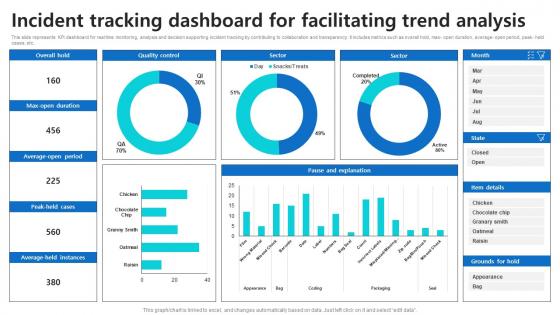 Incident Tracking Dashboard For Facilitating Trend Analysis
This slide represents KPI dashboard for real time monitoring, analysis and decision supporting incident tracking by contributing to collaboration and transparency. It includes metrics such as overall hold, max open duration, average open period, peak held cases, etc. Introducing our Incident Tracking Dashboard For Facilitating Trend Analysis set of slides. The topics discussed in these slides are Incident Tracking, Dashboard For Facilitating, Trend Analysis. This is an immediately available PowerPoint presentation that can be conveniently customized. Download it and convince your audience.
-
 Incident Tracking Dashboard For Improving Cyber Resilence
This slide showcases incident tracking KPI dashboard for prioritizing resolution to ensure optimal functioning of data and security. It includes metrics such as total incidents, open incidents, average resolution time, unassigned tickets, past due issues, past due incidents, etc. Presenting our well structured Incident Tracking Dashboard For Facilitating Trend Analysis. The topics discussed in this slide are Incident Tracking, Improving Cyber Resilience, Average Resolution Time. This is an instantly available PowerPoint presentation that can be edited conveniently. Download it right away and captivate your audience.
-
 Leadership Development Model KPI Dashboard For Team Performance
This slide illustrates development model for assessing leaders and making informed decisions about leadership through performance metrics. It includes metrics such as leadership training program, competency assessment chart, leadership development, etc. Presenting our well structured Leadership Development Model KPI Dashboard For Team Performance. The topics discussed in this slide are People Completed This Program, Leadership Development, Exceptional Leaders. This is an instantly available PowerPoint presentation that can be edited conveniently. Download it right away and captivate your audience.
-
 Strategic Engagement Process Dashboard Illustrating Customer Engagement Performance Metric
This slide represents a dashboard highlighting organizations current KPI performance following the adoption of a successful customer engagement strategy. It includes Net promoter score, customer effort score, NPS and CES monthly growth and satisfaction score. Present the topic in a bit more detail with this Strategic Engagement Process Dashboard Illustrating Customer Engagement Performance Metric Use it as a tool for discussion and navigation on Customer Effort Score, Net Promotor Score, Service This template is free to edit as deemed fit for your organization. Therefore download it now.
-
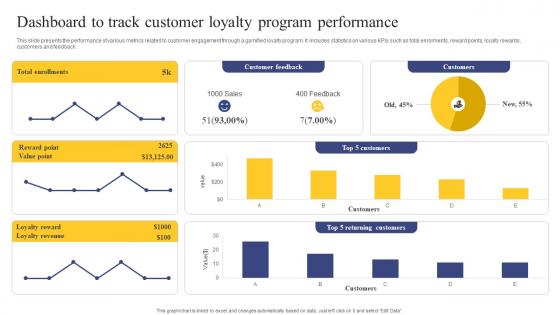 Strategic Engagement Process Dashboard To Track Customer Loyalty Program Performance
This slide presents the performance of various metrics related to customer engagement through a gamified loyalty program. It includes statistics on various KPIs such as total enrolments, reward points, loyalty rewards, customers and feedback. Deliver an outstanding presentation on the topic using this Strategic Engagement Process Dashboard To Track Customer Loyalty Program Performance Dispense information and present a thorough explanation of Total Enrollments, Effective Customer Service using the slides given. This template can be altered and personalized to fit your needs. It is also available for immediate download. So grab it now.
-
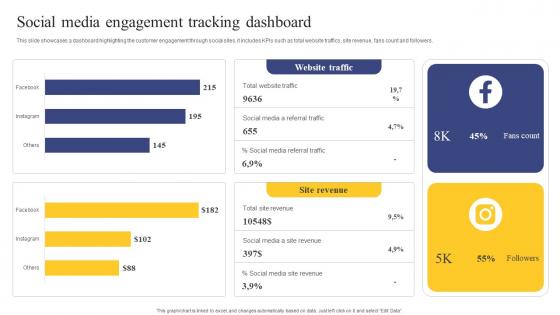 Strategic Engagement Process Social Media Engagement Tracking Dashboard
This slide showcases a dashboard highlighting the customer engagement through social sites. it includes KPIs such as total website traffics, site revenue, fans count and followers. Present the topic in a bit more detail with this Strategic Engagement Process Social Media Engagement Tracking Dashboard Use it as a tool for discussion and navigation on Help Derive Engagement, CRM Marketing Consumers This template is free to edit as deemed fit for your organization. Therefore download it now.
-
 IT Services Project Management Dashboard Guide On Navigating Project PM SS
This slide showcases metrics related to information technology services. This template focuses on monitoring success of project and campaigns ultimately contributing to making organisation intelligent. It includes information related to budget, overdue tasks, etc. Present the topic in a bit more detail with this IT Services Project Management Dashboard Guide On Navigating Project PM SS. Use it as a tool for discussion and navigation on Management, Dashboard, Project. This template is free to edit as deemed fit for your organization. Therefore download it now.
-
 Project Management Dashboard For Overall Progress Guide On Navigating Project PM SS
This slide showcases dashboard for overall progress of project management. This template focuses on tracking projects by showing high level metrics for its success. It includes information related to milestones, time spent, etc. Deliver an outstanding presentation on the topic using this Project Management Dashboard For Overall Progress Guide On Navigating Project PM SS. Dispense information and present a thorough explanation of Resources, Spent, Projects using the slides given. This template can be altered and personalized to fit your needs. It is also available for immediate download. So grab it now.
-
 Project Management Dashboard For Tracking Guide On Navigating Project PM SS
This slide showcases dashboard for tracing project performance. This template focuses on changing the status of each task and graphs automatically tracking overall status. It covers aspects related to task priority, budget, etc. Present the topic in a bit more detail with this Project Management Dashboard For Tracking Guide On Navigating Project PM SS. Use it as a tool for discussion and navigation on Management, Tracking, Performance. This template is free to edit as deemed fit for your organization. Therefore download it now.
-
 Consumer Marketing Dashboard Analyzing Real Time Data
This slide depicts dashboard analyzing stakeholders real-time data which cuts out inefficiency and displays metrics from different channels. It includes elements such as Ad spend, cost per thousand, cost per click, click-through rate and services. Introducing our Consumer Marketing Dashboard Analyzing Real Time Data set of slides. The topics discussed in these slides are Range This Month, Services All, Posts All This is an immediately available PowerPoint presentation that can be conveniently customized. Download it and convince your audience.
-
 Mobile App Push Notification Dashboard
This slide showcases the cell phone applications push notifications dashboard which helps an organization to increase customer retention rates and provide upselling strategies. It include details such as users subscribe through browser, sent alerts, visitor statistics, etc. Introducing our Mobile App Push Notification Dashboard set of slides. The topics discussed in these slides are Active Status, Sent Notifications, Clicks. This is an immediately available PowerPoint presentation that can be conveniently customized. Download it and convince your audience.
-
 Strategy Planning Dashboard For Consistent Data Quality
This slide illustrates KPI dashboard for data strategy to effectively manage, measure and optimize data related initiatives ensuring overall success. It includes metrics such as ticket closed, total queries, total sales, support overhead ratio, user approval, ticket volume vs support level, etc. Presenting our well structured Strategy Planning Dashboard For Consistent Data Quality The topics discussed in this slide are Ticket Closed, Total Queries, Total Sales This is an instantly available PowerPoint presentation that can be edited conveniently. Download it right away and captivate your audience.
-
 Forecast Plan Dashboard For Performing Scenario Analysis
This slide illustrates KPI dashboard to provide centralized platform for visualizing, monitoring and managing forecast related data plan by aligning objectives. It includes metrics such as impact of enrichment, forecast precision, partiality, nature of alterations, category of adjustments, etc. Introducing our Forecast Plan Dashboard For Performing Scenario Analysis set of slides. The topics discussed in these slides are Impact Of Enhancement, Category Of Adjustments, Forecast Precision This is an immediately available PowerPoint presentation that can be conveniently customized. Download it and convince your audience.
-
 Product Promotion Dashboard For Gaining Customer Insights
This slide illustrates KPI dashboard of product marketing monitoring, analyzing and optimizing efforts in alignment with organizational goals. It includes metrics such as income, acquisitions, client approval, sales evaluation, client based revenue, source specific revenue, etc. Introducing our Product Promotion Dashboard For Gaining Customer Insights set of slides. The topics discussed in these slides are Sales Evaluation, Acquisitions, Client Approval This is an immediately available PowerPoint presentation that can be conveniently customized. Download it and convince your audience.
-
 Data Quality Measurement KPI Dashboard
This slide shows an analytical dashboard for data quality management. The purpose of this slide is to help businesses in monitoring status of various data quality elements in an organization. It covers report of elements such as accuracy, completeness, consistency, integrity, etc. Presenting our well structured Data Quality Measurement KPI Dashboard. The topics discussed in this slide are Accuracy, Consistency, Uniqueness. This is an instantly available PowerPoint presentation that can be edited conveniently. Download it right away and captivate your audience.
-
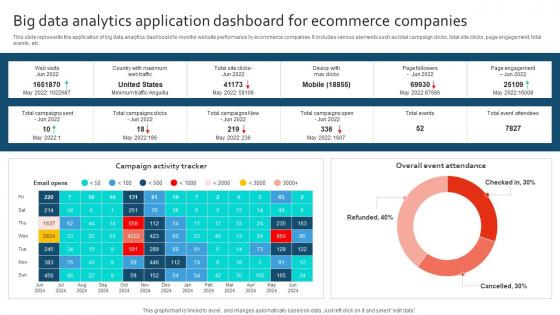 Big Data Analytics Application Dashboard For Ecommerce Companies
This slide represents the application of big data analytics dashboard to monitor website performance by ecommerce companies. It includes various elements such as total campaign clicks, total site clicks, page engagement, total events, etc. Introducing our Big Data Analytics Application Dashboard For Ecommerce Companies set of slides. The topics discussed in these slides are Campaign Activity Tracker, Ecommerce Companies. This is an immediately available PowerPoint presentation that can be conveniently customized. Download it and convince your audience.
-
 Dashboard Tracking Corporate Compliance Training Status
This slide showcases the dashboard monitoring compliance training status. It include details such as completion rate, non-complaint, compliance rate, etc. Introducing our Dashboard Tracking Corporate Compliance Training Status set of slides. The topics discussed in these slides are Completion Rate, Compliance Rate. This is an immediately available PowerPoint presentation that can be conveniently customized. Download it and convince your audience.
-
 Business Financial Savings KPI Dashboard To Evaluate Cash Performance
This slide showcases evaluating cash performance with business financial savings KPI dashboard. This slide includes savings, income and expenses vs their last year money and weekly savings per day for company. Introducing our Business Financial Savings KPI Dashboard To Evaluate Cash Performance set of slides. The topics discussed in these slides are Weekly Savings, Savings. This is an immediately available PowerPoint presentation that can be conveniently customized. Download it and convince your audience.
-
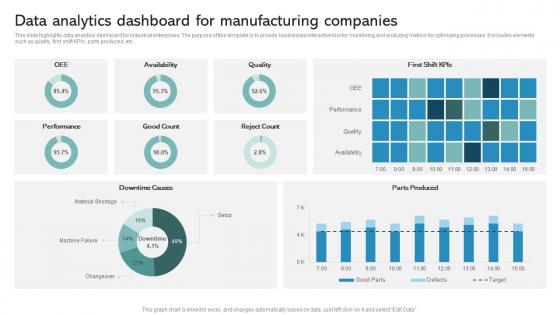 Data Analytics Dashboard For Manufacturing Companies
This slide highlights data analytics dashboard for industrial enterprises. The purpose of this template is to provide businesses interactive tool for monitoring and analyzing metrics for optimizing processes. It includes elements such as quality, first shift KPIs, parts produced, etc. Introducing our Data Analytics Dashboard For Manufacturing Companies set of slides. The topics discussed in these slides are Performance, Good Count, Reject Count, Availability, Quality. This is an immediately available PowerPoint presentation that can be conveniently customized. Download it and convince your audience.
-
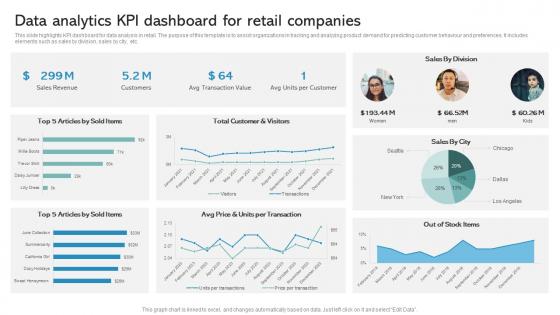 Data Analytics KPI Dashboard For Retail Companies
This slide highlights KPI dashboard for data analysis in retail. The purpose of this template is to assist organizations in tracking and analyzing product demand for predicting customer behaviour and preferences. It includes elements such as sales by division, sales by city, etc. Presenting our well structured Data Analytics KPI Dashboard For Retail Companies. The topics discussed in this slide are Total Customer And Visitors, Units Per Transaction, Articles By Sold Items. This is an instantly available PowerPoint presentation that can be edited conveniently. Download it right away and captivate your audience.
-
 Operating System Dashboard For Continuous Improvement
This slide illustrates KPI or Dashboard of operating system to assess relevant issues and corresponding measures for tracking system and utilization rate. It includes metrics such as real time alerts, virtual CPU activity, performance, processor activity, etc. Introducing our Operating System Dashboard For Continuous Improvement set of slides. The topics discussed in these slides are Virtual CPU Activity, Virtual CPU Performance, Virtual Processor Activity. This is an immediately available PowerPoint presentation that can be conveniently customized. Download it and convince your audience.
-
 Operating System Dashboard For Data Performance Tracking
This slide illustrates KPI or dashboard of operating system by providing total number of computers by system role within collection, branch version, and state. It includes metrics such as computer software, hierarchical levels, and conditions. Presenting our well structured Operating System Dashboard For Data Performance Tracking. The topics discussed in this slide are Computer Software, Hierarchical Levels, Conditions. This is an instantly available PowerPoint presentation that can be edited conveniently. Download it right away and captivate your audience.
-
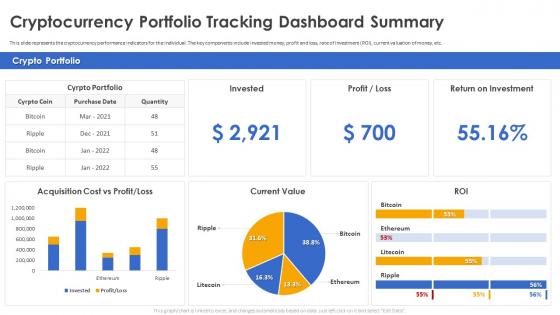 Secure Your Digital Assets Cryptocurrency Portfolio Tracking Dashboard Summary
This slide represents the cryptocurrency performance indicators for the individual. The key components include invested money, profit and loss, rate of investment ROI, current valuation of money, etc. Deliver an outstanding presentation on the topic using this Secure Your Digital Assets Cryptocurrency Portfolio Tracking Dashboard Summary. Dispense information and present a thorough explanation of Cryptocurrency Portfolio, Tracking Dashboard Summary, Rate Of Investment using the slides given. This template can be altered and personalized to fit your needs. It is also available for immediate download. So grab it now.
-
 IoT Energy Management Dashboard For Intelligent Buildings IoT Energy Management Solutions IoT SS
This slide exhibits KPI dashboard for facility owners to monitor, optimise and control energy consumption within building environment. It includes elements such as daily electricity consumption, monthly electricity consumption, target, etc. Deliver an outstanding presentation on the topic using this IoT Energy Management Dashboard For Intelligent Buildings IoT Energy Management Solutions IoT SS. Dispense information and present a thorough explanation of Iot Energy Management Dashboard, Intelligent Buildings using the slides given. This template can be altered and personalized to fit your needs. It is also available for immediate download. So grab it now.
-
 KPI Dashboard Showcasing Smart Meter Performance IoT Energy Management Solutions IoT SS
This slide exhibits a smart meter monitoring dashboard that provides valuable data, helpful in decision making and enhance regulatory compliance. It includes elements such as voltage, energy consumption, energy meters, energy consumption rate, etc. Present the topic in a bit more detail with this KPI Dashboard Showcasing Smart Meter Performance IoT Energy Management Solutions IoT SS. Use it as a tool for discussion and navigation on Energy Consumption, Energy Meters, Alarms. This template is free to edit as deemed fit for your organization. Therefore download it now.
-
 Smart Home Energy Management Dashboard With Cost IoT Energy Management Solutions IoT SS
This slide contains a yearly dashboard used by homeowners to control energy usage and reduce environmental impact. It includes elements such as cost predicted, change in cost, active appliances, energy intensity, usage estimate, etc. Present the topic in a bit more detail with this Smart Home Energy Management Dashboard With Cost IoT Energy Management Solutions IoT SS. Use it as a tool for discussion and navigation on Energy Intensity, Carbon Footprint, Usage Estimate. This template is free to edit as deemed fit for your organization. Therefore download it now.
-
 Dashboard For Tracking Impact Of Implementing Sales Powerful Sales Tactics For Meeting MKT SS V
This slide covers the KPI dashboard for tracking KPIs such as new customer YTD, sales revenue, profit, average weekly sales, above sales target, average revenue per unit, customer lifetime value, etc. Present the topic in a bit more detail with this Dashboard For Tracking Impact Of Implementing Sales Powerful Sales Tactics For Meeting MKT SS V. Use it as a tool for discussion and navigation on Dashboard For Tracking Impact, Implementing Sales. This template is free to edit as deemed fit for your organization. Therefore download it now.
-
 Dashboard For Tracking Sales By Various Products Powerful Sales Tactics For Meeting MKT SS V
This slide covers the KPI dashboard for tracking sales by different categories such as product, region, channel, inventory outstanding, sales growth, actual and target sales, etc. Deliver an outstanding presentation on the topic using this Dashboard For Tracking Sales By Various Products Powerful Sales Tactics For Meeting MKT SS V. Dispense information and present a thorough explanation of Dashboard For Tracking Sales, Various Products using the slides given. This template can be altered and personalized to fit your needs. It is also available for immediate download. So grab it now.
-
 Dashboard For Tracking Sales Team Performance Powerful Sales Tactics For Meeting MKT SS V
This slide covers the KPI dashboard for tracking sales rep performance. It includes metrics such as sales, target, percent of target, sales, and target for each salesperson. Present the topic in a bit more detail with this Dashboard For Tracking Sales Team Performance Powerful Sales Tactics For Meeting MKT SS V. Use it as a tool for discussion and navigation on Dashboard For Tracking, Sales Team Performance. This template is free to edit as deemed fit for your organization. Therefore download it now.
-
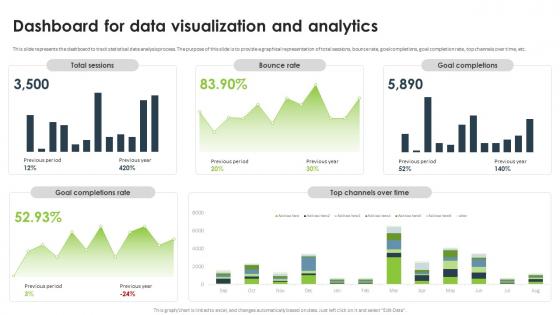 Statistical Analysis For Data Driven Dashboard For Data Visualization And Analytics
This slide represents the dashboard to track statistical data analysis process. The purpose of this slide is to provide a graphical representation of total sessions, bounce rate, goal completions, goal completion rate, top channels over time, etc. Present the topic in a bit more detail with this Statistical Analysis For Data Driven Dashboard For Data Visualization And Analytics. Use it as a tool for discussion and navigation on Data Visualization And Analytics, Bounce Rate, Goal Completions, Goal Completion Rate. This template is free to edit as deemed fit for your organization. Therefore download it now.
-
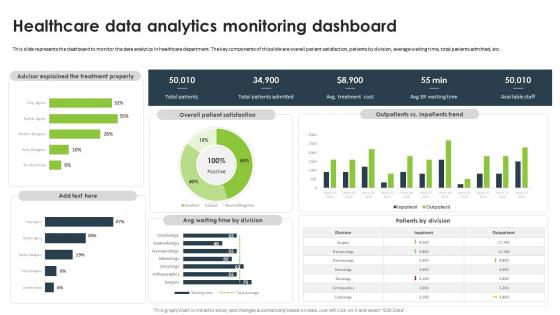 Statistical Analysis For Data Driven Healthcare Data Analytics Monitoring Dashboard
This slide represents the dashboard to monitor the data analytics in healthcare department. The key components of this slide are overall patient satisfaction, patients by division, average waiting time, total patients admitted, etc. Present the topic in a bit more detail with this Statistical Analysis For Data Driven Healthcare Data Analytics Monitoring Dashboard. Use it as a tool for discussion and navigation on Healthcare Data Analytics, Monitoring Dashboard, Healthcare Department. This template is free to edit as deemed fit for your organization. Therefore download it now.
-
 Hr Dashboard For Strategic Talent Management Tool Leveraging Technologies To Enhance Hr Services
This slide covers KPI dashboard to assess HR information for strategic decision making and performance management. It involves total number of reviews, average salary and total salary by organizational unit. Deliver an outstanding presentation on the topic using this Hr Dashboard For Strategic Talent Management Tool Leveraging Technologies To Enhance Hr Services. Dispense information and present a thorough explanation of Performance, Management, Strategic using the slides given. This template can be altered and personalized to fit your needs. It is also available for immediate download. So grab it now.
-
 Kpi Dashboard To Track Employee Talent Management Tool Leveraging Technologies To Enhance Hr Services
This slide covers KPI dashboard to track employee performance at workplace. It involves details such as productivity rate, labour effectiveness rate, absentee rate and turnover ratio. Deliver an outstanding presentation on the topic using this Kpi Dashboard To Track Employee Talent Management Tool Leveraging Technologies To Enhance Hr Services. Dispense information and present a thorough explanation of Dashboard, Performance, Organization using the slides given. This template can be altered and personalized to fit your needs. It is also available for immediate download. So grab it now.
-
 Daily Project Status Report KPI Dashboard
This slide showcases daily project status report KPI dashboard to track current testing and overall status forprogress. It further includes details such as planning, design, development, testing etc. Presenting our well structured Daily Project Status Report KPI Dashboard The topics discussed in this slide are Project Budget, Design, Development, Overdue Tasks This is an instantly available PowerPoint presentation that can be edited conveniently. Download it right away and captivate your audience.
-
 Digital Marketing Analytics Dashboard For E Commerce Brands
This slide displays dashboard for digital marketing analytics that helps to track campaign performance. It evaluates on the basis of KPIs such as conversion rate, cost per conversion, cost per click, etc. Presenting our well structured Digital Marketing Analytics Dashboard For E Commerce Brands The topics discussed in this slide are Digital Marketing, Analytics Dashboard, E Commerce Brands This is an instantly available PowerPoint presentation that can be edited conveniently. Download it right away and captivate your audience.
-
 Facebook Advertising Strategy Dashboard For Tracking Facebook Post Performance Strategy SS V
The following slide outlines dashboard through which advertisers can manage Facebook post performance and optimize their marketing strategy. Information covered in this slide is related to key metrics such as impressions per post, engagement rate, click-through rate CTR, likes, etc. Present the topic in a bit more detail with this Facebook Advertising Strategy Dashboard For Tracking Facebook Post Performance Strategy SS V Use it as a tool for discussion and navigation on Impressions Per Post, Dashboard, Post Performance This template is free to edit as deemed fit for your organization. Therefore download it now.
-
 Facebook Advertising Strategy Facebook Ads Dashboard With Campaign Performance Strategy SS V
The following slide outlines comprehensive dashboard through which advertisers can monitor Facebook ads performance. The KPIs outlined in slide are ad spend, conversions, cost per conversion, cost per action, brand impressions, clicks, etc. Deliver an outstanding presentation on the topic using this Facebook Advertising Strategy Facebook Ads Dashboard With Campaign Performance Strategy SS V Dispense information and present a thorough explanation of Campaign Results, Campaign Performance, Per Conversion using the slides given. This template can be altered and personalized to fit your needs. It is also available for immediate download. So grab it now.
-
 Facebook Advertising Strategy KPI Dashboard To Monitor Facebook Marketing Strategy SS V
The following slide outlines key performance indicator KPI dashboard which can be used to evaluate Facebook advertisement performance. The metrics mentioned in slide are total fans, page views, total actions, post likes, audience growth, fans by language, etc. Present the topic in a bit more detail with this Facebook Advertising Strategy KPI Dashboard To Monitor Facebook Marketing Strategy SS V Use it as a tool for discussion and navigation on KPI Dashboard, Marketing Strategy Performance This template is free to edit as deemed fit for your organization. Therefore download it now.
-
 Evaluating E Marketing Campaigns Kpi Dashboard To Analyze Digital Marketing Performance MKT SS V
This slide showcases the parameters that would help the business organization to evaluate digital marketing performance. It includes conversions, conversion rate, sessions, stickiness, engagement, bounce rate, etc. Present the topic in a bit more detail with this Evaluating E Marketing Campaigns Kpi Dashboard To Analyze Digital Marketing Performance MKT SS V. Use it as a tool for discussion and navigation on KPI Dashboard, Digital Marketing Performance, Conversion Rate, Stickiness. This template is free to edit as deemed fit for your organization. Therefore download it now.
-
 Evaluating E Marketing Campaigns Tracking The Improvements With Digital Marketing Dashboard MKT SS V
This slide showcases the KPIs that would help the business organization to evaluate digital marketing improvements. It includes ad cost, clicks, impressions, click through rate, cost per conversion, ad impressions, etc. Deliver an outstanding presentation on the topic using this Evaluating E Marketing Campaigns Tracking The Improvements With Digital Marketing Dashboard MKT SS V. Dispense information and present a thorough explanation of Digital Marketing Improvements, Cost Per Conversion, Ad Impressions, Digital Marketing Dashboard using the slides given. This template can be altered and personalized to fit your needs. It is also available for immediate download. So grab it now.
-
 Company Hospitality Training Evaluation Dashboard
This slide depicts dashboard highlighting analysis of hospitality training provided to employees to enhance customer service. Introducing our Company Hospitality Training Evaluation Dashboard set of slides. The topics discussed in these slides are Training, Current, Evaluation. This is an immediately available PowerPoint presentation that can be conveniently customized. Download it and convince your audience.
-
 Transforming From Traditional Dashboard Analytics Business Model Innovation Impact On Customer DT SS
This slide represents an analytics dashboard for measuring impact on customer satisfaction due to adoption of new digital business model. It tracks KPIS such as net promoter score, customer retention and customer effort score. Present the topic in a bit more detail with this Transforming From Traditional Dashboard Analytics Business Model Innovation Impact On Customer DT SS Use it as a tool for discussion and navigation on Net Promoter Score, Customer Retention, Customer Effort Score This template is free to edit as deemed fit for your organization. Therefore download it now.
-
 Transforming From Traditional Dashboard Analytics Measuring Impact On User Metrics And Revenue DT SS
This slide analyzes the impact od digital business model innovation on user metrics and recurring revenue of business. It tracks KPIs such as monthly recurring revenue, revenue growth, active users, life time value, cost of customer acquisition, churn rate, growth by channel, subscription plan, etc. Present the topic in a bit more detail with this Transforming From Traditional Dashboard Analytics Measuring Impact On User Metrics And Revenue DT SS Use it as a tool for discussion and navigation on Monthly Recurring Revenue, Monthly Revenue Growth, Active Users This template is free to edit as deemed fit for your organization. Therefore download it now.
-
 Effective Consumer Engagement Plan Dashboard Illustrating Customer Engagement Performance Metric
This slide represents a dashboard highlighting organizations current KPI performance following the adoption of a successful customer engagement strategy. It includes Net promoter score, customer effort score, NPS and CES monthly growth and satisfaction score. Deliver an outstanding presentation on the topic using this Effective Consumer Engagement Plan Dashboard Illustrating Customer Engagement Performance Metric. Dispense information and present a thorough explanation of KPI Performance, Customer Engagement Strategy, Net Promoter Score, Growth And Satisfaction Score using the slides given. This template can be altered and personalized to fit your needs. It is also available for immediate download. So grab it now.
-
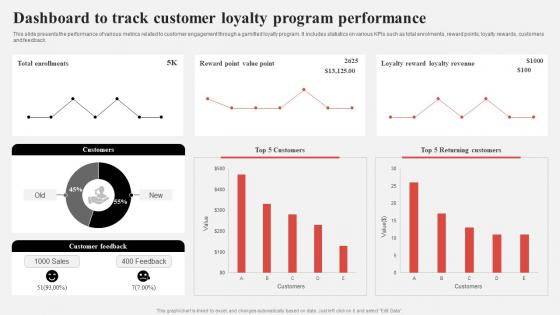 Effective Consumer Engagement Plan Dashboard To Track Customer Loyalty Program Performance
This slide presents the performance of various metrics related to customer engagement through a gamified loyalty program. It includes statistics on various KPIs such as total enrolments, reward points, loyalty rewards, customers and feedback. Present the topic in a bit more detail with this Effective Consumer Engagement Plan Dashboard To Track Customer Loyalty Program Performance. Use it as a tool for discussion and navigation on Dashboard To Track, Customer Loyalty Program, Reward Points, Loyalty Rewards. This template is free to edit as deemed fit for your organization. Therefore download it now.
-
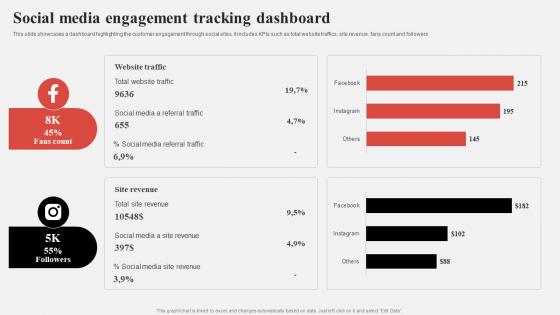 Effective Consumer Engagement Plan Social Media Engagement Tracking Dashboard
This slide showcases a dashboard highlighting the customer engagement through social sites. it includes KPIs such as total website traffics, site revenue, fans count and followers. Deliver an outstanding presentation on the topic using this Effective Consumer Engagement Plan Social Media Engagement Tracking Dashboard. Dispense information and present a thorough explanation of Social Media Engagement, Tracking Dashboard, Website Traffics, Site Revenue using the slides given. This template can be altered and personalized to fit your needs. It is also available for immediate download. So grab it now.
-
 Dashboard To Track Performance Of Multiple Comprehensive Guide For AI Based AI SS V
This slide showcases dashboard that can help organization to evaluate the performance of multiple chatbots. Its key elements are total bot conversations, bot sessions, engagement rate, bot escalation rate and chatbot metrics Deliver an outstanding presentation on the topic using this Dashboard To Track Performance Of Multiple Comprehensive Guide For AI Based AI SS V. Dispense information and present a thorough explanation of Track, Multiple, Performance using the slides given. This template can be altered and personalized to fit your needs. It is also available for immediate download. So grab it now.
-
 Responsibility Marketing Dashboard For Customer Satisfaction
This slide illustrates KPI or dashboard for responsibility marketing and includes metrics such as standard, energy efficiency, building materials, etc. Presenting our well structured Responsibility Marketing Dashboard For Customer Satisfaction. The topics discussed in this slide are Present Visitor Count, Overall Visitor Count Today, Intensity Index. This is an instantly available PowerPoint presentation that can be edited conveniently. Download it right away and captivate your audience.
-
 Responsibility Marketing Dashboard For Enabling Data Decisions
This slide illustrates KPI or dashboard for responsibility marketing and includes metrics such as standard, energy efficiency, building materials, etc. Introducing our Responsibility Marketing Dashboard For Enabling Data Decisions set of slides. The topics discussed in these slides are Energy Efficiency, Building Materials, Energy Efficiency. This is an immediately available PowerPoint presentation that can be conveniently customized. Download it and convince your audience.
-
 Social Media Analytics With Tools Dashboards For Social Media Analytics Tracking And Monitoring
This slide depicts the dashboard for Social Media Analytics insights. The purpose of this slide is to highlight insights such as brand awareness, audience growth, post-engagement rate, provider analytics, etc. Present the topic in a bit more detail with this Social Media Analytics With Tools Dashboards For Social Media Analytics Tracking And Monitoring. Use it as a tool for discussion and navigation on Dashboards For Social Media, Analytics Tracking And Monitoring, Brand Awareness, Audience Growth, Post Engagement Rate. This template is free to edit as deemed fit for your organization. Therefore download it now.
-
 Dashboard For Tracking Facebook Post Driving Web Traffic With Effective Facebook Strategy SS V
The following slide outlines dashboard through which advertisers can manage Facebook post performance and optimize their marketing strategy. Information covered in this slide is related to key metrics such as impressions per post, engagement rate, click-through rate CTR, likes, etc. Present the topic in a bit more detail with this Dashboard For Tracking Facebook Post Driving Web Traffic With Effective Facebook Strategy SS V. Use it as a tool for discussion and navigation on Tracking Facebook Post. This template is free to edit as deemed fit for your organization. Therefore download it now.
-
 Facebook Ads Dashboard With Campaign Driving Web Traffic With Effective Facebook Strategy SS V
The following slide outlines comprehensive dashboard through which advertisers can monitor Facebook ads performance. The KPIs outlined in slide are ad spend, conversions, cost per conversion, cost per action, brand impressions, clicks, etc. Deliver an outstanding presentation on the topic using this Facebook Ads Dashboard With Campaign Driving Web Traffic With Effective Facebook Strategy SS V. Dispense information and present a thorough explanation of Facebook Ads Dashboard using the slides given. This template can be altered and personalized to fit your needs. It is also available for immediate download. So grab it now.
-
 KPI Dashboard To Monitor Facebook Marketing Driving Web Traffic With Effective Facebook Strategy SS V
The following slide outlines key performance indicator KPI dashboard which can be used to evaluate Facebook advertisement performance. The metrics mentioned in slide are total fans, page views, total actions, post likes, audience growth, fans by language, etc. Present the topic in a bit more detail with this KPI Dashboard To Monitor Facebook Marketing Driving Web Traffic With Effective Facebook Strategy SS V. Use it as a tool for discussion and navigation on KPI Dashboard To Monitor, Facebook Marketing. This template is free to edit as deemed fit for your organization. Therefore download it now.
-
 Dashboard Analytics Measuring Supply Chain Efficiency Digital Transformation Of Retail DT SS
This slide represents a supply chain management dashboard measuring the efficiency of supply chain operations after effective digital transformation of retail operations. It includes inventory to sales, inventory turnover, carrying cost of inventory, inventory accuracy, and percentage out of stock items. Deliver an outstanding presentation on the topic using this Dashboard Analytics Measuring Supply Chain Efficiency Digital Transformation Of Retail DT SS Dispense information and present a thorough explanation of Dashboard Analytics, Carrying Cost Of Inventory, Supply Chain Efficiency using the slides given. This template can be altered and personalized to fit your needs. It is also available for immediate download. So grab it now.
-
 Dashboard Analytics Monitoring Retail Store Performance Digital Transformation Of Retail DT SS
This slide represents a retail KPI dashboard measuring the performance of retail store. It tracks KPIs such as sales revenue, customers, average transaction price, average units per customer, top five articles by sold items, total customers and visitors, collections by revenue , average price and units per transaction, etc. Present the topic in a bit more detail with this Dashboard Analytics Monitoring Retail Store Performance Digital Transformation Of Retail DT SS Use it as a tool for discussion and navigation on Sales Revenue, Customers, Transaction Price This template is free to edit as deemed fit for your organization. Therefore download it now.


