Powerpoint Templates and Google slides for Dashboards
Save Your Time and attract your audience with our fully editable PPT Templates and Slides.
-
 KPI Dashboard To Monitor Email Digital Email Plan Adoption For Brand Promotion
Mentioned slide demonstrates KPI showcasing email marketing performance which can be used by businesses to determine organization future growth opportunities. It includes key performance indictors such as conversion rate, open rate, click through rate, bounce rate, and email list growth rate. Deliver an outstanding presentation on the topic using this KPI Dashboard To Monitor Email Digital Email Plan Adoption For Brand Promotion. Dispense information and present a thorough explanation of Goal, Conversion, Email using the slides given. This template can be altered and personalized to fit your needs. It is also available for immediate download. So grab it now.
-
 Encryption Implementation Strategies Data Encryption Performance Tracking Dashboard
This slide represents the dashboard which can be utilized by organization to monitor cryptographic security. It includes overall progress, number of critical risks identified, initiatives, incident management, compliance, patches, highest number of critical incidents, etc. Present the topic in a bit more detail with this Encryption Implementation Strategies Data Encryption Performance Tracking Dashboard. Use it as a tool for discussion and navigation on Data Encryption Performance, Tracking Dashboard, Critical Incidents, Incident Management. This template is free to edit as deemed fit for your organization. Therefore download it now.
-
 Dashboard For Monitoring IoT Connected Impact Of IoT Technology In Revolutionizing IoT SS
This slide provides a dashboard for tracking the performance of IoT devices. It incorporates information from IoT sensors related to automobile details, fuel level, engine speed, battery voltage, tire pressure, engine load, air intake, throttle position, etc.Deliver an outstanding presentation on the topic using this Dashboard For Monitoring IoT Connected Impact Of IoT Technology In Revolutionizing IoT SS. Dispense information and present a thorough explanation of Vehicle Information, Fuel Level Indicator, Vehicle Speed using the slides given. This template can be altered and personalized to fit your needs. It is also available for immediate download. So grab it now.
-
 Dashboard For Monitoring Public Transport Impact Of IoT Technology In Revolutionizing IoT SS
This slide provides a dashboard for tracking the performance and delays of public transport vehicles. It includes specific parameters such as delays per minute, downtime, repair costs, actual budget, and weekday and weekend performance.Present the topic in a bit more detail with this Dashboard For Monitoring Public Transport Impact Of IoT Technology In Revolutionizing IoT SS. Use it as a tool for discussion and navigation on Delay Per Minutes, Downtime Analysis, Repair Cost Analysis. This template is free to edit as deemed fit for your organization. Therefore download it now.
-
 Healthcare Marketing Dashboard To Building Brand In Healthcare Strategy SS V
The following slide outlines comprehensive dashboard through which medical care companies can evaluate patient experience and make more informed decisions. The metrics outlined in slide are lab test, patient falls, average waiting time, etc. Present the topic in a bit more detail with this Healthcare Marketing Dashboard To Building Brand In Healthcare Strategy SS V. Use it as a tool for discussion and navigation on Marketing, Average, Satisfaction. This template is free to edit as deemed fit for your organization. Therefore download it now.
-
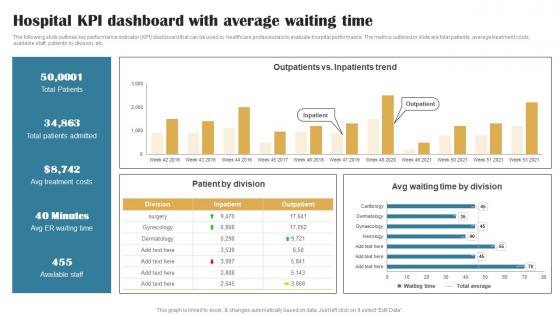 Hospital KPI Dashboard With Average Building Brand In Healthcare Strategy SS V
The following slide outlines key performance indicator KPI dashboard that can be used by healthcare professionals to evaluate hospital performance. The metrics outlined in slide are total patients, average treatment costs, available staff, patients by division, etc. Deliver an outstanding presentation on the topic using this Hospital KPI Dashboard With Average Building Brand In Healthcare Strategy SS V. Dispense information and present a thorough explanation of Average, Patients, Treatment using the slides given. This template can be altered and personalized to fit your needs. It is also available for immediate download. So grab it now.
-
 Influencer Marketing Campaign Management Dashboard Social Media Influencer Strategy SS V
This slide represents the KPI dashboard to track and analyze the performance of influencer marketing campaign conducted by the organization. It includes details related to KPIs such as reads, unique clicks, reactions etc. Deliver an outstanding presentation on the topic using this Influencer Marketing Campaign Management Dashboard Social Media Influencer Strategy SS V. Dispense information and present a thorough explanation of Direct Clicks, Reactions using the slides given. This template can be altered and personalized to fit your needs. It is also available for immediate download. So grab it now.
-
 Influencer Marketing Performance Analysis Dashboard Social Media Influencer Strategy SS V
This slide represents the dashboard to measure and monitor the overall performance of influencer marketing campaign organized by the enterprise. It includes details related to KPIs such as conversions, bounce rate etc. Present the topic in a bit more detail with this Influencer Marketing Performance Analysis Dashboard Social Media Influencer Strategy SS V. Use it as a tool for discussion and navigation on Top Channels, Conversions. This template is free to edit as deemed fit for your organization. Therefore download it now.
-
 Clinical Process Dashboard For Healthcare Providers
This slide depicts KPI dashboard of clinical process which helps to compare inflow and outflow of patients in hospitals. It includes details about number of patients, inpatients, outpatients, discharges and graph which classifies patients by admission type and discharges by diagnosis. Introducing our Clinical Process Dashboard For Healthcare Providers set of slides. The topics discussed in these slides are Admission, Discharges, Diagnosis. This is an immediately available PowerPoint presentation that can be conveniently customized. Download it and convince your audience.
-
 E Commerce Sales Dashboard Of ABC Company
This slide showcases the online sales dashboard of ABC organization which helps them to reduce processing cost, attracts new consumers, collect data and operate business from anywhere. It include details such as bedsheets, tables, jackets, carpets and shoes. Presenting our well structured E Commerce Sales Dashboard Of ABC Company. The topics discussed in this slide are Amount, Total, Quantity. This is an instantly available PowerPoint presentation that can be edited conveniently. Download it right away and captivate your audience.
-
 Dashboard For Tracking Post Expansion Revenue By Product Type Worldwide Approach Strategy SS V
This slide covers the dashboard for analyzing fast food business sales by location. It includes KPIs such as the companys revenue by location, by type, top 5 expenses by account, top 5 expenses by department, cost of revenue year to date, etc. Deliver an outstanding presentation on the topic using this Dashboard For Tracking Post Expansion Revenue By Product Type Worldwide Approach Strategy SS V. Dispense information and present a thorough explanation of Expenses By Account, Dashboard using the slides given. This template can be altered and personalized to fit your needs. It is also available for immediate download. So grab it now.
-
 Dashboard For Tracking Post Expansion Sales By Region Worldwide Approach Strategy SS V
This slide covers the dashboard for analyzing fast food business sales by region. It includes KPIs such as sales, sales target, target achievement, gross profit, gross profit margin, sales by channels, sales growth, etc. Present the topic in a bit more detail with this Dashboard For Tracking Post Expansion Sales By Region Worldwide Approach Strategy SS V. Use it as a tool for discussion and navigation on Sales By Channel, Actual Sales Vs Target. This template is free to edit as deemed fit for your organization. Therefore download it now.
-
 Iot Device For Patient Health Monitoring Dashboard Asset Tracking And Management IoT SS
Following slide highlights dashboard that provides insights about patient health summary through IoT devices. It includes parameters such as sleep hours, step counter, heart rate etc. Present the topic in a bit more detail with this Iot Device For Patient Health Monitoring Dashboard Asset Tracking And Management IoT SS. Use it as a tool for discussion and navigation on Patient Health Summary, Step Walked. This template is free to edit as deemed fit for your organization. Therefore download it now.
-
 Smart Attendance Tracking Systems Dashboard Asset Tracking And Management IoT SS
Following slide highlights dashboard to monitor and track student attendance by using Io enabled asset tracking devices. It includes indicators such as overtime, statistics, source, exceptions, pending requests, etc. Present the topic in a bit more detail with this Smart Attendance Tracking Systems Dashboard Asset Tracking And Management IoT SS. Use it as a tool for discussion and navigation on On Time Check In, Pending Requests. This template is free to edit as deemed fit for your organization. Therefore download it now.
-
 Building Financial Process Dashboard For Analyzing Cashflow
This slide highlights financial process dashboard for providing companys financial health status and outperforming financial objectives. It includes metrics such as current ratio, working capital ratio, liquid assets, closing month cash, etc. Presenting our well structured Building Financial Process Dashboard For Analyzing Cashflow. The topics discussed in this slide are Closing Month Cash, Accounts Payable Turnover.This is an instantly available PowerPoint presentation that can be edited conveniently. Download it right away and captivate your audience.
-
 Track Onboarding Progress For Human Resource Dashboard
This slide represents dashboard metrics for effective human resource onboarding process to evaluate retention rate and compliance methods. It includes various KPIs such as incoming new hires, quarterly new hires, YoY turnover, etc. Presenting our well structured Track Onboarding Progress For Human Resource Dashboard. The topics discussed in this slide are Human Resource, Onboarding Dashboard.This is an instantly available PowerPoint presentation that can be edited conveniently. Download it right away and captivate your audience.
-
 KPI Dashboard To Monitor Email Marketing Subscribers Complete Guide To Implement Email
Mentioned slide demonstrates KPI showcasing email marketing performance which can be used by businesses to determine organisation future growth opportunities. It includes key performance indictors such as conversion rate, open rate, click through rate, bounce rate, and email list growth rate. Present the topic in a bit more detail with this KPI Dashboard To Monitor Email Marketing Subscribers Complete Guide To Implement Email. Use it as a tool for discussion and navigation on Email Marketing, Web Conversation. This template is free to edit as deemed fit for your organization. Therefore download it now.
-
 Implementing His To Enhance Dashboard To Assess Performance Of Integrating Health It System
This slide covers KPI dashboard to analyze improved performance after implementing health information technology system in organization. It involves details such as outpatient trends, average waiting time and overall patient satisfaction. Deliver an outstanding presentation on the topic using this Implementing His To Enhance Dashboard To Assess Performance Of Integrating Health It System. Dispense information and present a thorough explanation of Patient Satisfaction Rate, Average Waiting Time using the slides given. This template can be altered and personalized to fit your needs. It is also available for immediate download. So grab it now.
-
 Comprehensive Guide To Google Dashboard To Monitor Performance Insights From Google MKT SS V
This slide covers dashboards to monitor performance insights for advertising campaign launched on Google platform. The purpose of this template is to track and measure the effectiveness of companys ad campaigns. It includes elements such as campaign name and type, budget, status, impressions, CTR, CPC and cost. Deliver an outstanding presentation on the topic using this Comprehensive Guide To Google Dashboard To Monitor Performance Insights From Google MKT SS V Dispense information and present a thorough explanation of Status Campaign, Type, Campaign Subtype using the slides given. This template can be altered and personalized to fit your needs. It is also available for immediate download. So grab it now.
-
 Comprehensive Guide To Google Dashboard To Track Top Google Ads Campaign Performances MKT SS V
This slide covers dashboards to monitor performance of advertising campaign launched on Google platform. The purpose of this template is to track and measure the effectiveness of companys ad campaigns. It includes elements such as conversion rates, cost per conversion, impressions and clicks along with top keywords and campaigns. Present the topic in a bit more detail with this Comprehensive Guide To Google Dashboard To Track Top Google Ads Campaign Performances MKT SS V Use it as a tool for discussion and navigation on Google Ads Clicks, Google Ads Conversions, Conversions By Campaign This template is free to edit as deemed fit for your organization. Therefore download it now.
-
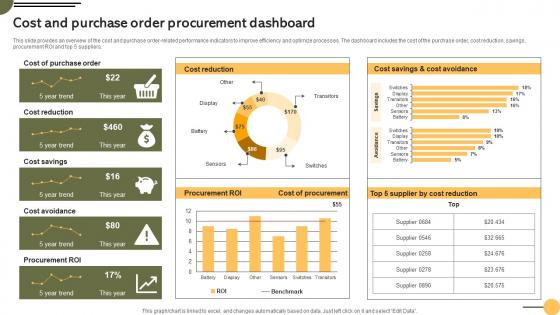 Cost And Procurement Dashboard Achieving Business Goals Procurement Strategies Strategy SS V
This slide provides an overview of the cost and purchase order-related performance indicators to improve efficiency and optimize processes. The dashboard includes the cost of the purchase order, cost reduction, savings, procurement ROI and top 5 suppliers. Deliver an outstanding presentation on the topic using this Cost And Procurement Dashboard Achieving Business Goals Procurement Strategies Strategy SS V. Dispense information and present a thorough explanation of Procurement, Dashboard, Performance using the slides given. This template can be altered and personalized to fit your needs. It is also available for immediate download. So grab it now.
-
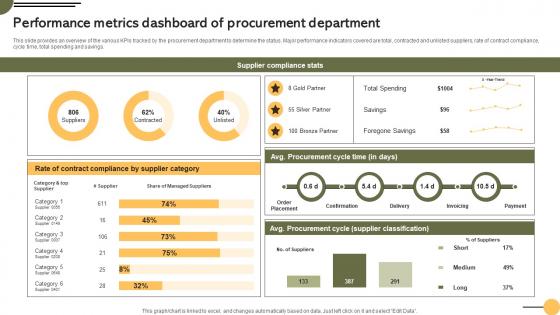 Performance Metrics Dashboard Achieving Business Goals Procurement Strategies Strategy SS V
This slide provides an overview of the various KPIs tracked by the procurement department to determine the status. Major performance indicators covered are total, contracted and unlisted suppliers, rate of contract compliance, cycle time, total spending and savings. Present the topic in a bit more detail with this Performance Metrics Dashboard Achieving Business Goals Procurement Strategies Strategy SS V. Use it as a tool for discussion and navigation on Performance, Procurement, Department. This template is free to edit as deemed fit for your organization. Therefore download it now.
-
 Dashboard To Evaluate Targeted Social Media Database Marketing Strategies MKT SS V
The purpose of this slide is to outline a comprehensive dashboard through which marketers can analyze effectiveness of targeted social media campaign performance. The key performance indicators KPIs are social media followers, LinkedIn key metrics, page likes, page impressions, etc. Present the topic in a bit more detail with this Dashboard To Evaluate Targeted Social Media Database Marketing Strategies MKT SS V. Use it as a tool for discussion and navigation on Social Media Followers, Instagram Overview. This template is free to edit as deemed fit for your organization. Therefore download it now.
-
 Kpi Dashboard To Analyze Overall Business Database Marketing Strategies MKT SS V
The purpose of this slide is to highlight dashboard through which marketers can evaluate success of targeted marketing strategies on company performance. It covers major metrics such as branded search, customer value, advertising budget, website conversion rate, etc. Present the topic in a bit more detail with this Kpi Dashboard To Analyze Overall Business Database Marketing Strategies MKT SS V. Use it as a tool for discussion and navigation on Brand Last Month, Total Number. This template is free to edit as deemed fit for your organization. Therefore download it now.
-
 Kpi Dashboard To Analyze Targeted Email Marketing Database Marketing Strategies MKT SS V
The purpose of this slide is to highlight key performance indicator KPI dashboard which can be used by marketers to evaluate targeted email marketing campaign performance. The metrics are requests, opens, clicks, opens by country, opens vs clicks by month, etc. Deliver an outstanding presentation on the topic using this Kpi Dashboard To Analyze Targeted Email Marketing Database Marketing Strategies MKT SS V. Dispense information and present a thorough explanation of Delivered Percentage, Device Comparison using the slides given. This template can be altered and personalized to fit your needs. It is also available for immediate download. So grab it now.
-
 Bookkeeping Dashboard Representing Business Cash Flow
This slide showcases the bookkeeping dashboard illustrating companys cashflow which helps an organization to assist in decision making process and develop proper financial statements. It include details such as infrastructure expense, automotive, office supplies, rent, etc. Presenting our well structured Bookkeeping Dashboard Representing Business Cash Flow. The topics discussed in this slide are Expenditure. This is an instantly available PowerPoint presentation that can be edited conveniently. Download it right away and captivate your audience.
-
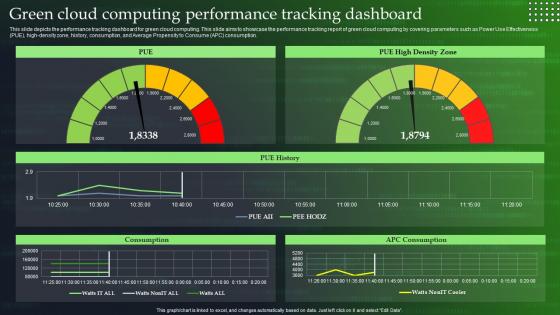 Green Cloud Computing V2 Performance Tracking Dashboard
This slide depicts the performance tracking dashboard for green cloud computing. This slide aims to showcase the performance tracking report of green cloud computing by covering parameters such as Power Use Effectiveness PUE, high-density zone, history, consumption, and Average Propensity to Consume APC consumption. Deliver an outstanding presentation on the topic using this Green Cloud Computing V2 Performance Tracking Dashboard. Dispense information and present a thorough explanation of Green Cloud Computing Performance, Tracking Dashboard, Average Propensity To Consume Consumption using the slides given. This template can be altered and personalized to fit your needs. It is also available for immediate download. So grab it now.
-
 Deploying QMS Dashboard To Analyze Customer Service Quality Strategy SS V
This slide covers KPI dashboard to analyze customer service quality. It involves details such as first call resolution, percentage of unresolved calls, average response time and total percentage of calls. Deliver an outstanding presentation on the topic using this Deploying QMS Dashboard To Analyze Customer Service Quality Strategy SS V. Dispense information and present a thorough explanation of Average Percentage Of Calls, Daily Response Time, Service Quality using the slides given. This template can be altered and personalized to fit your needs. It is also available for immediate download. So grab it now.
-
 Deploying QMS Enterprise Quality Control KPI Dashboard Strategy SS V
This slide covers KPI dashboard to assess quality control system in organization It involves details such as total issues, issue status and KPIs such as efficiency, customer service and effectiveness indicator. Deliver an outstanding presentation on the topic using this Deploying QMS Enterprise Quality Control KPI Dashboard Strategy SS V. Dispense information and present a thorough explanation of Quality Issue Status, Overall Quality Status, Severity using the slides given. This template can be altered and personalized to fit your needs. It is also available for immediate download. So grab it now.
-
 Deploying QMS KPI Dashboard To Assess Supplier Quality Strategy SS V
This slide covers KPI dashboard to analyze supplier quality. It involves details such as suppliers with most and least complaints, defects and late deliveries trend analysis. Present the topic in a bit more detail with this Deploying QMS KPI Dashboard To Assess Supplier Quality Strategy SS V. Use it as a tool for discussion and navigation on Least Preferred, Category Of Quality Complaints, Defects And Late Deliveries. This template is free to edit as deemed fit for your organization. Therefore download it now.
-
 Deploying QMS KPI Dashboard To Track Performance Of Quality Management System Strategy SS V
This slide covers KPI dashboard to assess quality management system performance. It involves details such as complaints by customer, quality actions by supplier and product line. Deliver an outstanding presentation on the topic using this Deploying QMS KPI Dashboard To Track Performance Of Quality Management System Strategy SS V. Dispense information and present a thorough explanation of Quality Actions, Product Line, Complaints By Customer using the slides given. This template can be altered and personalized to fit your needs. It is also available for immediate download. So grab it now.
-
 Private Blockchain Platform Monitoring Dashboard Complete Guide To Understand BCT SS
This slide covers dashboard to monitor and evaluate performance of private blockchain network platform. It includes elements such as status of blockchain nodes, runtimes, activity logs, etc. for monitoring overall performance of network nodes. Present the topic in a bit more detail with this Private Blockchain Platform Monitoring Dashboard Complete Guide To Understand BCT SS Use it as a tool for discussion and navigation on Overview, Environment Dashboard, Blockchain Nodes This template is free to edit as deemed fit for your organization. Therefore download it now.
-
 Financial Metrics Data Driven Dashboard For Data Analysis
This slide highlights data driven dashboard for tracking, analyzing and displaying KPIs and metrics. It includes financial KPIs such as current fixed capital, cash flow cycle, supplier payment error rate, etc. Introducing our Financial Metrics Data Driven Dashboard For Data Analysis set of slides. The topics discussed in these slides are Quick Assets, Current Fixed Capital. This is an immediately available PowerPoint presentation that can be conveniently customized. Download it and convince your audience.
-
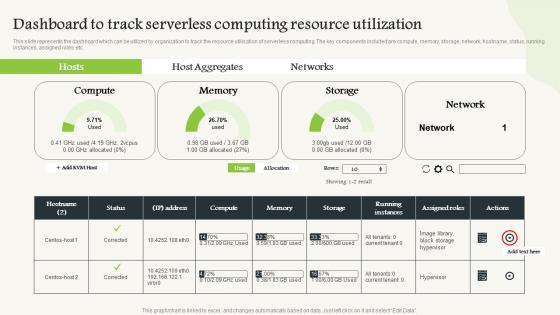 Dashboard To Track Serverless Computing V2 Resource Utilization
This slide represents the dashboard which can be utilized by organization to track the resource utilisation of serverless computing. The key components included are compute, memory, storage, network, hostname, status, running instances, assigned roles, etc. Present the topic in a bit more detail with this Dashboard To Track Serverless Computing V2 Resource Utilization. Use it as a tool for discussion and navigation on Dashboard To Track, Serverless Computing, Resource Utilization, Running Instances. This template is free to edit as deemed fit for your organization. Therefore download it now.
-
 Dashboard To Monitor Industrial Maintenance Status
This slide depicts the dashboard for tracking the effectiveness of industrial maintenance. This slide aims to help the maintenance manager track the status of machinery repair. It includes elements such as current maintenance plans, total maintenance cost amount, etc. Introducing our Dashboard To Monitor Industrial Maintenance Status set of slides. The topics discussed in these slides are Current Maintenance Plan, Maintenance Cost Amount, Expired Plans. This is an immediately available PowerPoint presentation that can be conveniently customized. Download it and convince your audience.
-
 Information Technology Virtualization KPI Dashboard
This slide covers various metrics of virtualization and provides details about system types, performance of machines in organization. It includes elements such as memory, CPU, disk, etc. Introducing our Information Technology Virtualization KPI Dashboard set of slides. The topics discussed in these slides are Virtualization Platforms, VM Status Over Time, VM Platform. This is an immediately available PowerPoint presentation that can be conveniently customized. Download it and convince your audience.
-
 Dashboard To Evaluate Linkedin Marketing Strategy Performance Metrics
This slide depicts the dashboard for tracking LinkedIn advertising strategy performance metrics. This slide aims to help the business assess the performance of its marketing strategy through the use of LinkedIn metrics such as followers, gained impressions generated, etc. Introducing our Dashboard To Evaluate Linkedin Marketing Strategy Performance Metrics set of slides. The topics discussed in these slides are Customer Conversion Rate, Cost Per Customer Conversion, Social Actions Over Time. This is an immediately available PowerPoint presentation that can be conveniently customized. Download it and convince your audience.
-
 Dashboard To Track Linkedin Performance Metrics
This slide showcases the dashboard for monitoring LinkedIn performance metrics. The purpose of this slide is to help the business track its page performance in order to improve weaknesses. It includes elements such as view statistics, company updates in the last ten days, etc. Presenting our well structured Dashboard To Track Linkedin Performance Metrics. The topics discussed in this slide are Viewer Statistics, Viewer Engagement, Occupation Functions. This is an instantly available PowerPoint presentation that can be edited conveniently. Download it right away and captivate your audience.
-
 Dashboard To Track Linkedin Performance Metrics Of Business Profile
This slide shows the dashboard for monitoring LinkedIn performance KPIs of the company profile. The purpose of this slide is to help the business track the performance of it LinkedIn profile for increasing its online visibility. It includes elements such as viewers gained, engagement performance, etc. Introducing our Dashboard To Track Linkedin Performance Metrics Of Business Profile set of slides. The topics discussed in these slides are Viewers Gained, Engagement Performance, Viewers Categorized Industry. This is an immediately available PowerPoint presentation that can be conveniently customized. Download it and convince your audience.
-
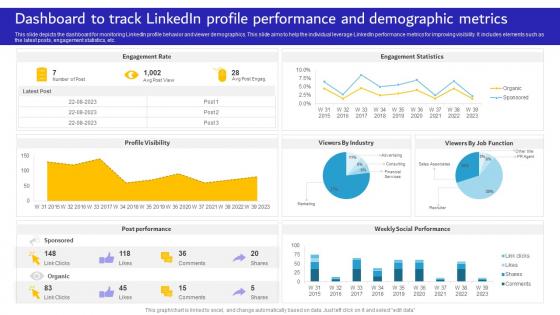 Dashboard To Track Linkedin Profile Performance And Demographic Metrics
This slide depicts the dashboard for monitoring LinkedIn profile behavior and viewer demographics. This slide aims to help the individual leverage LinkedIn performance metrics for improving visibility. It includes elements such as the latest posts, engagement statistics, etc. Presenting our well structured Dashboard To Track Linkedin Profile Performance And Demographic Metrics. The topics discussed in this slide are Engagement Rate, Engagement Statistics, Profile Visibility. This is an instantly available PowerPoint presentation that can be edited conveniently. Download it right away and captivate your audience.
-
 Business Intelligence Dashboard For Tracking Operating Environment
This slide represents KPI dashboard of operating environment for monitoring business metrics and data points related to business unit. It includes metrics such as study artifacts, notification box, flow diagram, operations manager, etc. Presenting our well structured Business Intelligence Dashboard For Tracking Operating Environment. The topics discussed in this slide are Study Artifacts, Notification Box, Flow Diagram. This is an instantly available PowerPoint presentation that can be edited conveniently. Download it right away and captivate your audience.
-
 Risk Trends Analytics Dashboard For Strategic Planning
This slide illustrates KPI dashboard for risk trends to provide visual and data driven overview of evolving risk. It includes metrics such as tech publication, digital finance, IT blogger, analytics dashboard, etc. Presenting our well structured Risk Trends Analytics Dashboard For Strategic Planning. The topics discussed in this slide are Leadership, Improving, Development. This is an instantly available PowerPoint presentation that can be edited conveniently. Download it right away and captivate your audience.
-
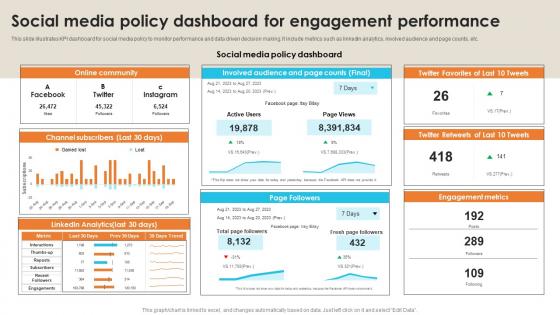 Social Media Policy Dashboard For Engagement Performance
This slide illustrates KPI dashboard for social media policy to monitor performance and data driven decision making. It include metrics such as linkedin analytics, involved audience and page counts, etc. Introducing our Social Media Policy Dashboard For Engagement Performance set of slides. The topics discussed in these slides are Online Community, Involved Audience, Channel Subscribers. This is an immediately available PowerPoint presentation that can be conveniently customized. Download it and convince your audience.
-
 Dashboard For Analysis Of Business Product Survey Data
This slide showcases the dashboard for analysis of companys product survey data. The purpose of this slide is to help the researcher enhance their understanding of public sentiment and demography, regarding the product, through data visualization. It includes elements such as buyer age group segregation, buyer sentiment analysis, etc. Introducing our Dashboard For Analysis Of Business Product Survey Data set of slides. The topics discussed in these slides are Group Segregation, Regularity Product, Buyer Sentiment Analysis. This is an immediately available PowerPoint presentation that can be conveniently customized. Download it and convince your audience.
-
 Dashboard Representing Customer Satisfaction Survey Data
This slide highlights the dashboard for representing customer satisfaction survey data. The purpose of this slide is to help the business track and analyze customer satisfaction. It includes elements such as net promoter score for the current month, customer effort score for the current month, etc. Presenting our well structured Dashboard Representing Customer Satisfaction Survey Data. The topics discussed in this slide are Net Promoter Score, Customer Effort Score, Customer Evaluation. This is an instantly available PowerPoint presentation that can be edited conveniently. Download it right away and captivate your audience.
-
 Tracking Waste Administration KPI Dashboard
This slide covers various metrics to track garbage and determine details about the status of transportation, and employees. It includes elements such as driver status, bin status, fuel consumption, etc. Introducing our Tracking Waste Administration KPI Dashboard set of slides. The topics discussed in these slides are Driver Status, Bin Status, Truck Status. This is an immediately available PowerPoint presentation that can be conveniently customized. Download it and convince your audience.
-
 Workflow Automation Process Dashboard For Project Management
This slide depicts overview of automating workflow process of particular project to manage and complete task efficiently. It includes parameters such as project execution per day, success v s failed project execution etc. Introducing our Workflow Automation Process Dashboard For Project Management set of slides. The topics discussed in these slides are Workflow Execution, Trigger Source Breakdown, Project Execution Per. This is an immediately available PowerPoint presentation that can be conveniently customized. Download it and convince your audience.
-
 Dashboard To Track Energy Efficiency In Business Plant
This slide highlights the dashboard for monitoring the energy efficiency in a business plant. The purpose of this slide is to help monitor energy consumption and identify wastage in order to reduce overall energy costs. It includes elements such as total energy consumption, total sales generated by the plant, etc. Introducing our Dashboard To Track Energy Efficiency In Business Plant set of slides. The topics discussed in these slides are Sector Wise Energy Consumption, Plant Energy Sources, Renewable Energy Consumption. This is an immediately available PowerPoint presentation that can be conveniently customized. Download it and convince your audience.
-
 Supplier Quality Management Dashboard To Analyze Customer Service Quality Strategy SS V
This slide covers KPI dashboard to analyze customer service quality. It involves details such as first call resolution, percentage of unresolved calls, average response time and total percentage of calls. Present the topic in a bit more detail with this Supplier Quality Management Dashboard To Analyze Customer Service Quality Strategy SS V. Use it as a tool for discussion and navigation on Dashboard To Analyze, Customer Service Quality, First Call Resolution. This template is free to edit as deemed fit for your organization. Therefore download it now.
-
 Supplier Quality Management Enterprise Quality Control KPI Dashboard Strategy SS V
This slide covers KPI dashboard to assess quality control system in organization It involves details such as total issues, issue status and KPIs such as efficiency, customer service and effectiveness indicator. Deliver an outstanding presentation on the topic using this Supplier Quality Management Enterprise Quality Control KPI Dashboard Strategy SS V. Dispense information and present a thorough explanation of Enterprise Quality Control, Customer Service, Effectiveness Indicator using the slides given. This template can be altered and personalized to fit your needs. It is also available for immediate download. So grab it now.
-
 Supplier Quality Management KPI Dashboard To Assess Supplier Quality Strategy SS V
This slide covers KPI dashboard to analyze supplier quality. It involves details such as suppliers with most and least complaints, defects and late deliveries trend analysis. Present the topic in a bit more detail with this Supplier Quality Management KPI Dashboard To Assess Supplier Quality Strategy SS V. Use it as a tool for discussion and navigation on KPI Dashboard, Supplier Quality, Category Of Quality Complaints. This template is free to edit as deemed fit for your organization. Therefore download it now.
-
 Supplier Quality Management KPI Dashboard To Track Performance Of Quality Management Strategy SS V
This slide covers KPI dashboard to assess quality management system performance. It involves details such as complaints by customer, quality actions by supplier and product line. Deliver an outstanding presentation on the topic using this Supplier Quality Management KPI Dashboard To Track Performance Of Quality Management Strategy SS V. Dispense information and present a thorough explanation of KPI Dashboard, Track Performance, Quality Management System, Supplier And Product Line using the slides given. This template can be altered and personalized to fit your needs. It is also available for immediate download. So grab it now.
-
 Corporate Tax Dashboard For Future Planning
This slide depicts dashboard highlighting summary of corporate tax of particular year for helping company to make proper financial plan in future to save tax. It involves metrics such as tax summary, average ETR and total expense income graph. Introducing our Corporate Tax Dashboard For Future Planning set of slides. The topics discussed in these slides are Average, Income, Planning. This is an immediately available PowerPoint presentation that can be conveniently customized. Download it and convince your audience.
-
 Password Security Dashboard To Prevent Data Theft
This slide highlights a performance dashboard to track data breach password security. The purpose of this slide is to show the key performance metrics that need to be tracked and managed to prevent data theft. It includes password assessment score, security pros, password actions, etc. Introducing our Password Security Dashboard To Prevent Data Theft set of slides. The topics discussed in these slides are Security, Prevent, Data. This is an immediately available PowerPoint presentation that can be conveniently customized. Download it and convince your audience.
-
 KPI Dashboard To Track Supplier Relationship Management Stakeholders Relationship Administration
Mentioned slide provides information about various key performance indicators which can be used to evaluate impact of relations management on suppliers performance, it includes key points such as total suppliers, contracted, unlisted, average procurement cycle, suppliers share by different products. etc. Deliver an outstanding presentation on the topic using this KPI Dashboard To Track Supplier Relationship Management Stakeholders Relationship Administration. Dispense information and present a thorough explanation of Suppliers By Different Products, Procurement Cycle using the slides given. This template can be altered and personalized to fit your needs. It is also available for immediate download. So grab it now.
-
 Key Metrics Dashboard To Track And Analyse Hiring Recruitment Strategies For Organizational
Following slide represents dashboard that helps to analyse recruitment funnel to track employee staffing process. It includes metrics such as time to hire, time to fill, recruitment costs, age of applicants etc. Deliver an outstanding presentation on the topic using this Key Metrics Dashboard To Track And Analyse Hiring Recruitment Strategies For Organizational. Dispense information and present a thorough explanation of Female Ratio, Age Of Applicants using the slides given. This template can be altered and personalized to fit your needs. It is also available for immediate download. So grab it now.
-
 KPIs Dashboard To Track Hiring Progress Of Company Recruitment Strategies For Organizational
Following slide exhibits dashboard to track hiring process that helps recruitment team to achieve goals. It includes elements such as hires per month, hires, average time to hire, offer acceptance rate etc. Present the topic in a bit more detail with this KPIs Dashboard To Track Hiring Progress Of Company Recruitment Strategies For Organizational. Use it as a tool for discussion and navigation on Hires, Hires Per Month. This template is free to edit as deemed fit for your organization. Therefore download it now.
-
 Secure Access Service Edge Performance Tracking Dashboard Cloud Security Model
This slide demonstrates the performance tracking dashboard for secure access service edge. The purpose of this slide is to showcase the overall performance of the SASE model, including connections, critical network alarms, critical security alerts, application volume, risky applications, and unblocked security threats. Deliver an outstanding presentation on the topic using this Secure Access Service Edge Performance Tracking Dashboard Cloud Security Model. Dispense information and present a thorough explanation of Service, Secure, Performance using the slides given. This template can be altered and personalized to fit your needs. It is also available for immediate download. So grab it now.
-
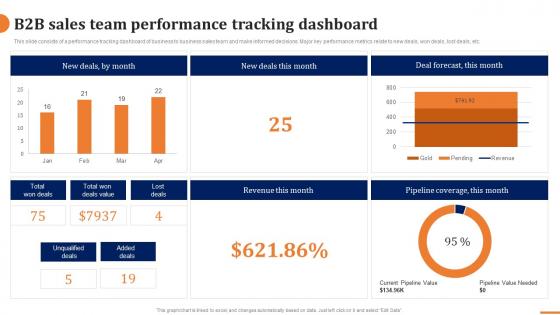 B2b Sales Team Performance Tracking Dashboard How To Build A Winning B2b Sales Plan
This slide consists of a performance tracking dashboard of business to business sales team and make informed decisions. Major key performance metrics relate to new deals, won deals, lost deals, etc. Deliver an outstanding presentation on the topic using this B2b Sales Team Performance Tracking Dashboard How To Build A Winning B2b Sales Plan. Dispense information and present a thorough explanation of Performance, Dashboard, Revenue using the slides given. This template can be altered and personalized to fit your needs. It is also available for immediate download. So grab it now.
-
 Customer Analysis Dashboard For B2b Business Website How To Build A Winning B2b Sales Plan
This slide depicts a dashboard for tracking customer data on B2B business website in order to make informed strategic decisions. Major key performance indicators relate to website visitors, total sessions, page views, etc. Present the topic in a bit more detail with this Customer Analysis Dashboard For B2b Business Website How To Build A Winning B2b Sales Plan. Use it as a tool for discussion and navigation on Analysis, Dashboard, Business Website. This template is free to edit as deemed fit for your organization. Therefore download it now.


