Powerpoint Templates and Google slides for Dashboard Highlighting
Save Your Time and attract your audience with our fully editable PPT Templates and Slides.
-
 KPI Dashboard Highlighting Results Of Email Bounce
This template showcase email bounce result oriented dashboard. The main purpose of this slide is to keep a track of all the emails weather they are sent or not and also the record of unsubscribes. This includes data about all engagement that is taking place in business. Presenting our well structured KPI Dashboard Highlighting Results Of Email Bounce. The topics discussed in this slide are Results, Email, Bounce. This is an instantly available PowerPoint presentation that can be edited conveniently. Download it right away and captivate your audience.
-
 KPI Dashboard Highlighting Result Of Marketing Campaign Developing B2B Marketing Strategies MKT SS V
The following slide showcases a comprehensive key performance indicator KPI dashboard which can be used to showcase the outcome of marketing campaign. The major metrics covered in the slide are brand mentions, customer lifetime value CLV, customer acquisition cost CAC, net promoter score NPS, etc. Deliver an outstanding presentation on the topic using this KPI Dashboard Highlighting Result Of Marketing Campaign Developing B2B Marketing Strategies MKT SS V. Dispense information and present a thorough explanation of Demographic Breakdown, Customer Value using the slides given. This template can be altered and personalized to fit your needs. It is also available for immediate download. So grab it now.
-
 KPI Dashboard Highlighting Public Adopting Integrated Marketing Communication MKT SS V
The following slide depicts key performance indicators to evaluate public relations efforts and increase brand visibility. It includes elements such as press releases, blog entries, social media updates, news releases etc. Deliver an outstanding presentation on the topic using this KPI Dashboard Highlighting Public Adopting Integrated Marketing Communication MKT SS V. Dispense information and present a thorough explanation of Public, Relations, Metrics using the slides given. This template can be altered and personalized to fit your needs. It is also available for immediate download. So grab it now.
-
 KPI Dashboard Highlighting Public Relations Metrics Integrated Marketing Communication MKT SS V
The following slide depicts key performance indicators to evaluate public relations efforts and increase brand visibility. It includes elements such as press releases, blog entries, social media updates, news releases etc. Present the topic in a bit more detail with this KPI Dashboard Highlighting Public Relations Metrics Integrated Marketing Communication MKT SS V. Use it as a tool for discussion and navigation on Press Releases Syndicated, Blog Entries Posted. This template is free to edit as deemed fit for your organization. Therefore download it now.
-
 Kpi Dashboard Highlighting Public Relations Metrics Steps To Execute Integrated MKT SS V
The following slide depicts key performance indicators to evaluate public relations efforts and increase brand visibility. It includes elements such as press releases, blog entries, social media updates, news releases etc. Present the topic in a bit more detail with this Kpi Dashboard Highlighting Public Relations Metrics Steps To Execute Integrated MKT SS V. Use it as a tool for discussion and navigation on Social Media Updates, Press Releases Syndicated. This template is free to edit as deemed fit for your organization. Therefore download it now.
-
 KPI Dashboard Highlighting Public Relations Integrated Marketing Communication MKT SS V
The following slide depicts key performance indicators to evaluate public relations efforts and increase brand visibility. It includes elements such as press releases, blog entries, social media updates, news releases etc.Present the topic in a bit more detail with this KPI Dashboard Highlighting Public Relations Integrated Marketing Communication MKT SS V. Use it as a tool for discussion and navigation on Blog Entries Posted, Releases Syndicated, Social Media Updates. This template is free to edit as deemed fit for your organization. Therefore download it now.
-
 Adopting Integrated Marketing Kpi Dashboard Highlighting Public Relations Metrics MKT SS V
The following slide depicts key performance indicators to evaluate public relations efforts and increase brand visibility. It includes elements such as press releases, blog entries, social media updates, news releases etc. Present the topic in a bit more detail with this Adopting Integrated Marketing Kpi Dashboard Highlighting Public Relations Metrics MKT SS V Use it as a tool for discussion and navigation on Highlighting Public, Relations Metrics This template is free to edit as deemed fit for your organization. Therefore download it now.
-
 Implementing Integrated KPI Dashboard Highlighting Public Relations Metrics MKT SS V
The following slide depicts key performance indicators to evaluate public relations efforts and increase brand visibility. It includes elements such as press releases, blog entries, social media updates, news releases etc. Present the topic in a bit more detail with this Implementing Integrated KPI Dashboard Highlighting Public Relations Metrics MKT SS V. Use it as a tool for discussion and navigation on Releases Syndicated, Social Media Updates, Blog Entries Posted. This template is free to edit as deemed fit for your organization. Therefore download it now.
-
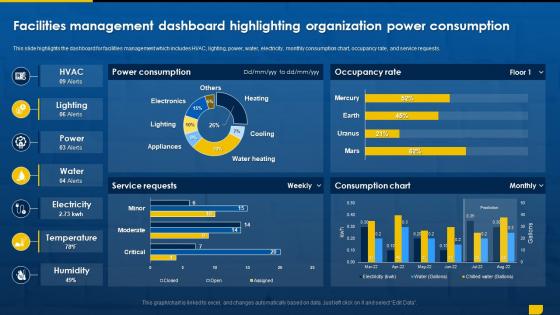 K94 Facilities Management Dashboard Highlighting Organization Power Facility Management
This slide highlights the dashboard for facilities management which includes HVAC, lighting, power, water, electricity, monthly consumption chart, occupancy rate, and service requests. Deliver an outstanding presentation on the topic using this Facilities Management Dashboard Highlighting Organization Power Facility Management. Dispense information and present a thorough explanation of Facilities Management, Dashboard Highlighting, Organization Power Consumption using the slides given. This template can be altered and personalized to fit your needs. It is also available for immediate download. So grab it now.
-
 Highlight Potential Bottlenecks Using Incident Tracking Dashboard
This slide illustrates incident tracking dashboard for monitoring, analyzing and managing issues effectively by informed decision making. It includes metrics such as initiative, element, outstanding, median resolution time, new vs resolved issues, tickets by status, etc. Introducing our Highlight Potential Bottlenecks Using Incident Tracking Dashboard set of slides. The topics discussed in these slides are New Vs Resolved Issues, Median Resolution Time, Completed Tickets. This is an immediately available PowerPoint presentation that can be conveniently customized. Download it and convince your audience.
-
 Comprehensive Integrated Marketing Kpi Dashboard Highlighting Public Relations Metrics MKT SS V
The following slide depicts key performance indicators to evaluate public relations efforts and increase brand visibility. It includes elements such as press releases, blog entries, social media updates, news releases etc. Present the topic in a bit more detail with this Comprehensive Integrated Marketing Kpi Dashboard Highlighting Public Relations Metrics MKT SS V Use it as a tool for discussion and navigation on Press Releases Syndicated, Blog Entries Posted, Total News Releases This template is free to edit as deemed fit for your organization. Therefore download it now.
-
 KPI Dashboard Highlighting Leveraging Integrated Marketing Communication Tools MKT SS V
The following slide depicts key performance indicators to evaluate public relations efforts and increase brand visibility. It includes elements such as press releases, blog entries, social media updates, news releases etc. Deliver an outstanding presentation on the topic using this . Dispense information and present a thorough explanation of Blog Entries Posted, Press Releases Syndicated, Total News Releases using the slides given. This template can be altered and personalized to fit your needs. It is also available for immediate download. So grab it now.
-
 Kpi Dashboard Highlighting Impact Of Cultural Change Management For Growth And Development CM SS
This slide represents dashboard to measure impact of cultural changes on employee engagement rates. It includes details related to KPIs such as average engagement scores of teams such as finance, marketing etc. Deliver an outstanding presentation on the topic using this Kpi Dashboard Highlighting Impact Of Cultural Change Management For Growth And Development CM SS. Dispense information and present a thorough explanation of Management, Engagement, Dashboard using the slides given. This template can be altered and personalized to fit your needs. It is also available for immediate download. So grab it now.
-
 RFM Analysis Dashboard Highlighting Business Orders
This slide depicts a dashboard showcasing business orders to identify and prioritize business orders based on recency, frequency, and monetary value. Presenting our well structured RFM Analysis Dashboard Highlighting Business Orders. The topics discussed in this slide are RFM Analysis Dashboard, Highlighting Business Orders, Frequency, Monetary Value. This is an instantly available PowerPoint presentation that can be edited conveniently. Download it right away and captivate your audience.
-
 SaaS KPI Dashboard Highlighting Product Usage
This slide highlights dashboard with SaaS KPIs showing product utilization. The purpose of this template is to empower teams for monitoring and improving features based on user engagement and utility. It includes elements such as actions, new users, net promoter score, etc. Introducing our SaaS KPI Dashboard Highlighting Product Usage set of slides. The topics discussed in these slides are New Document Uploads, Net Promoter Score, Product Usage. This is an immediately available PowerPoint presentation that can be conveniently customized. Download it and convince your audience.
-
 Dashboard Highlighting Customer Satisfaction Navigating The Future Of Insurance Data Analytics SS
This slide provides a dashboard aimed at analysing customer satisfaction rate to improve acquisition and retention rate. It covers metrics such as customer satisfaction by month, rate and premium. Deliver an outstanding presentation on the topic using this Dashboard Highlighting Customer Satisfaction Navigating The Future Of Insurance Data Analytics SS. Dispense information and present a thorough explanation of Customer Satisfaction, Premium, Customer Satisfaction Predict using the slides given. This template can be altered and personalized to fit your needs. It is also available for immediate download. So grab it now.
-
 Dashboard Highlighting Inventory Aging Report
This slide shows various metrics that can be used by organizations to track their inventory levels and aging. It includes key performance indicators such as inventory ageing by categories, ageing vs turnover days and ageing percentage value. Introducing our Dashboard Highlighting Inventory Aging Report set of slides. The topics discussed in these slides are Inventory Value, Turnover Days, Aging Report This is an immediately available PowerPoint presentation that can be conveniently customized. Download it and convince your audience.
-
 Best Staff Retention Strategies Kpi Metrics Dashboard Highlighting Employee Retention Rate
The purpose of this slide is to delineate different key performance indicators KPI which will assist HR professionals to measure the success of staff retention tactics. The KPIs are employee turnover rate, employee satisfaction rate, employee productivity rate, customer experience rate and average time per recruitment Present the topic in a bit more detail with this Best Staff Retention Strategies Kpi Metrics Dashboard Highlighting Employee Retention Rate Use it as a tool for discussion and navigation on Recognition And Appreciation, Work Balance, Training And Development This template is free to edit as deemed fit for your organization. Therefore download it now.
-
 Icon Highlighting Data Analytics Dashboard For Gaining Companies Insights
Presenting our set of slides with Icon Highlighting Data Analytics Dashboard For Gaining Companies Insights. This exhibits information on three stages of the process. This is an easy to edit and innovatively designed PowerPoint template. So download immediately and highlight information on Icon Highlighting, Data Analytics, Gaining Companies Insights.
-
 Icon Highlighting SaaS Dashboard For Data Analytics
Introducing our premium set of slides with Icon Highlighting SaaS Dashboard For Data Analytics. Ellicudate the three stages and present information using this PPT slide. This is a completely adaptable PowerPoint template design that can be used to interpret topics like Highlighting SaaS Dashboard, Data Analytics. So download instantly and tailor it with your information.
-
 Icon Highlighting SaaS Dashboard For Monitoring Revenue Growth
Presenting our set of slides with Icon Highlighting SaaS Dashboard For Monitoring Revenue Growth. This exhibits information on three stages of the process. This is an easy to edit and innovatively designed PowerPoint template. So download immediately and highlight information on Highlighting SaaS Dashboard, Monitoring Revenue Growth.
-
 Saas Disaster Recovery Dashboard Highlighting Data Protection
This slide showcases the software as a service disaster recovery dashboard illustrating data protection which helps an organization to provide cost effective techniques and security. It include details such as saas disaster recovery test status, business policies, application groups, etc. Introducing our Saas Disaster Recovery Dashboard Highlighting Data Protection set of slides. The topics discussed in these slides are Protection Status, Success, Saas Disaster Recovery, Test Status. This is an immediately available PowerPoint presentation that can be conveniently customized. Download it and convince your audience.
-
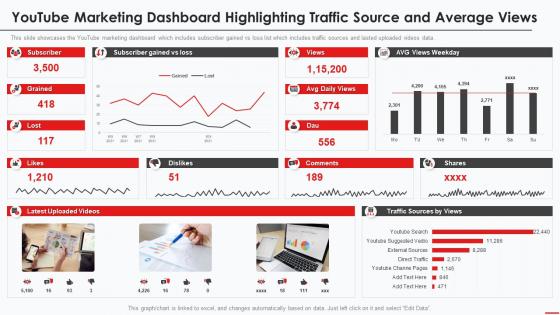 Marketing Guide To Promote Products Channel Youtube Marketing Dashboard Highlighting
This slide showcases the YouTube marketing dashboard which includes subscriber gained vs loss list which includes traffic sources and lasted uploaded videos data. Present the topic in a bit more detail with this Marketing Guide To Promote Products Channel Youtube Marketing Dashboard Highlighting. Use it as a tool for discussion and navigation on Marketing Dashboard, Highlighting, Source. This template is free to edit as deemed fit for your organization. Therefore download it now.
-
 Seo Dashboard Snapshot Highlighting Audit Findings
This slide outlines the SEO reporting dashboard snapshot showing the audit findings. This dashboard provides information about on page SEO, backlink audit, most toxic backlinks, site visibility, top keywords, site health, errors, total warnings etc. Introducing our Seo Dashboard Highlighting Audit Findings set of slides. The topics discussed in these slides are Position Tracking, Backlink Audit, One Page SEO. This is an immediately available PowerPoint presentation that can be conveniently customized. Download it and convince your audience.
-
 Performance Kpi Dashboard Highlighting Marketing Campaign Results
The purpose of this slide is to highlight results of marketing campaign through KPI dashboard. It provides information about total revenue generated, marketing expenditure, profit, cost per acquisition by different channels, return on investment etc. Presenting our well-structured Performance Kpi Dashboard Highlighting Marketing Campaign Results. The topics discussed in this slide are Performance, Dashboard, Highlighting, Marketing. This is an instantly available PowerPoint presentation that can be edited conveniently. Download it right away and captivate your audience.
-
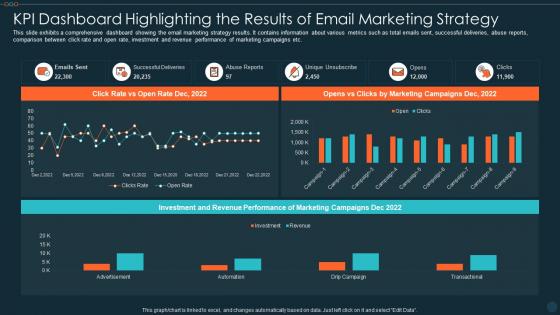 Kpi Dashboard Highlighting The Results Of Email Marketing Strategy
This slide exhibits a comprehensive dashboard showing the email marketing strategy results. It contains information about various metrics such as total emails sent, successful deliveries, abuse reports, comparison between click rate and open rate, investment and revenue performance of marketing campaigns etc. Presenting our well structured KPI Dashboard Highlighting The Results Of Email Marketing Strategy. The topics discussed in this slide are Investment, Revenue Performance, Marketing Campaigns. This is an instantly available PowerPoint presentation that can be edited conveniently. Download it right away and captivate your audience
-
 Finance KPI Dashboard Highlighting Current And Quick Ratio
Introducing our Finance KPI Dashboard Highlighting Current And Quick Ratio set of slides. The topics discussed in these slides are Income And Expenses, Expenses Budget, Income Budget. This is an immediately available PowerPoint presentation that can be conveniently customized. Download it and convince your audience.
-
 Kpi dashboard highlighting off page seo performance
Introducing our KPI Dashboard Highlighting Off Page SEO Performance set of slides. The topics discussed in these slides are Kpi Dashboard Highlighting Off Page Seo Performance. This is an immediately available PowerPoint presentation that can be conveniently customized. Download it and convince your audience.
-
 KPI Dashboard Highlighting Results Of SEO Campaign
The following slide showcases marketing KPI dashboard which shows the performance measuring metrics of SEO campaign. The metrics covered in the slide are most viewed pages from SEO, most search engines used, traffic type, top known keywords etc. Presenting our well structured KPI Dashboard Highlighting Results Of SEO Campaign. The topics discussed in this slide are Total Visits From SEO, Main Search Engines Used, Traffic Type, Most Viewed Pages From SEO. This is an instantly available PowerPoint presentation that can be edited conveniently. Download it right away and captivate your audience.
-
 Dashboard Highlighting Stakeholders Engagement Survey Results
Introducing our Dashboard Highlighting Stakeholders Engagement Survey Results set of slides. The topics discussed in these slides are Dashboard Highlighting Stakeholders Engagement Survey Results. This is an immediately available PowerPoint presentation that can be conveniently customized. Download it and convince your audience.
-
 SaaS Metrics Dashboard Highlighting Average Growth Revenue
Introducing our SaaS Metrics Dashboard Highlighting Average Growth Revenue set of slides. The topics discussed in these slides are Revenue, Growth Total Revenue, Type Of Revenue. This is an immediately available PowerPoint presentation that can be conveniently customized. Download it and convince your audience.
-
 KPI Compare Dashboard Highlighting Cases With Resolutions
Introducing our KPI Compare Dashboard Highlighting Cases With Resolutions set of slides. The topics discussed in these slides are Case Priority, Case Channel, Case Tracking. This is an immediately available PowerPoint presentation that can be conveniently customized. Download it and convince your audience.
-
 KPI Compare Dashboard Highlighting Conversion Rate With Cost Per Mile
Presenting our well structured KPI Compare Dashboard Highlighting Conversion Rate With Cost Per Mile. The topics discussed in this slide are KPI Compare Dashboard Highlighting Conversion Rate With Cost Per Mile. This is an instantly available PowerPoint presentation that can be edited conveniently. Download it right away and captivate your audience.
-
 KPI Compare Dashboard Highlighting Patients By Division
Introducing our KPI Compare Dashboard Highlighting Patients By Division set of slides. The topics discussed in these slides are Outpatients Vs Inpatients, Waiting Time By Division, Treatment Costs. This is an immediately available PowerPoint presentation that can be conveniently customized. Download it and convince your audience.
-
 Suppliers KPI Compare Dashboard Highlighting Spending With Savings
Presenting our well structured Suppliers KPI Compare Dashboard Highlighting Spending With Savings. The topics discussed in this slide are Procurement Cycle, Supplier Classification, Procurement Cycle Time. This is an instantly available PowerPoint presentation that can be edited conveniently. Download it right away and captivate your audience.
-
 Organizational Catastrophe Dashboard Highlighting At Risk Employees During COVID 19
This slide illustrates business catastrophe dashboard showing employees at risk during coronavirus. It provides information such as covid cases, age distribution, building, provinces, map, etc. Introducing our Organizational Catastrophe Dashboard Highlighting At Risk Employees During COVID 19 set of slides. The topics discussed in these slides are Organizational Catastrophe Dashboard Highlighting At Risk Employees During Covid 19. This is an immediately available PowerPoint presentation that can be conveniently customized. Download it and convince your audience.
-
 KPI Dashboard Highlighting Customer Referral Program Results
The following slide showcases a comprehensive dashboard which can be used to track customer referral program results. It provides information about total participants enrolled, invites, clicks, converts, tweets, facebook shares etc. Presenting our well structured KPI Dashboard Highlighting Customer Referral Program Results. The topics discussed in this slide are Participants Enrolled, Campaign Investments Statistics, Campaign Overview. This is an instantly available PowerPoint presentation that can be edited conveniently. Download it right away and captivate your audience.
-
 Digital Audit Dashboard Snapshot Highlighting Digital Audit To Evaluate Brand Ppt Rules
This slide highlights the website visitors by different countries which also includes the users and session data from last 10 days, it also includes user demographic. Device and new vs returning user. Present the topic in a bit more detail with this Digital Audit Dashboard Snapshot Highlighting Digital Audit To Evaluate Brand Ppt Rules. Use it as a tool for discussion and navigation on Digital Audit Dashboard Highlighting Website Visitors With Device And Social Networks. This template is free to edit as deemed fit for your organization. Therefore download it now.
-
 Banking Operation Strategy Dashboard Highlighting Strategy To Transform Banking Operations Model
This slide highlights the banking operation strategy which includes accounts opened and closed, total deposit vs branch goal, accounts by type, expense to budget and referrals by product. Deliver an outstanding presentation on the topic using this Banking Operation Strategy Dashboard Highlighting Strategy To Transform Banking Operations Model. Dispense information and present a thorough explanation of Operation, Strategy, Dashboard using the slides given. This template can be altered and personalized to fit your needs. It is also available for immediate download. So grab it now.
-
 Strategy To Transform Banking Operations Model Banking Operation Strategy Dashboard Highlighting
This slide highlights the banking operation strategy dashboard which showcases current account and saving account growth rate, savings account deposits, current account deposits and retail term deposits. Present the topic in a bit more detail with this Strategy To Transform Banking Operations Model Banking Operation Strategy Dashboard Highlighting. Use it as a tool for discussion and navigation on Operation, Strategy, Dashboard. This template is free to edit as deemed fit for your organization. Therefore download it now.
-
 HR Induction Dashboard Highlighting Induction Program For New Employees
This slide highlights the HR induction dashboard which includes average salary, headcount, turnover rate, employees hired and employees left rate, average age with employment contract and status. Present the topic in a bit more detail with this HR Induction Dashboard Highlighting Induction Program For New Employees. Use it as a tool for discussion and navigation on Average Salary, Turnover Rate, Absenteeism Rate. This template is free to edit as deemed fit for your organization. Therefore download it now.
-
 Digital Audit Dashboard Highlighting Website Visitors With Device And Social Networks
This slide highlights the website visitors by different countries which also includes the users and session data from last 10 days, it also includes user demographic. Device and new vs returning user. Present the topic in a bit more detail with this Digital Audit Dashboard Highlighting Website Visitors With Device And Social Networks. Use it as a tool for discussion and navigation on Website Visitors Country, User Demographics, Social Networks. This template is free to edit as deemed fit for your organization. Therefore download it now.
-
 Website Promotion Dashboard Highlighting Advertisement Develop Promotion Plan To Boost Sales Growth
This slide represents website promotion dashboard. It covers total visits, average session duration, bounce rate, page views etc. Present the topic in a bit more detail with this Website Promotion Dashboard Highlighting Advertisement Develop Promotion Plan To Boost Sales Growth. Use it as a tool for discussion and navigation on Advertisement, Performance, Dashboard. This template is free to edit as deemed fit for your organization. Therefore download it now
-
 KPI Dashboard Highlighting Results Of HR Management Training
Mentioned slide outlines a dashboard through which the organization can track and evaluate the results of HR management training. It provides information about metrics such as training budget, total cost, cost per participant, total hours of training, etc. Presenting our well structured KPI Dashboard Highlighting Results Of HR Management Training. The topics discussed in this slide are Training Budget, Total Cost, Cost Per Participants. This is an instantly available PowerPoint presentation that can be edited conveniently. Download it right away and captivate your audience.
-
 Performance KPI Dashboard Highlighting Retail Objectives
The purpose of this slide is to showcase an effective KPI dashboard which can assist store manager to evaluate retail business objectives. The KPIs are sales per square foot, average transaction value, sales per employee, and inventory shrinkage. Introducing our Performance KPI Dashboard Highlighting Retail Objectives set of slides. The topics discussed in these slides are Performance, KPI Dashboard, Retail Objectives. This is an immediately available PowerPoint presentation that can be conveniently customized. Download it and convince your audience.
-
 Website Promotion Dashboard Highlighting Implementing Promotion Campaign For Brand Engagement
This slide represents website promotion dashboard. It covers total visits, average session duration, bounce rate, page views etc. Present the topic in a bit more detail with this Website Promotion Dashboard Highlighting Implementing Promotion Campaign For Brand Engagement. Use it as a tool for discussion and navigation on Highlighting, Advertisement, Performance. This template is free to edit as deemed fit for your organization. Therefore download it now.
-
 Website Promotion Dashboard Highlighting Performance Promotion Strategy Enhance Awareness
This slide represents website promotion dashboard. It covers total visits, average session duration, bounce rate, page views etc. Present the topic in a bit more detail with this Website Promotion Dashboard Highlighting Performance Promotion Strategy Enhance Awareness. Use it as a tool for discussion and navigation on Advertisement, Performance, Dashboard. This template is free to edit as deemed fit for your organization. Therefore download it now.
-
 Procedure To Perform Digital Marketing Audit Digital Audit Dashboard Highlighting Website Visitors
This slide highlights the website visitors by different countries which also includes the users and session data from last 10 days, it also includes user demographic. Device and new vs returning user. Present the topic in a bit more detail with this Procedure To Perform Digital Marketing Audit Digital Audit Dashboard Highlighting Website Visitors. Use it as a tool for discussion and navigation on Dashboard, Demographic, Social Networks. This template is free to edit as deemed fit for your organization. Therefore download it now.
-
 Complete Guide To Conduct Digital Audit Dashboard Highlighting Website Visitors With Device
This slide highlights the website visitors by different countries which also includes the users and session data from last 10 days, it also includes user demographic. Device and new vs returning user. Deliver an outstanding presentation on the topic using this Complete Guide To Conduct Digital Audit Dashboard Highlighting Website Visitors With Device. Dispense information and present a thorough explanation of Demographics, Social Networks, Dashboard Highlighting using the slides given. This template can be altered and personalized to fit your needs. It is also available for immediate download. So grab it now.
-
 Dashboard Highlighting Trends Of Artificial Intelligence In Global Market
Presenting our well structured Dashboard Highlighting Trends Of Artificial Intelligence In Global Market. The topics discussed in this slide are Global Market Value, Market Share, Supply Chain. This is an instantly available PowerPoint presentation that can be edited conveniently. Download it right away and captivate your audience.
-
 Dashboard Highlighting Internal Recruitment Sources And Costs
This slide illustrates dashboard for recruiting employees internally. It provides information about sourcing status, yield ratio, hiring pipeline, positions filled, recruitment costs, hire cost per team, etc. Introducing our Dashboard Highlighting Internal Recruitment Sources And Costs set of slides. The topics discussed in these slides are Recruitment, Sources, Dashboard. This is an immediately available PowerPoint presentation that can be conveniently customized. Download it and convince your audience.
-
 KPI Dashboard Highlighting Automation Results In Supply Chain Strengthening Process Improvement
The following slide outlines a comprehensive dashboard depicting the business process automation BPA results in the supply chain. Information covered in the slide is related to average order processing days, average shipping days, etc. Present the topic in a bit more detail with this KPI Dashboard Highlighting Automation Results In Supply Chain Strengthening Process Improvement. Use it as a tool for discussion and navigation on Shipment Status, Average Order Processing Days, Average Order Fulfillment Days, Late Deliveries By Warehouse, Late Deliveries Product. This template is free to edit as deemed fit for your organization. Therefore download it now.
-
 Youtube Marketing Dashboard Highlighting Traffic Source And Average Views Youtube Marketing Strategy
This slide showcases the YouTube marketing dashboard which includes subscriber gained vs loss list which includes traffic sources and lasted uploaded videos data. Present the topic in a bit more detail with this Youtube Marketing Dashboard Highlighting Traffic Source And Average Views Youtube Marketing Strategy. Use it as a tool for discussion and navigation on Youtube Marketing Dashboard, Highlighting Traffic Source, Average Views. This template is free to edit as deemed fit for your organization. Therefore download it now.
-
 KPI Dashboard Highlighting Automation Results BPA Tools For Process Improvement And Cost Reduction
The following slide outlines a comprehensive dashboard depicting the business process automation BPA results in the supply chain. Information covered in the slide is related to average order processing days, average shipping days, etc. Present the topic in a bit more detail with this KPI Dashboard Highlighting Automation Results BPA Tools For Process Improvement And Cost Reduction. Use it as a tool for discussion and navigation on Shipment Status, Late Deliveries, Warehouse, Product. This template is free to edit as deemed fit for your organization. Therefore download it now.
-
 Dashboard Highlighting CRM Ticketing Tool Operations Service Desk Management To Enhance
This slide illustrates dashboard showcasing customer relationship management ticketing tool operations. It provides information about satisfaction, new tickets, chats, calls, invoicing, tech support, sales, engineers, replies, etc. Present the topic in a bit more detail with this Dashboard Highlighting CRM Ticketing Tool Operations Service Desk Management To Enhance. Use it as a tool for discussion and navigation on Dashboard Highlighting, Ticketing Tool Operations. This template is free to edit as deemed fit for your organization. Therefore download it now.
-
 F596 Video Content Marketing Plan For Youtube Advertising Youtube Marketing Dashboard Highlighting
This slide showcases the YouTube marketing dashboard which includes subscriber gained vs loss list which includes traffic sources and lasted uploaded videos data. Present the topic in a bit more detail with this F596 Video Content Marketing Plan For Youtube Advertising Youtube Marketing Dashboard Highlighting. Use it as a tool for discussion and navigation on Marketing, Dashboard, Source. This template is free to edit as deemed fit for your organization. Therefore download it now.
-
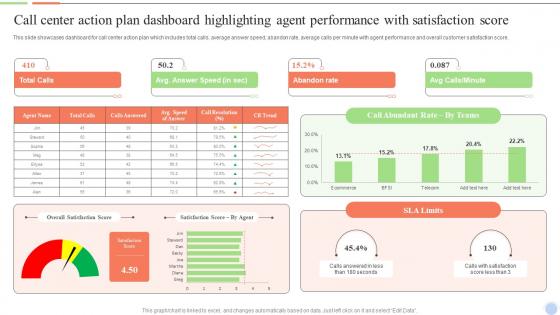 Q621 Smart Action Plan For Call Center Call Center Action Plan Dashboard Highlighting Agent Performance
This slide showcases dashboard for call center action plan which includes total calls, average answer speed, abandon rate, average calls per minute with agent performance and overall customer satisfaction score. Deliver an outstanding presentation on the topic using this Q621 Smart Action Plan For Call Center Call Center Action Plan Dashboard Highlighting Agent Performance. Dispense information and present a thorough explanation of Total Calls, Abandon Rate, SLA Limits using the slides given. This template can be altered and personalized to fit your needs. It is also available for immediate download. So grab it now.
-
 Smart Action Plan For Call Center Action Plan Dashboard Highlighting Average Answer Time
This slide showcases call center action plan dashboard which highlights first call resolution, unresolved calls, customers call report, response time by weekday and average answer time. Deliver an outstanding presentation on the topic using this Smart Action Plan For Call Center Action Plan Dashboard Highlighting Average Answer Time. Dispense information and present a thorough explanation of Customers Call Report, Average Answer Time, Response Time using the slides given. This template can be altered and personalized to fit your needs. It is also available for immediate download. So grab it now.
-
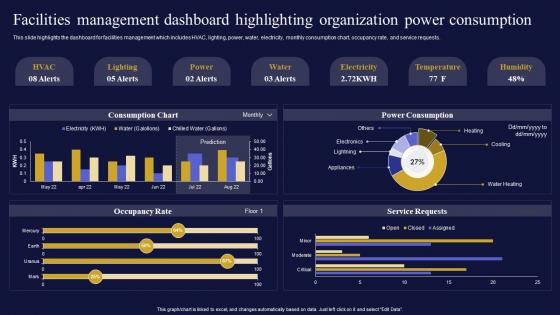 Q617 Facilities Management Dashboard Highlighting Facilities Management And Maintenance Company
This slide highlights the dashboard for facilities management which includes HVAC, lighting, power, water, electricity, monthly consumption chart, occupancy rate, and service requests. Deliver an outstanding presentation on the topic using this Q617 Facilities Management Dashboard Highlighting Facilities Management And Maintenance Company. Dispense information and present a thorough explanation of Consumption Chart, Power Consumption, Occupancy Rate using the slides given. This template can be altered and personalized to fit your needs. It is also available for immediate download. So grab it now.
-
 Supplier Planning Dashboard Highlighting Compliance Stats With Procurement Time Ecommerce Supply Chain
This slide highlights the supplier planning dashboard which includes the supplier category with average procurement cycle with gold, silver and bronze supplier partner. Present the topic in a bit more detail with this Supplier Planning Dashboard Highlighting Compliance Stats With Procurement Time Ecommerce Supply Chain. Use it as a tool for discussion and navigation on Average Procurement, Supplier Classification, Dashboard Highlighting. This template is free to edit as deemed fit for your organization. Therefore download it now.


