Powerpoint Templates and Google slides for Dashboard Depicting
Save Your Time and attract your audience with our fully editable PPT Templates and Slides.
-
 Attracting Customers Marketing Strategies Engagement Product Depicting Dashboard
Deliver a lucid presentation by utilizing this Attracting Customers Marketing Strategies Engagement Product Depicting Dashboard. Use it to present an overview of the topic with the right visuals, themes, shapes, and graphics. This is an expertly designed complete deck that reinforces positive thoughts and actions. Use it to provide visual cues to your audience and help them make informed decisions. A wide variety of discussion topics can be covered with this creative bundle such as Attracting Customers, Marketing, Strategies, Engagement, Product. All the twelve slides are available for immediate download and use. They can be edited and modified to add a personal touch to the presentation. This helps in creating a unique presentation every time. Not only that, with a host of editable features, this presentation can be used by any industry or business vertical depending on their needs and requirements. The compatibility with Google Slides is another feature to look out for in the PPT slideshow.
-
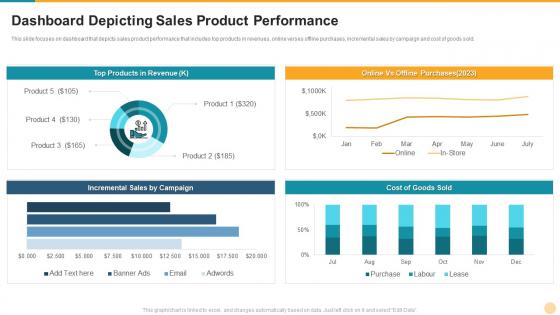 Defining product leadership strategies dashboard depicting sales product performance
This slide focuses on dashboard that depicts sales product performance that includes top products in revenues, online verses offline purchases, incremental sales by campaign and cost of goods sold. Present the topic in a bit more detail with this Defining Product Leadership Strategies Dashboard Depicting Sales Product Performance. Use it as a tool for discussion and navigation on Product, Performance, Dashboard. This template is free to edit as deemed fit for your organization. Therefore download it now.
-
 Dashboard depicting company net worth with calculations
Presenting our well structured Dashboard Depicting Company Net Worth With Calculations. The topics discussed in this slide are Investments, Retirement, Liabilities. This is an instantly available PowerPoint presentation that can be edited conveniently. Download it right away and captivate your audience.
-
 KPI Dashboard For Medical Staff Heterogeneity Depiction
This slide depicts the heterogeneity of the medical staff within a hospital. The purpose of this slide is to understand the distribution of workforce based on gender, race, and age groups in order for appropriate policies to be formed and implemented. Introducing our KPI Dashboard For Medical Staff Heterogeneity Depiction set of slides. The topics discussed in these slides are Dashboard For Medical, Staff Heterogeneity Depiction. This is an immediately available PowerPoint presentation that can be conveniently customized. Download it and convince your audience.
-
 Dashboard Depicting Production In Global Food Market Farm Services Marketing Strategy SS V
This slide provides an overview of the dashboard that exhibits the situation of the global food market. It includes production, import, exports information for wheat, maize, rice and soybean. Deliver an outstanding presentation on the topic using this Dashboard Depicting Production In Global Food Market Farm Services Marketing Strategy SS V. Dispense information and present a thorough explanation of Dashboard Depicting Production, Global Food Market using the slides given. This template can be altered and personalized to fit your needs. It is also available for immediate download. So grab it now.
-
 Farm Management Dashboard Depicting Production Farm Services Marketing Strategy SS V
This slide showcases the dashboard depicting data related to the production of fruits. The dashboard includes area, last production, air temperature, water content, pH value and financial statistics. Present the topic in a bit more detail with this Farm Management Dashboard Depicting Production Farm Services Marketing Strategy SS V. Use it as a tool for discussion and navigation on Financial Statistics, Production Details. This template is free to edit as deemed fit for your organization. Therefore download it now.
-
 Farm Produce Marketing Approach Dashboard Depicting Production In Global Food Market Strategy SS V
This slide provides an overview of the dashboard that exhibits the situation of the global food market. It includes production, import, exports information for wheat, maize, rice and soybean. Present the topic in a bit more detail with this Farm Produce Marketing Approach Dashboard Depicting Production In Global Food Market Strategy SS V. Use it as a tool for discussion and navigation on Dashboard Depicting Production, Global Food Market, Closing Stocks And Ratios. This template is free to edit as deemed fit for your organization. Therefore download it now.
-
 Farm Produce Marketing Approach Farm Management Dashboard Depicting Production Strategy SS V
This slide showcases the dashboard depicting data related to the production of fruits. The dashboard includes area, last production, air temperature, water content, pH value and financial statistics. Deliver an outstanding presentation on the topic using this Farm Produce Marketing Approach Farm Management Dashboard Depicting Production Strategy SS V. Dispense information and present a thorough explanation of Farm Management, Dashboard Depicting Production, Air Temperature, Financial Statistics using the slides given. This template can be altered and personalized to fit your needs. It is also available for immediate download. So grab it now.
-
 Dashboard To Depict Current Cash Flow Position Mastering Financial Planning In Modern Business Fin SS
This slide provides a dedicated dashboard for monitoring the organizations cash flow position. It offers a real-time view of cash flow status. Key performance metrics covered in the dashboard relate to cash in hand profit or loss cash flow etc. Deliver an outstanding presentation on the topic using this Dashboard To Depict Current Cash Flow Position Mastering Financial Planning In Modern Business Fin SS. Dispense information and present a thorough explanation of Accounts Payable Accounts Receivable Cash Flow using the slides given. This template can be altered and personalized to fit your needs. It is also available for immediate download. So grab it now.
-
 Dashboard Depicting Project Associated Risks And Issues Mastering Project Management PM SS
This slide focuses on project management dashboard which covers the project name, status date overall status, monthly schedule such as analysis, development, quality assurance, user acceptance, pre production and support with actual and planned budget, etc.Present the topic in a bit more detail with this Dashboard Depicting Project Associated Risks And Issues Mastering Project Management PM SS. Use it as a tool for discussion and navigation on Dashboard Depicting, Project Associated, Risks Issues This template is free to edit as deemed fit for your organization. Therefore download it now.
-
 Dashboard Depicting Gamification Impact On Marketing Campaign
The slide illustrates dashboard indicating impact of gamification on marketing campaign performance. It include elements such as unique visitors, new leads, double opt-in, conversion etc. Introducing our Dashboard Depicting Gamification Impact On Marketing Campaign set of slides. The topics discussed in these slides are Dashboard, Gamification, Marketing Campaign. This is an immediately available PowerPoint presentation that can be conveniently customized. Download it and convince your audience.
-
 Sales Opportunity Dashboard Depicting Regional Business Analysis
The slide showcases sales opportunity dashboard highlighting international buisness analysis. It include quarter to date bookings, average purchase value and opportunity breakdown. Introducing our Sales Opportunity Dashboard Depicting Regional Business Analysis set of slides. The topics discussed in these slides are Opportunities, Average Purchase Value, Opportunity Breakdown QTD. This is an immediately available PowerPoint presentation that can be conveniently customized. Download it and convince your audience.
-
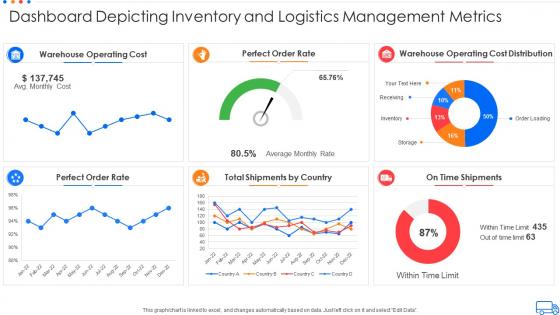 Dashboard depicting inventory and logistics management metrics
Introducing our Dashboard Depicting Inventory And Logistics Management Metrics set of slides. The topics discussed in these slides are Dashboard Depicting Inventory And Logistics Management Metrics. This is an immediately available PowerPoint presentation that can be conveniently customized. Download it and convince your audience.
-
 Dashboard depicting financial snapshot of real estate company
Introducing our Dashboard Depicting Financial Snapshot Of Real Estate Company set of slides. The topics discussed in these slides are Sales Funnel, Sales By Agent. This is an immediately available PowerPoint presentation that can be conveniently customized. Download it and convince your audience.
-
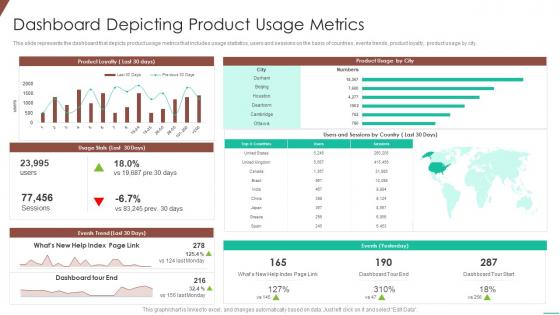 Dashboard depicting product usage metrics optimizing product development system
This slide represents the dashboard that depicts product usage metrics that includes usage statistics, users and sessions on the basis of countries, events trends, product loyalty, product usage by city. Deliver an outstanding presentation on the topic using this Dashboard Depicting Product Usage Metrics Optimizing Product Development System. Dispense information and present a thorough explanation of Dashboard Depicting Product Usage Metrics using the slides given. This template can be altered and personalized to fit your needs. It is also available for immediate download. So grab it now.
-
 Role of digital twin and iot dashboard depicting supply chain metrics
This slide depicts the dashboard that shows supply chain metrics that covers net sales, supply chain costs, average cash to cash cycle, carrying costs of inventory, etc. Present the topic in a bit more detail with this Role Of Digital Twin And Iot Dashboard Depicting Supply Chain Metrics. Use it as a tool for discussion and navigation on Dashboard Depicting Supply Chain Metrics. This template is free to edit as deemed fit for your organization. Therefore download it now.
-
 Dashboard Depicting Hr Organization Automating Key Tasks Of Human Resource Manager
This slide shows the dashboard that depicts total number of employees including permanent, fixed contract and temporary with business unit distribution. Present the topic in a bit more detail with this Dashboard Depicting Hr Organization Automating Key Tasks Of Human Resource Manager. Use it as a tool for discussion and navigation on Dashboard, Analytics, Organization. This template is free to edit as deemed fit for your organization. Therefore download it now.
-
 Information Technology Dashboard Depicting User Activity
This slide shows information technology dashboard depicting user activity which can be referred by IT managers to track leads and make decisions. It includes information about sessions, signups, position, size, industry, customers, quality leads, etc. Introducing our Information Technology Dashboard Depicting User Activity set of slides. The topics discussed in these slides are Customers, Monthly Recurring Revenue, Quality Leads. This is an immediately available PowerPoint presentation that can be conveniently customized. Download it and convince your audience.
-
 Dashboard Depicting Customer Engagement In Marketing Campaigns
This slide illustrates a dashboard showcasing digital customer management in the campaign. It covers emails sent, delivered, and opened by customers, website clicks, and bounce rate. Introducing our Dashboard Depicting Customer Engagement In Marketing Campaigns set of slides. The topics discussed in these slides are Program, Campaign, Email Message. This is an immediately available PowerPoint presentation that can be conveniently customized. Download it and convince your audience.
-
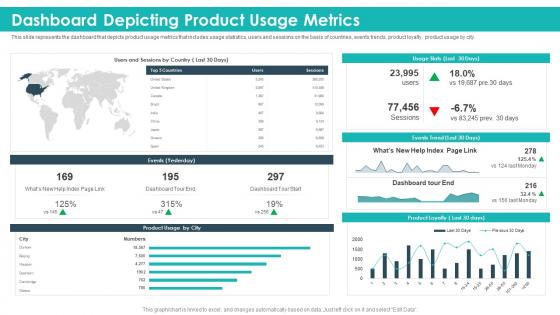 Dashboard depicting product usage metrics strategic product planning
This slide represents the dashboard that depicts product usage metrics that includes usage statistics, users and sessions on the basis of countries, events trends, product loyalty, product usage by city. Deliver an outstanding presentation on the topic using this Dashboard Depicting Product Usage Metrics Strategic Product Planning. Dispense information and present a thorough explanation of Dashboard Depicting Product Usage Metrics using the slides given. This template can be altered and personalized to fit your needs. It is also available for immediate download. So grab it now.
-
 Digital Dashboard Depicting Insurance Claims Analytics
This slide illustrates digital dashboard depicting insurance claim analytics which contains claim amount comparison, customer feedback, claim details, average cost per claim, settle claim, etc. Presenting our well structured Digital Dashboard Depicting Insurance Claims Analytics. The topics discussed in this slide are Customer Feedback, Claim Amount Comparison, Cost Per Claim. This is an instantly available PowerPoint presentation that can be edited conveniently. Download it right away and captivate your audience.
-
 Employee Dashboard Snapshot Depicting HR Data Automation
This slide shows the human resource management dashboard which shows the employee data automation details which includes employee headcount by company, gender and management level, nearing retirement in critical jobs, average age by company, etc. Introducing our Employee Dashboard Snapshot Depicting HR Data Automation set of slides. The topics discussed in these slides are Employee Headcount By Organization, Employee Pay By Generation, Employee Head Count By Gender, Employee Headcount By Management Level. This is an immediately available PowerPoint presentation that can be conveniently customized. Download it and convince your audience.
-
 Dashboard Depicting Project Management Plan With Tasks Assessment
In this slide we have showcased a complete project plan dashboard which includes tasks such as kick off meeting, hardware request, staffing, technical request, budget etc. Introducing our Dashboard Depicting Project Management Plan With Tasks Assessment set of slides. The topics discussed in these slides are Management, Assessment, Dashboard, Depicting. This is an immediately available PowerPoint presentation that can be conveniently customized. Download it and convince your audience.
-
 Strategic Planning For Industrial Marketing Dashboard Depicting Industrial Marketing Analysis
This slide focuses on the dashboard that depicts industrial marketing analysis which shows volume of activity, overall performance, revenues share, operational priorities, etc. Deliver an outstanding presentation on the topic using this Strategic Planning For Industrial Marketing Dashboard Depicting Industrial Marketing Analysis. Dispense information and present a thorough explanation of Industrial, Marketing, Analysis using the slides given. This template can be altered and personalized to fit your needs. It is also available for immediate download. So grab it now.
-
 Establishing Plan Successful Project Management Dashboard Depicting Project Associated
This slide focuses on project management dashboard which covers the project name, status date overall status, monthly schedule such as analysis, development, quality assurance, user acceptance, pre production and support with actual and planned budget, pending decisions and actions, etc. Deliver an outstanding presentation on the topic using this Establishing Plan Successful Project Management Dashboard Depicting Project Associated. Dispense information and present a thorough explanation of Associated, Dashboard, Management using the slides given. This template can be altered and personalized to fit your needs. It is also available for immediate download. So grab it now.
-
 Optimization Social Media Recruitment Process Dashboard Depicting Social Media
This slide depicts the dashboard showing metrics to measure social media recruitment status which covers sourcing status, bounce rate, filled positions, recruitment expenses, cost per hire, top referrers, etc. Present the topic in a bit more detail with this Optimization Social Media Recruitment Process Dashboard Depicting Social Media. Use it as a tool for discussion and navigation on Recruitment Metrics, Dashboard, Depicting. This template is free to edit as deemed fit for your organization. Therefore download it now.
-
 Ensuring Leadership Product Innovation Processes Dashboard Depicting Sales Product Performance
This slide focuses on dashboard that depicts sales product performance that includes top products in revenues, online verses offline purchases, incremental sales by campaign and cost of goods sold. Present the topic in a bit more detail with this Ensuring Leadership Product Innovation Processes Dashboard Depicting Sales Product Performance. Use it as a tool for discussion and navigation on Dashboard Depicting Sales Product Performance. This template is free to edit as deemed fit for your organization. Therefore download it now.
-
 Dashboard Depicting Macroeconomic Analysis With Population
This slide shows the dashboard that depicts the macroeconomic analysis which includes population, gross domestic product, GDP per capita, poverty rate, literacy rate verses internet usage of four different countries and FDI inflow , etc. Introducing our Dashboard Depicting Macroeconomic Analysis With Population set of slides. The topics discussed in these slides are Population Million, Gross Domestic Product, GDP Per Capita, Poverty Rate, Literacy Rate Vs Internet Usages, FDI Inflow In 2022. This is an immediately available PowerPoint presentation that can be conveniently customized. Download it and convince your audience.
-
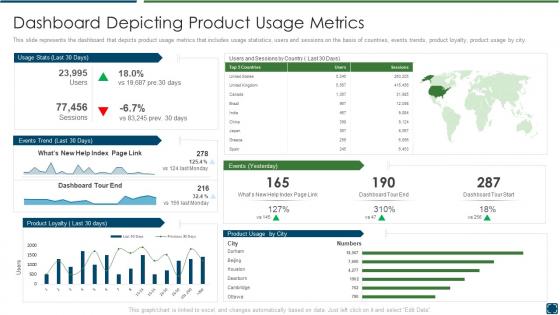 Best practices improve product development dashboard snapshot depicting usage
This slide represents the dashboard that depicts product usage metrics that includes usage statistics, users and sessions on the basis of countries, events trends, product loyalty, product usage by city. Present the topic in a bit more detail with this Best Practices Improve Product Development Dashboard Snapshot Depicting Usage. Use it as a tool for discussion and navigation on Events Trend, Product Loyalty, Product Usage City, Dashboard Tour End. This template is free to edit as deemed fit for your organization. Therefore download it now.
-
 Cost benefits iot digital twins implementation dashboard depicting supply chain metrics
This slide depicts the dashboard that shows supply chain metrics that covers net sales, supply chain costs, average cash-to-cash cycle, carrying costs of inventory, etc. Deliver an outstanding presentation on the topic using this Cost Benefits Iot Digital Twins Implementation Dashboard Depicting Supply Chain Metrics. Dispense information and present a thorough explanation of Dashboard Depicting Supply Chain Metrics using the slides given. This template can be altered and personalized to fit your needs. It is also available for immediate download. So grab it now.
-
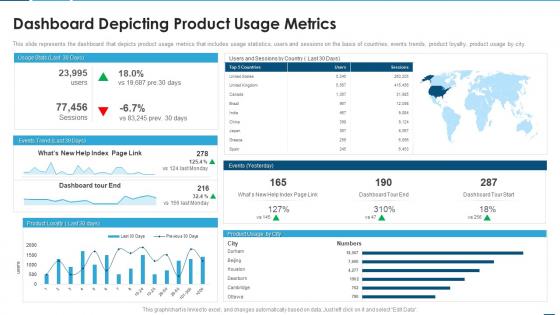 Creating product development strategy dashboard depicting product usage metrics
This slide represents the dashboard that depicts product usage metrics that includes usage statistics,users and sessions on the basis of countries,events trends,product loyalty,product usage by city. Deliver an outstanding presentation on the topic using this Creating Product Development Strategy Dashboard Depicting Product Usage Metrics. Dispense information and present a thorough explanation of Dashboard Depicting Product Usage Metrics using the slides given. This template can be altered and personalized to fit your needs. It is also available for immediate download. So grab it now.
-
 Delivering Efficiency By Innovating Product Dashboard Depicting Sales Product Performance
This slide focuses on dashboard that depicts sales product performance that includes top products in revenues, online verses offline purchases, incremental sales by campaign and cost of goods sold. Deliver an outstanding presentation on the topic using this Delivering Efficiency By Innovating Product Dashboard Depicting Sales Product Performance. Dispense information and present a thorough explanation of Dashboard, Product, Performance using the slides given. This template can be altered and personalized to fit your needs. It is also available for immediate download. So grab it now.
-
 Dashboard Depicting HR Analytics Of Organization Automation Of HR Workflow
This slide shows the dashboard that depicts total number of employees including permanent, fixed contract and temporary with business unit distribution. Deliver an outstanding presentation on the topic using this Dashboard Depicting HR Analytics Of Organization Automation Of HR Workflow. Dispense information and present a thorough explanation of Business Unit, Employees using the slides given. This template can be altered and personalized to fit your needs. It is also available for immediate download. So grab it now.
-
 Real Estate Leasing Dashboard Depicting Agent Performance
This slide shows real estate leasing dashboard depicting agent performance which can be beneficial for companies to manage the tasks of their brokers. It includes information about sum of active deals, total price of active deals, house net total, current year deal count, etc. Introducing our Real Estate Leasing Dashboard Depicting Agent Performance set of slides. The topics discussed in these slides are Price, Average. This is an immediately available PowerPoint presentation that can be conveniently customized. Download it and convince your audience.
-
 Real Estate Leasing Dashboard Depicting Sale And Rent Analysis
This slide shows real estate leasing dashboard depicting sale and rent analysis which can be referred by property managers to manage various listing. It includes information about monthly stats of rent and sales, total proceeds, monthly target, rental properties, etc. Presenting our well structured Real Estate Leasing Dashboard Depicting Sale And Rent Analysis. The topics discussed in this slide are Target, Customers. This is an instantly available PowerPoint presentation that can be edited conveniently. Download it right away and captivate your audience.
-
 Messaging Platforms Dashboard Depicting Web Campaign Performance
Presenting our well structured Messaging Platforms Dashboard Depicting Web Campaign Performance. The topics discussed in this slide are Messaging Platform User Statistics For Marketers. This is an instantly available PowerPoint presentation that can be edited conveniently. Download it right away and captivate your audience.
-
 Dashboard Depicting Portfolio Budget Tracking
This slide shows the dashboard that focuses on portfolio budget tracking which includes allocated budget, used budget percentage, estimated cost and average cost across portfolios with financials. Presenting our well structured Dashboard Depicting Portfolio Budget Tracking. The topics discussed in this slide are Financials, Allocated Budget Across Portfolios, Used Budget Across Portfolios, Used Budget Percentage, Estimated Cost Across Portfolios. This is an instantly available PowerPoint presentation that can be edited conveniently. Download it right away and captivate your audience.
-
 Dashboard Depicting Hospital KPI With Treatment Costs
This slide covers the hospital KPI dashboard which focuses on average length of stay, nurse patient ratio, admission and 30 day readmission rate with percentage of infection cases acquired by hospital. Introducing our Dashboard Depicting Hospital KPI With Treatment Costs set of slides. The topics discussed in these slides are Length Of Stay, Stays By Payer, Admission AND 30 Day Readmission Rate, Avg Nurse Patient Ratio. This is an immediately available PowerPoint presentation that can be conveniently customized. Download it and convince your audience.
-
 Hospital KPI Dashboard Depicting Total Patients
This slide focuses on hospital KPI dashboard which covers patient satisfaction, operational costs, available staff, average wait time and patients, treatment plan of doctors with divisions such as cardiology, dermatology, gynecology, etc. Presenting our well structured Hospital KPI Dashboard Depicting Total Patients. The topics discussed in this slide are Operational Cost, Total Patients, Available Staff Per Division, Average Wait Times By Division, Overall Patient Satisfaction, Doctors Treatment Plan, Confidence In Treatment. This is an instantly available PowerPoint presentation that can be edited conveniently. Download it right away and captivate your audience.
-
 Managing And Innovating Product Management Dashboard Depicting Sales Product Performance
This slide focuses on dashboard that depicts sales product performance that includes top products in revenues, online verses offline purchases, incremental sales by campaign and cost of goods sold. Present the topic in a bit more detail with this Managing And Innovating Product Management Dashboard Depicting Sales Product Performance. Use it as a tool for discussion and navigation on Dashboard, Product, Performance. This template is free to edit as deemed fit for your organization. Therefore download it now.
-
 SaaS Metrics Dashboard Depicting Content Origin And Session Frequency
Introducing our SaaS Metrics Dashboard Depicting Content Origin And Session Frequency set of slides. The topics discussed in these slides are Session Duration, Content Origin, Session Frequency. This is an immediately available PowerPoint presentation that can be conveniently customized. Download it and convince your audience.
-
 SaaS Metrics Dashboard Depicting Customer Acquisition Cost
Presenting our well structured SaaS Metrics Dashboard Depicting Customer Acquisition Cost. The topics discussed in this slide are New Customers, Customer Churn Trend, Cac Trend. This is an instantly available PowerPoint presentation that can be edited conveniently. Download it right away and captivate your audience.
-
 KPI Compare Dashboard Depicting Revenue With Expenses
Introducing our KPI Compare Dashboard Depicting Revenue With Expenses set of slides. The topics discussed in these slides are Revenue, Expense, Activity Ratio. This is an immediately available PowerPoint presentation that can be conveniently customized. Download it and convince your audience.
-
 KPI Compare Dashboard Depicting Sales Performance
Presenting our well structured KPI Compare Dashboard Depicting Sales Performance. The topics discussed in this slide are Opportunities Won, Product In Revenue, Sales Ratios. This is an instantly available PowerPoint presentation that can be edited conveniently. Download it right away and captivate your audience.
-
 Reducing Cost Of Operations Through Iot And Dashboard Depicting Supply Chain Metrics
This slide depicts the dashboard that shows supply chain metrics that covers net sales, supply chain costs, average cash-to-cash cycle, carrying costs of inventory, etc. Deliver an outstanding presentation on the topic using this Reducing Cost Of Operations Through Iot And Dashboard Depicting Supply Chain Metrics. Dispense information and present a thorough explanation of Dashboard Depicting Supply Chain Metrics using the slides given. This template can be altered and personalized to fit your needs. It is also available for immediate download. So grab it now.
-
 Staffing Dashboard Depicting Recruiting Efficiency Of Human Resource
Introducing our Staffing Dashboard Depicting Recruiting Efficiency Of Human Resource set of slides. The topics discussed in these slides are Recruiting Efficiency, Source Yield, Quality Of Hire. This is an immediately available PowerPoint presentation that can be conveniently customized. Download it and convince your audience.
-
 Staffing Dashboard Depicting Recruitment Costs
Presenting our well structured Staffing Dashboard Depicting Recruitment Costs. The topics discussed in this slide are Applications Complete, Source, Bounce Rate. This is an instantly available PowerPoint presentation that can be edited conveniently. Download it right away and captivate your audience.
-
 Product Marketing Dashboard Depicting Sales Organization Campaign Performance
This slide represents marketing dashboard for tracking campaign performance showcasing total expenditure, total impression, total clicks, total acquisitions, cost per acquisitions etc. Introducing our Product Marketing Dashboard Depicting Sales Organization Campaign Performance set of slides. The topics discussed in these slides are Product Marketing Dashboard Depicting Sales Organization Campaign Performance. This is an immediately available PowerPoint presentation that can be conveniently customized. Download it and convince your audience.
-
 Dashboard Depicting Customer Portfolio Insights
This slide focuses on the dashboard that depicts the insights about customer profiles which includes project manager name, gander, address, business phone, segments with timeline, brand affinities, interests, average online spend, churn risk, etc. Presenting our well structured Dashboard Depicting Customer Portfolio Insights. The topics discussed in this slide are Brand Affinities, Interests, Timeline. This is an instantly available PowerPoint presentation that can be edited conveniently. Download it right away and captivate your audience.
-
 Automating Sales Processes To Improve Revenues Dashboard Depicting Sales KPIs To Track Current
This slide shows the dashboard that depicts sales KPIs to track current status which involves won and lost opportunities, revenues and pipeline by territory, sales by different products, etc. Deliver an outstanding presentation on the topic using this Automating Sales Processes To Improve Revenues Dashboard Depicting Sales KPIs To Track Current. Dispense information and present a thorough explanation of Won Opportunities, Estimated, Revenue By Territory, Total Opportunities, Pipeline By Employee using the slides given. This template can be altered and personalized to fit your needs. It is also available for immediate download. So grab it now.
-
 Dashboard Depicting HR Analytics Of Organization Transforming HR Process Across Workplace
This slide shows the dashboard that depicts total number of employees including permanent, fixed contract and temporary with business unit distribution. Present the topic in a bit more detail with this Dashboard Depicting HR Analytics Of Organization Transforming HR Process Across Workplace. Use it as a tool for discussion and navigation on Dashboard Depicting HR Analytics Of Organization. This template is free to edit as deemed fit for your organization. Therefore download it now.
-
 Economic Feasibility Dashboard Depicting Income And Unemployment Analysis
This slide illustrates economic feasibility dashboard depicting income and unemployment analysis. It contains information about household income, unemployment rate, poverty, status, etc. Introducing our Economic Feasibility Dashboard Depicting Income And Unemployment Analysis set of slides. The topics discussed in these slides are Feasibility, Dashboard, Analysis. This is an immediately available PowerPoint presentation that can be conveniently customized. Download it and convince your audience.
-
 Hospital Administration System Dashboard Depicting Health Admin Tasks
This Slide represents hospital management system dashboard depicting health admin tasks. It includes detail such as active doctors, patients, representatives, nurses and other staff. Presenting our well structured Hospital Administration System Dashboard Depicting Health Admin Tasks. The topics discussed in this slide are Representative, Accountant, Receptionist. This is an instantly available PowerPoint presentation that can be edited conveniently. Download it right away and captivate your audience.
-
 Hospital Administration System Dashboard Depicting Patients Information
This Slide shows hospital management dashboard depicting patients information. It includes information about new patients, doctors, operations, hospital survey, country wise list etc. Introducing our Hospital Administration System Dashboard Depicting Patients Information set of slides. The topics discussed in these slides are Reporting Doctors, Operations Today, Hospital Earning. This is an immediately available PowerPoint presentation that can be conveniently customized. Download it and convince your audience.
-
 Strategic Process For Social Media Dashboard Depicting Social Media Recruitment Metrics
This slide depicts the dashboard showing metrics to measure social media recruitment status which covers sourcing status, bounce rate, filled positions, recruitment expenses, cost per hire, top referrers, etc. Present the topic in a bit more detail with this Strategic Process For Social Media Dashboard Depicting Social Media Recruitment Metrics. Use it as a tool for discussion and navigation on Sourcing Status, Bounce Rate, Positions Filled, Recruitment Expenses. This template is free to edit as deemed fit for your organization. Therefore download it now.
-
 Dashboard Depicting Metrics Building An Effective Customer Engagement
This slide shows dashboard that depicts metrics to measure customer experience that covers net revenue, customer retention, abandonment, unique visitors, etc. Deliver an outstanding presentation on the topic using this Dashboard Depicting Metrics Building An Effective Customer Engagement. Dispense information and present a thorough explanation of Revenue, Customer Retention, Abandonment using the slides given. This template can be altered and personalized to fit your needs. It is also available for immediate download. So grab it now.
-
 Dashboard Depicting Hr Analytics Of Organization Hr Robotic Process Automation
This slide shows the dashboard that depicts total number of employees including permanent, fixed contract and temporary with business unit distribution. Present the topic in a bit more detail with this Dashboard Depicting Hr Analytics Of Organization Hr Robotic Process Automation. Use it as a tool for discussion and navigation on Organization, Dashboard, Business. This template is free to edit as deemed fit for your organization. Therefore download it now.
-
 Dashboard Depicting Supply Chain Metrics Understanding Different Supply Chain Models
This slide shows the dashboard that depicts supply chain metrics such as total net sales, supply chain expenses, average cash to cash cycle in days, carrying costs of inventory, etc. Deliver an outstanding presentation on the topic using this Dashboard Depicting Supply Chain Metrics Understanding Different Supply Chain Models. Dispense information and present a thorough explanation of Carrying Costs Inventory, Supply Chain Expenses, Dashboard Depicting using the slides given. This template can be altered and personalized to fit your needs. It is also available for immediate download. So grab it now.
-
 Dashboard Depicting Social Media Recruitment Metrics Developing Social Media Recruitment Plan
This slide depicts the dashboard showing metrics to measure social media recruitment status which covers sourcing status, bounce rate, filled positions, recruitment expenses, cost per hire, top referrers, etc.Deliver an outstanding presentation on the topic using this Dashboard Depicting Social Media Recruitment Metrics Developing Social Media Recruitment Plan Dispense information and present a thorough explanation of Recruitment Expenses, Completed Applications, Sourcing Status using the slides given. This template can be altered and personalized to fit your needs. It is also available for immediate download. So grab it now.
-
 Dashboard Depicting Sales Kpis To Track Current Status Sales Process Automation To Improve Sales
This slide shows the dashboard that depicts sales KPIs to track current status which involves won and lost opportunities, revenues and pipeline by territory, sales by different products, etc. Deliver an outstanding presentation on the topic using this Dashboard Depicting Sales Kpis To Track Current Status Sales Process Automation To Improve Sales. Dispense information and present a thorough explanation of Dashboard, Opportunities, Products using the slides given. This template can be altered and personalized to fit your needs. It is also available for immediate download. So grab it now.


