Powerpoint Templates and Google slides for Dashboard Business
Save Your Time and attract your audience with our fully editable PPT Templates and Slides.
-
 Business Loan Performance Analysis Dashboard
This slide displays the dashboard for corporate loan performance management. It include KPIs such as total loans vs approved, loan default count trend, loan default by branch, loan approval amount by product, etc. Presenting our well structured Business Loan Performance Analysis Dashboard. The topics discussed in this slide are Business Loan Performance Analysis Dashboard. This is an instantly available PowerPoint presentation that can be edited conveniently. Download it right away and captivate your audience
-
 Business Reinvention Digital Finance Dashboard Ppt Demonstration
This slide covers transformation dashboard covering various stages of a business along with the budget and risks involved at every stage. Present the topic in a bit more detail with this Business Reinvention Digital Finance Dashboard Ppt Demonstration. Use it as a tool for discussion and navigation on Digital Sales Revenues, Sales Initiatives Benefits Realization, Digital Channels. This template is free to edit as deemed fit for your organization. Therefore download it now.
-
 Business Reinvention Inventory Management Dashboard Ppt Introduction
This slide covers the importance of introducing mobility and social media in the business and how will it impact the organizations growth. Present the topic in a bit more detail with this Business Reinvention Inventory Management Dashboard Ppt Introduction. Use it as a tool for discussion and navigation on Sales Activity, Inventory Summary, Purchase Order, Quantity Ordered. This template is free to edit as deemed fit for your organization. Therefore download it now.
-
 Business Transformation Dashboard Snapshot Ppt Summary Infographics
This slide covers transformation dashboard covering various stages of a business along with the budget and risks involved at every stage. Deliver an outstanding presentation on the topic using this Business Transformation Dashboard Snapshot Ppt Summary Infographics. Dispense information and present a thorough explanation of Plan, Design, Execute, Monitor using the slides given. This template can be altered and personalized to fit your needs. It is also available for immediate download. So grab it now.
-
 Project Business Improvement Dashboard Process Improvement Project Success
This slide provides the glimpse about the business improvement dashboard which covers the current performance, performance overview, tasks completed, admin stats, etc. Present the topic in a bit more detail with this Project Business Improvement Dashboard Process Improvement Project Success. Use it as a tool for discussion and navigation on Project Business Improvement Dashboard. This template is free to edit as deemed fit for your organization. Therefore download it now.
-
 Business Identity Dashboard Snapshot Indicating Brand Marketing KPIS
This slide shows business identity dashboard snapshot indicating brand marketing performance metrics. It contains details about brand metrics, advertisement metrics and purchase metrics. It also includes details from brand awareness to repeat purchase. Presenting our well structured Business Identity Dashboard Indicating Brand Marketing KPIS. The topics discussed in this slide are Brand Metrics, Advertising Metrics, Purchase Metrics. This is an instantly available PowerPoint presentation that can be edited conveniently. Download it right away and captivate your audience.
-
 SRM Business Performance Dashboard Snapshot Ppt Professional Format
This slide covers business and supplier relationship performance management dashboard including metrics such as cist reduction, procurement ROI, cost savings and cost avoidance etc. Present the topic in a bit more detail with this SRM Business Performance Dashboard Snapshot Ppt Professional Format. Use it as a tool for discussion and navigation on Cost Savings And Cost Avoidance, Cost Reduction, Procurement ROI. This template is free to edit as deemed fit for your organization. Therefore download it now.
-
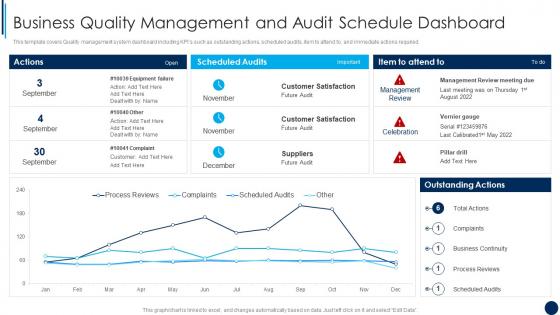 Business Quality Management And Audit Schedule Dashboard ISO 9001 Quality Management
This template covers Quality management system dashboard including KPIs such as outstanding actions, scheduled audits, item to attend to, and immediate actions required. Present the topic in a bit more detail with this Business Quality Management And Audit Schedule Dashboard ISO 9001 Quality Management. Use it as a tool for discussion and navigation on Business Quality Management And Audit Schedule Dashboard. This template is free to edit as deemed fit for your organization. Therefore download it now.
-
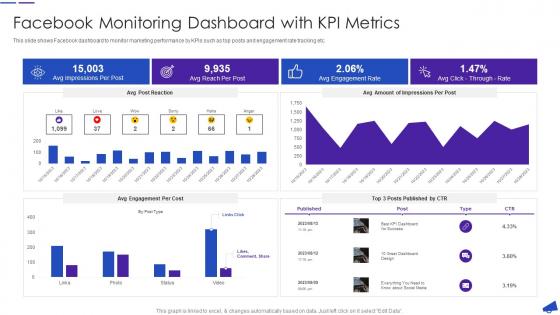 Facebook Monitoring Dashboard With KPI Metrics Facebook For Business Marketing
This slide shows Facebook dashboard to monitor marketing performance by KPIs such as top posts and engagement rate tracking etc.Deliver an outstanding presentation on the topic using this Facebook Monitoring Dashboard With KPI Metrics Facebook For Business Marketing Dispense information and present a thorough explanation of Facebook Monitoring Dashboard With Kpi Metrics using the slides given. This template can be altered and personalized to fit your needs. It is also available for immediate download. So grab it now.
-
 Dashboard Monitor Department Budget Allocation Quarterly Budget Analysis Business Organization
This slide highlights the dashboard to monitor the department wise budget allocation and usage. It provides information regarding the total budget allocated and actual amount spent by multiple organization silos such as marketing, finance, HR. It also contains details of each departments average employee spending, Deliver an outstanding presentation on the topic using this Dashboard Monitor Department Budget Allocation Quarterly Budget Analysis Business Organization. Dispense information and present a thorough explanation of Dashboard, Department, Allocation using the slides given. This template can be altered and personalized to fit your needs. It is also available for immediate download. So grab it now.
-
 Quarterly Budget Analysis Of Business Organization Dashboard For Organization Expenses Management
This slide indicates the dashboard to track department wise expenses of an organization. It also provides information regarding each department budget allocation along with total yearly expenses. Deliver an outstanding presentation on the topic using this Quarterly Budget Analysis Of Business Organization Dashboard For Organization Expenses Management. Dispense information and present a thorough explanation of Dashboard, Organization, Management using the slides given. This template can be altered and personalized to fit your needs. It is also available for immediate download. So grab it now.
-
 It service integration after merger dashboard to measure business performance
Mentioned slide portrays a dashboard for measuring business performance. Performance metrics covered in the slide are average weekly sales revenue, average revenue per unit, customer lifetime value and customer acquisition cost.Deliver an outstanding presentation on the topic using this IT Service Integration After Merger Dashboard To Measure Business Performance Dispense information and present a thorough explanation of Average Revenue, Customer Lifetime Value, Customer Acquisition Cost using the slides given. This template can be altered and personalized to fit your needs. It is also available for immediate download. So grab it now.
-
 Dashboard To Measure Business Performance Developing Managing Product Portfolio
This slide illustrates a dashboard that can be used by a product manager to measure the business performance. Metrics covered in the dashboard are revenue, launches, cash flow, EPS, average revenue by product and average cost by phase. Deliver an outstanding presentation on the topic using this Dashboard To Measure Business Performance Developing Managing Product Portfolio. Dispense information and present a thorough explanation of Dashboard To Measure Business Performance using the slides given. This template can be altered and personalized to fit your needs. It is also available for immediate download. So grab it now.
-
 Dashboard Showcasing Financial Metrics To Plan Coffee Shop Business
This slide represents financial dashboard to develop coffee business plan. It covers revenue breakdown, revenue, cash flow, and cumulative cash flow for five years. Introducing our Dashboard Showcasing Financial Metrics To Plan Coffee Shop Business set of slides. The topics discussed in these slides are Revenue Breakdown, Cash Flow, Profitability. This is an immediately available PowerPoint presentation that can be conveniently customized. Download it and convince your audience.
-
 Business Performance Monitoring KPI Dashboard M And A Playbook
Following slide illustrates the KPI dashboard for tracking business performance. KPIS covered in the dashboard are net profit margin, income and expenses, accounts receivable, quick and current ratios. Deliver an outstanding presentation on the topic using this Business Performance Monitoring KPI Dashboard M And A Playbook. Dispense information and present a thorough explanation of Net Profit Margin, Income And Expenses, Income Budget, Accounts Receivable, Accounts Payable using the slides given. This template can be altered and personalized to fit your needs. It is also available for immediate download. So grab it now.
-
 Linkedin Marketing Strategies To Grow Business Campaign Performance Evaluation Dashboard
This slide depicts the dashboard for LinkedIn marketing campaign providing information regarding impressions, clicks, engagement rate, CTR monthly trend, budget etc. Deliver an outstanding presentation on the topic using this Linkedin Marketing Strategies To Grow Business Campaign Performance Evaluation Dashboard. Dispense information and present a thorough explanation of Performance, Evaluation, Dashboard using the slides given. This template can be altered and personalized to fit your needs. It is also available for immediate download. So grab it now.
-
 Business Planning Software Dashboard To Measure Performance
This slide describes the dashboard to measure the performance of ERP implementation, and it is coving details of production and revenues. Deliver an outstanding presentation on the topic using this Business Planning Software Dashboard To Measure Performance. Dispense information and present a thorough explanation of Dashboard To Measure Performance Of ERP Implementation using the slides given. This template can be altered and personalized to fit your needs. It is also available for immediate download. So grab it now.
-
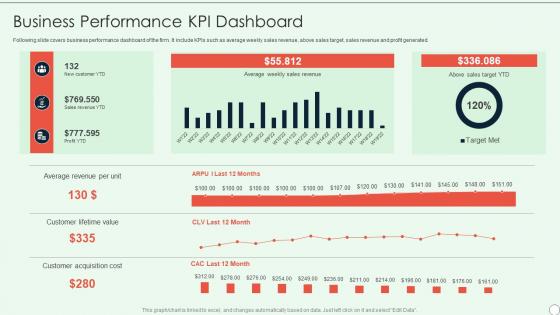 Brand Development Guide Business Performance KPI Dashboard
Following slide covers business performance dashboard of the firm. It include KPIs such as average weekly sales revenue, above sales target, sales revenue and profit generated. Present the topic in a bit more detail with this Brand Development Guide Business Performance KPI Dashboard. Use it as a tool for discussion and navigation on Average Revenue Per Unit, Customer Lifetime Value, Customer Acquisition Cost. This template is free to edit as deemed fit for your organization. Therefore download it now.
-
 Monthly Property Sales Dashboard For Real Estate Business
This slide showcases property sales dashboard to track progress and communicate key development to management. It further includes details such as US sales, target per employee, top selling segments, etc. Introducing our Monthly Property Sales Dashboard For Real Estate Business set of slides. The topics discussed in these slides are Sold Units By State, Sales Segments, Target Per Agent, Property, Dashboard. This is an immediately available PowerPoint presentation that can be conveniently customized. Download it and convince your audience.
-
 Key Business Metrics Dashboard Snapshot Corporate Business Playbook
The following dashboard displays the key business metrics such as new customers, profit, revenue per customer, and weekly revenue. Present the topic in a bit more detail with this Key Business Metrics Dashboard Snapshot Corporate Business Playbook. Use it as a tool for discussion and navigation on Key Business Metrics Dashboard. This template is free to edit as deemed fit for your organization. Therefore download it now.
-
 Business performance dashboard snapshot vendor relationship management strategies
This slide covers business and supplier relationship performance management dashboard including metrics such as cist reduction, procurement ROI, cost savings and cost avoidance etc. Present the topic in a bit more detail with this Business Performance Dashboard Snapshot Vendor Relationship Management Strategies. Use it as a tool for discussion and navigation on Cost Savings And Cost Avoidance, Cost Reduction, Cost Of Purchase Order. This template is free to edit as deemed fit for your organization. Therefore download it now.
-
 Business performance measuring kpi dashboard effective brand building strategy
Following slide covers business performance dashboard of the firm. It include KPIs such as average weekly sales revenue, above sales target, sales revenue and profit generated. Deliver an outstanding presentation on the topic using this Business Performance Measuring KPI Dashboard Effective Brand Building Strategy. Dispense information and present a thorough explanation of Average Revenue Per Unit, Customer Lifetime Value, Customer Acquisition Cost using the slides given. This template can be altered and personalized to fit your needs. It is also available for immediate download. So grab it now.
-
 Brand Strategy Framework Business Performance Dashboard
Following slide covers business performance dashboard of the firm. It include KPIs such as average weekly sales revenue, above sales target, sales revenue and profit generated. Present the topic in a bit more detail with this Brand Strategy Framework Business Performance Dashboard. Use it as a tool for discussion and navigation on Business Performance Dashboard. This template is free to edit as deemed fit for your organization. Therefore download it now.
-
 Business Forecasting Dashboard Snapshot With Sales Funnel
The following slide highlights the business forecasting dashboard snapshot with sales funnel illustrating key headings which includes sales forecast, customer revenue, forecast change analysis, number of units sold forecast, forecast accuracy, opportunity generated, customer satisfaction, sales funnel, revenue forecast and summary. Introducing our Business Forecasting Dashboard With Sales Funnel set of slides. The topics discussed in these slides are Potential Revenue, Forecasted Revenue, Forecasted Profit. This is an immediately available PowerPoint presentation that can be conveniently customized. Download it and convince your audience.
-
 Business Revenue And Sales Forecasting Dashboard Snapshot
The following slide highlights the business and sales forecasting dashboard snapshot illustrating key headings which includes revenue forecast by type, unit sold forecast, forecasting accuracy, sales by type, average sales price trend and revenue trend. Presenting our well structured Business Revenue And Sales Forecasting Dashboard. The topics discussed in this slide are Revenue, Forecasting Accuracy, Sales. This is an instantly available PowerPoint presentation that can be edited conveniently. Download it right away and captivate your audience.
-
 Ensuring Leadership Product Innovation Processes Measuring Business Unit Performance Dashboard
This slide covers dashboard that shows business unit performance such as new customers, average weekly sales revenue, sales revenues, profits, customer lifetime value, etc. Present the topic in a bit more detail with this Ensuring Leadership Product Innovation Processes Measuring Business Unit Performance Dashboard. Use it as a tool for discussion and navigation on Business, Performance, Dashboard. This template is free to edit as deemed fit for your organization. Therefore download it now.
-
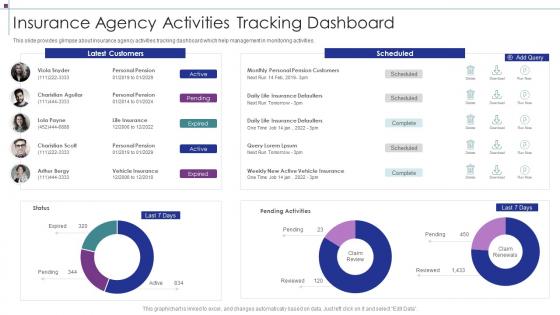 Insurance Agency Activities Tracking Dashboard Insurance Business Strategic Planning
This slide provides glimpse about insurance agency activities tracking dashboard which help management in monitoring activities. Present the topic in a bit more detail with this Insurance Agency Activities Tracking Dashboard Insurance Business Strategic Planning. Use it as a tool for discussion and navigation on Insurance Agency Activities Tracking Dashboard. This template is free to edit as deemed fit for your organization. Therefore download it now.
-
 Accelerate Digital Journey Now Business Transformation Dashboard
This slide covers transformation dashboard covering various stages of a business along with the budget and risks involved at every stage. Present the topic in a bit more detail with this Accelerate Digital Journey Now Business Transformation Dashboard. Use it as a tool for discussion and navigation on Business Transformation Dashboard. This template is free to edit as deemed fit for your organization. Therefore download it now.
-
 IT Integration Post Mergers And Acquisition Dashboard To Measure Business Performance
Mentioned slide portrays a dashboard for measuring business performance. Performance metrics covered in the slide are average weekly sales revenue, average revenue per unit, customer lifetime value and customer acquisition cost. Deliver an outstanding presentation on the topic using this IT Integration Post Mergers And Acquisition Dashboard To Measure Business Performance. Dispense information and present a thorough explanation of Average Weekly Sales Revenue, Above Sales Target I YTD, Average Revenue Per Unit, Customer Lifetime Value, New Customer I YTD using the slides given. This template can be altered and personalized to fit your needs. It is also available for immediate download. So grab it now.
-
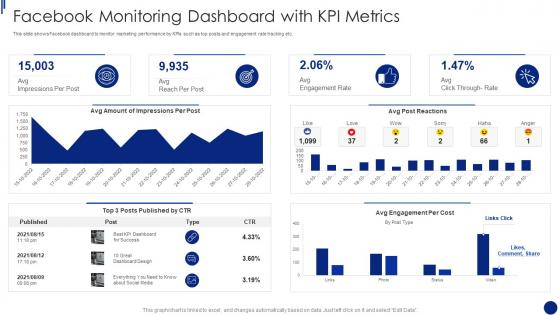 Facebook Marketing For Small Business Facebook Monitoring Dashboard With KPI Metrics
This slide shows Facebook dashboard to monitor marketing performance by KPIs such as top posts and engagement rate tracking etc. Deliver an outstanding presentation on the topic using this Facebook Marketing For Small Business Facebook Monitoring Dashboard With KPI Metrics. Dispense information and present a thorough explanation of Avg Amount Impressions Per Post, Top 3 Posts Published CTR, Avg Engagement Per Cost using the slides given. This template can be altered and personalized to fit your needs. It is also available for immediate download. So grab it now.
-
 Digital Business Revolution Business Transformation Dashboard
This slide covers transformation dashboard covering various stages of a business along with the budget and risks involved at every stage. Deliver an outstanding presentation on the topic using this Digital Business Revolution Business Transformation Dashboard. Dispense information and present a thorough explanation of Discovery Visioning, Design, Plan using the slides given. This template can be altered and personalized to fit your needs. It is also available for immediate download. So grab it now.
-
 Digital Business Revolution Digital Finance Dashboard
This slide covers transformation dashboard covering various stages of a business along with the budget and risks involved at every stage. Present the topic in a bit more detail with this Digital Business Revolution Digital Finance Dashboard. Use it as a tool for discussion and navigation on Digital Finance Dashboard. This template is free to edit as deemed fit for your organization. Therefore download it now.
-
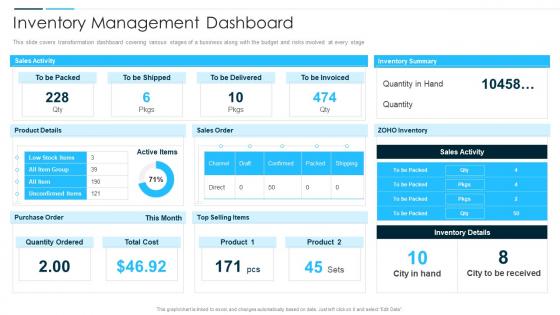 Digital Business Revolution Inventory Management Dashboard
This slide covers transformation dashboard covering various stages of a business along with the budget and risks involved at every stage. Deliver an outstanding presentation on the topic using this Digital Business Revolution Inventory Management Dashboard. Dispense information and present a thorough explanation of Inventory Management Dashboard using the slides given. This template can be altered and personalized to fit your needs. It is also available for immediate download. So grab it now.
-
 Dashboard For Business To Business Market Segmentation
This slide illustrates the market segmentation dashboard for B2B which can benefit them to improve the focus and boost the revenue of the organization. It includes the Division according to industries and company size. Presenting our well-structured Dashboard For Business To Business Market Segmentation. The topics discussed in this slide are Business, Segmentation, Organization, Industries. This is an instantly available PowerPoint presentation that can be edited conveniently. Download it right away and captivate your audience.
-
 Unlocking Business Infrastructure Capabilities Cyber Risk Management Dashboard
This slide portrays information regarding the dashboard that firm will use to manage cyber risks. The dashboard will provide clear picture of risk prevailing and how they are treated to technical engineers and board level executives. Deliver an outstanding presentation on the topic using this Unlocking Business Infrastructure Capabilities Cyber Risk Management Dashboard. Dispense information and present a thorough explanation of Management, Dashboard, Executives using the slides given. This template can be altered and personalized to fit your needs. It is also available for immediate download. So grab it now.
-
 Unlocking Business Infrastructure Capabilities Tracking Intelligence Infrastructure Activities Dashboard
This slide portrays information regarding tracking essential activities in intelligence infrastructure dashboard in terms of IT operations, security, business analytics, internet of things, etc. Present the topic in a bit more detail with this Unlocking Business Infrastructure Capabilities Tracking Intelligence Infrastructure Activities Dashboard. Use it as a tool for discussion and navigation on Intelligence, Infrastructure, Dashboard. This template is free to edit as deemed fit for your organization. Therefore download it now.
-
 Setting Up Insurance Business Insurance Agency Activities Tracking Dashboard
This slide provides glimpse about insurance agency activities tracking dashboard which help management in monitoring activities. Present the topic in a bit more detail with this Setting Up Insurance Business Insurance Agency Activities Tracking Dashboard. Use it as a tool for discussion and navigation on Pending Activities, Scheduled Reports, Latest Customers. This template is free to edit as deemed fit for your organization. Therefore download it now.
-
 Cloud business intelligence dashboard intelligent service analytics ppt formats
Present the topic in a bit more detail with this Cloud Business Intelligence Dashboard Intelligent Service Analytics Ppt Formats. Use it as a tool for discussion and navigation on Social Interactions, Key Web Metrics, Key Sales Metrics, Regional Sales Status, Marketing Influence. This template is free to edit as deemed fit for your organization. Therefore download it now.
-
 Improve management complex business partners business partners dashboard
This slide covers the business partners dashboard which covers active projects, issues found, root cause analysis, impact analysis and top vulnerabilities. Present the topic in a bit more detail with this Improve Management Complex Business Partners Business Partners Dashboard. Use it as a tool for discussion and navigation on Application Misconfiguration, Insufficient Patch Management, Brute Force Susceptibility, Insufficient Webroot Management, Server Configuration, Insufficient Session Validation, Top Vulnerabilities. This template is free to edit as deemed fit for your organization. Therefore download it now.
-
 Partner executive performance dashboard improve management complex business
This slide covers the partner executive dashboard that focuses on revenues, pipeline, capability scoreboard, key program activity summary, etc. Present the topic in a bit more detail with this Partner Executive Performance Dashboard Improve Management Complex Business. Use it as a tool for discussion and navigation on Revenue, Pipeline Dollar, Capability Scorecard Summary, Target. This template is free to edit as deemed fit for your organization. Therefore download it now.
-
 Business partners dashboard ppt slides guide partner relationship management prm
This slide covers the business partners dashboard which covers active projects, issues found, root cause analysis, impact analysis and top vulnerabilities. Deliver an outstanding presentation on the topic using this Business Partners Dashboard Ppt Slides Guide Partner Relationship Management PRM. Dispense information and present a thorough explanation of Active Projects, High Risks Pending, Medium Risks Pending, Not Audited In Qtr, Impact Analysis, Top Vulnerabilities using the slides given. This template can be altered and personalized to fit your needs. It is also available for immediate download. So grab it now.
-
 Insurance agency activities tracking dashboard commercial insurance services business plan
This slide provides glimpse about insurance agency activities tracking dashboard which help management in monitoring activities. Present the topic in a bit more detail with this Insurance Agency Activities Tracking Dashboard Commercial Insurance Services Business Plan. Use it as a tool for discussion and navigation on Latest Customers, Scheduled Reports, Personal Pension. This template is free to edit as deemed fit for your organization. Therefore download it now.
-
 Financial dashboard snapshot business impact tracking micro and macro environmental analysis
This slide shows financial dashboard for business impact tracking with key performance indicators like quick ratio, current ratio, monthly cash flow etc Present the topic in a bit more detail with this Financial Dashboard Snapshot Business Impact Tracking Micro And Macro Environmental Analysis. Use it as a tool for discussion and navigation on Financial Dashboard For Business Impact Tracking. This template is free to edit as deemed fit for your organization. Therefore download it now.
-
 Financial dashboard present business scenario micro and macro environmental analysis
This slide shows finical dashboard to demonstrate current business scenario with KPIs such as quarterly profits, quick, current and debt to equity ratio Deliver an outstanding presentation on the topic using this Financial Dashboard Present Business Scenario Micro And Macro Environmental Analysis. Dispense information and present a thorough explanation of Product Contribution, Incremental Increase, Declining Performance using the slides given. This template can be altered and personalized to fit your needs. It is also available for immediate download. So grab it now.
-
 Qa enabled business transformation qa transformation dashboard
This slide shows the QA Transformation Dashboard with Test Cases and other Variables such as Total Test Cases Passed, Test Cases Failed, Test Cases in Progress, Project Name, Project Stage, Test Type, Test Status etc.Present the topic in a bit more detail with this QA Enabled Business Transformation QA Transformation Dashboard. Use it as a tool for discussion and navigation on Percentage Of Test Cases, Test Cases By Stage, Tester By Test Status. This template is free to edit as deemed fit for your organization. Therefore download it now.
-
 Potential dashboard strawman proposal for business problem solving
The dashboard will provide overall scenario of all accounts and track new leads, top campaigns, expected revenue earned, etc.Present the topic in a bit more detail with this Potential Dashboard Strawman Proposal For Business Problem Solving. Use it as a tool for discussion and navigation on Reasons For Unqualified Leads, Expected Revenue By Marketing Channel, Regional Field Marketing. This template is free to edit as deemed fit for your organization. Therefore download it now.
-
 Project business improvement dashboard continuous improvement in project
This slide provides the glimpse about the business improvement dashboard which covers the current performance, performance overview, tasks completed, admin stats, etc. Deliver an outstanding presentation on the topic using this Project Business Improvement Dashboard Continuous Improvement In Project. Dispense information and present a thorough explanation of Business, Improvement, Dashboard using the slides given. This template can be altered and personalized to fit your needs. It is also available for immediate download. So grab it now.
-
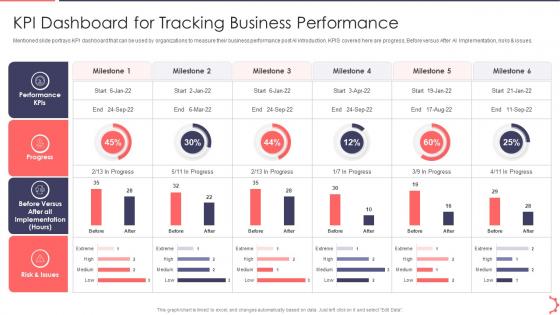 Kpi Dashboard For Tracking Business AI Playbook Accelerate Digital Transformation
Mentioned slide portrays KPI dashboard that can be used by organizations to measure their business performance post AI introduction. KPIS covered here are progress, Before versus After AI Implementation, risks and issues. Present the topic in a bit more detail with this Kpi Dashboard For Tracking Business AI Playbook Accelerate Digital Transformation . Use it as a tool for discussion and navigation on KPI Dashboard For Tracking Business Performance . This template is free to edit as deemed fit for your organization. Therefore download it now.
-
 KPI Dashboard To Measure Overall Business Performance Guide For Web Developers
Deliver an outstanding presentation on the topic using this KPI Dashboard To Measure Overall Business Performance Guide For Web Developers. Dispense information and present a thorough explanation of KPI Dashboard To Measure Overall Business Performance using the slides given. This template can be altered and personalized to fit your needs. It is also available for immediate download. So grab it now.
-
 Delivering Efficiency By Innovating Product Measuring Business Unit Performance Dashboard
This slide covers dashboard that shows business unit performance such as new customers, average weekly sales revenue, sales revenues, profits, customer lifetime value, etc. Present the topic in a bit more detail with this Delivering Efficiency By Innovating Product Measuring Business Unit Performance Dashboard. Use it as a tool for discussion and navigation on Business, Performance, Dashboard. This template is free to edit as deemed fit for your organization. Therefore download it now.
-
 Customer Satisfaction Kpi Dashboard Ensuring Business Success Maintaining
Mentioned slide portrays customer satisfaction dashboard with KPIs namely net promoter score, customer effort score and satisfaction scores. Sections covered in satisfaction score are product quality, pricing, design and service. Present the topic in a bit more detail with this Customer Satisfaction Kpi Dashboard Ensuring Business Success Maintaining. Use it as a tool for discussion and navigation on Customer Satisfaction Kpi Dashboard. This template is free to edit as deemed fit for your organization. Therefore download it now.
-
 Kpi Dashboard To Measure Partner Performance Ensuring Business Success Maintaining
Mentioned slide showcase KPI dashboard that can be used by a company to measure its partner performance. KPIS covered in the dashboard are revenue, number of pipelines closed and amount of pipeline closed versus business plan target. Present the topic in a bit more detail with this Kpi Dashboard To Measure Partner Performance Ensuring Business Success Maintaining. Use it as a tool for discussion and navigation on Kpi Dashboard To Measure Partner Performance. This template is free to edit as deemed fit for your organization. Therefore download it now.
-
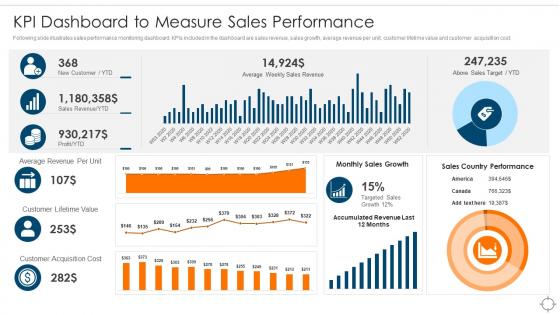 Kpi Dashboard To Measure Sales Performance Ensuring Business Success Maintaining
Following slide illustrates sales performance monitoring dashboard. KPIs included in the dashboard are sales revenue, sales growth, average revenue per unit, customer lifetime value and customer acquisition cost. Deliver an outstanding presentation on the topic using this Kpi Dashboard To Measure Sales Performance Ensuring Business Success Maintaining. Dispense information and present a thorough explanation of Kpi Dashboard To Measure Sales Performance using the slides given. This template can be altered and personalized to fit your needs. It is also available for immediate download. So grab it now.
-
 KPI Dashboard to Measure Overall Business Performance App developer playbook
Deliver an outstanding presentation on the topic using this KPI Dashboard To Measure Overall Business Performance App Developer Playbook. Dispense information and present a thorough explanation of KPI Dashboard To Measure Overall Business Performance using the slides given. This template can be altered and personalized to fit your needs. It is also available for immediate download. So grab it now.
-
 Ecommerce Marketing Dashboard For B2C Business
Mentioned slide highlights Ecommerce business dashboard for B2C which covers KPIs such as sales by product, average number of orders per customer, average product price, conversions etc. Businesses can get to know the success rate of ecommerce business by tracking this dashboard. Introducing our Ecommerce Marketing Dashboard For B2C Business set of slides. The topics discussed in these slides are Sales By Product, Marketing, Average. This is an immediately available PowerPoint presentation that can be conveniently customized. Download it and convince your audience.
-
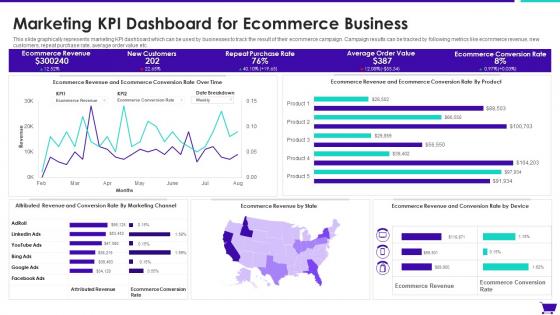 Marketing KPI Dashboard For Ecommerce Business
This slide graphically represents marketing KPI dashboard which can be used by businesses to track the result of their ecommerce campaign. Campaign results can be tracked by following metrics like ecommerce revenue, new customers, repeat purchase rate, average order value etc. Introducing our Marketing KPI Dashboard For Ecommerce Business set of slides. The topics discussed in these slides are Average, Purchase Rate, Customers. This is an immediately available PowerPoint presentation that can be conveniently customized. Download it and convince your audience.
-
 New Business Model Consulting Company Dashboards Key Metrics Of Performance Assessment
This slide shows the various performance assessment parameters of the consultancy company which includes availability, performance, maintenance, delivery adherence and trends. Deliver an outstanding presentation on the topic using this New Business Model Consulting Company Dashboards Key Metrics Of Performance Assessment. Dispense information and present a thorough explanation of Dashboards, Performance, Assessment using the slides given. This template can be altered and personalized to fit your needs. It is also available for immediate download. So grab it now.
-
 New Business Model Consulting Dashboards Showing Consultancy Company Performance
This slide shows the dashboard related to consultancy company performance which includes budget preparation, sales and goals. Company profits and goals etc. Deliver an outstanding presentation on the topic using this New Business Model Consulting Dashboards Showing Consultancy Company Performance. Dispense information and present a thorough explanation of Dashboards, Consultancy, Performance using the slides given. This template can be altered and personalized to fit your needs. It is also available for immediate download. So grab it now.
-
 Playbook For Developers Kpi Dashboard To Measure Overall Business Performance
Present the topic in a bit more detail with this Playbook For Developers Kpi Dashboard To Measure Overall Business Performance. Use it as a tool for discussion and navigation on Business, Performance, Dashboard. This template is free to edit as deemed fit for your organization. Therefore download it now.
-
 Ai Transformation Playbook Kpi Dashboard For Tracking Business Performance
Mentioned slide portrays KPI dashboard that can be used by organizations to measure their business performance post AI introduction. KPIS covered here are progress, Before versus After AI Implementation, risks and issues.Present the topic in a bit more detail with this Ai Transformation Playbook Kpi Dashboard For Tracking Business Performance Use it as a tool for discussion and navigation on KPI Dashboard For Tracking Business Performance This template is free to edit as deemed fit for your organization. Therefore download it now.


