Powerpoint Templates and Google slides for Dashboard And KPIs
Save Your Time and attract your audience with our fully editable PPT Templates and Slides.
-
 Transportation kpi dashboard showing shipments by country and transit time
Presenting transportation KPI Dashboard showing shipments by country and transit time PPT slide. This deck offers you plenty of space to put in titles and subtitles. This template is Excel linked just right click to input your information. High resolution based layout, does not change the image even after resizing. This presentation icon is fully compatible with Google slides. Quick downloading speed and simple editing options in color text and fonts.PPT icons can easily be changed into JPEG and PDF applications
-
 Transportation kpi dashboard showing shipping revenue and outbound shipping costs
Presenting transportation KPI dashboard showing shipping revenue and outbound shipping costs PPT slide. Simple data input like company logo, name or trademark. User can edit the data in linked excel sheet and graphs and charts gets customized accordingly .This PPT slide offers you plenty of space to put in titles and sub titles. High resolution based presentation layout, does not change the image even after resizing. This presentation icon is data driven and template can be downloaded via excel file to incorporate data.
-
 Banking kpi dashboard showing income mix and loan spread
Presenting this set of slides with name - Banking Kpi Dashboard Showing Income Mix And Loan Spread. This is a four stage process. The stages in this process are Banking, Finance, Money.
-
 Banking kpi dashboard showing lead conversion and acquisition cost
Presenting this set of slides with name - Banking Kpi Dashboard Showing Lead Conversion And Acquisition Cost. This is a five stage process. The stages in this process are Banking, Finance, Money.
-
 Banking kpi dashboard showing personal checking and debit card penetration
Presenting this set of slides with name - Banking Kpi Dashboard Showing Personal Checking And Debit Card Penetration. This is a two stage process. The stages in this process are Banking, Finance, Money.
-
 Banking kpi dashboard showing revenue vs expenses and returns
Presenting this set of slides with name - Banking Kpi Dashboard Showing Revenue Vs Expenses And Returns. This is a five stage process. The stages in this process are Banking, Finance, Money.
-
 Banking kpi dashboard showing sales funnel and overall revenue
Presenting this set of slides with name - Banking Kpi Dashboard Showing Sales Funnel And Overall Revenue. This is a six stage process. The stages in this process are Banking, Finance, Money.
-
 Banking kpi dashboard showing top contacts and client value
Presenting this set of slides with name - Banking Kpi Dashboard Showing Top Contacts And Client Value. This is a three stage process. The stages in this process are Banking, Finance, Money.
-
 Banking kpi dashboard sowing top contacts and client value
Presenting this set of slides with name - Banking Kpi Dashboard Sowing Top Contacts And Client Value. This is a six stage process. The stages in this process are Banking, Finance, Money.
-
 Devops kpi dashboard showing activity by application and errors by app
Presenting this set of slides with name - Devops Kpi Dashboard Showing Activity By Application And Errors By App. This is a six stage process. The stages in this process are Development And Operations, Devops.
-
 Devops kpi dashboard showing api and site response time
Presenting this set of slides with name - Devops Kpi Dashboard Showing Api And Site Response Time. This is a four stage process. The stages in this process are Development And Operations, Devops.
-
 Devops kpi dashboard showing api status and uptime
Presenting this set of slides with name - Devops Kpi Dashboard Showing Api Status And Uptime. This is a four stage process. The stages in this process are Development And Operations, Devops.
-
 Devops kpi dashboard showing build and quality health
Presenting this set of slides with name - Devops Kpi Dashboard Showing Build And Quality Health. This is a four stage process. The stages in this process are Development And Operations, Devops.
-
 Devops kpi dashboard showing builds per day and code repo
Presenting this set of slides with name - Devops Kpi Dashboard Showing Builds Per Day And Code Repo. This is a three stage process. The stages in this process are Development And Operations, Devops.
-
 Devops kpi dashboard showing commits and defective files
Presenting this set of slides with name - Devops Kpi Dashboard Showing Commits And Defective Files. This is a six stage process. The stages in this process are Development And Operations, Devops.
-
 Devops kpi dashboard showing public interface and project burndown
Presenting this set of slides with name - Devops Kpi Dashboard Showing Public Interface And Project Burndown. This is a four stage process. The stages in this process are Development And Operations, Devops.
-
 Devops kpi dashboard showing runbook execution and command execution
Presenting this set of slides with name - Devops Kpi Dashboard Showing Runbook Execution And Command Execution. This is a six stage process. The stages in this process are Development And Operations, Devops.
-
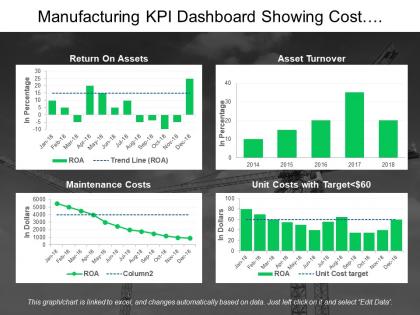 Manufacturing kpi dashboard showing cost management and asset turnover
Presenting this set of slides with name - Manufacturing Kpi Dashboard Showing Cost Management And Asset Turnover. This is a four stage process. The stages in this process are Manufacturing, Production, Manufacture.
-
 Manufacturing kpi dashboard showing defect density and rate of return
Presenting this set of slides with name - Manufacturing Kpi Dashboard Showing Defect Density And Rate Of Return. This is a four stage process. The stages in this process are Manufacturing, Production, Manufacture.
-
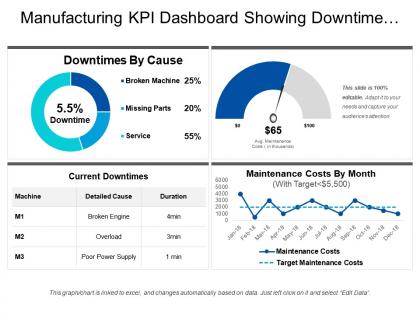 Manufacturing kpi dashboard showing downtime by cause and current downtimes
Presenting this set of slides with name - Manufacturing Kpi Dashboard Showing Downtime By Cause And Current Downtimes. This is a four stage process. The stages in this process are Manufacturing, Production, Manufacture.
-
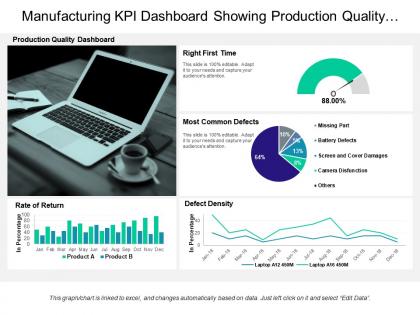 Manufacturing kpi dashboard showing production quality and defect density
Presenting this set of slides with name - Manufacturing Kpi Dashboard Showing Production Quality And Defect Density. This is a four stage process. The stages in this process are Manufacturing, Production, Manufacture.
-
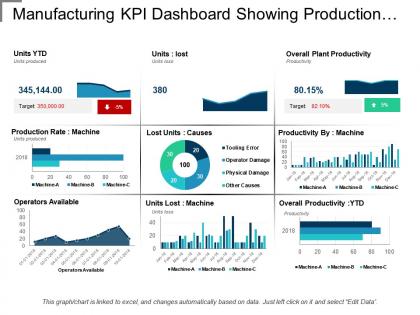 Manufacturing kpi dashboard showing production rate and lost units
Presenting manufacturing KPI dashboard showing production rate and lost units. This layout is compatible with Google slides and data can be updated with excel linked file. Easy to put in company logo, trademark or name; accommodate words to support the key points. Images do no blur out even when they are projected on large screen.PPT template can be utilized by sales and marketing teams and business managers. Instantly downloadable slide and supports formats like JPEG and PDF.
-
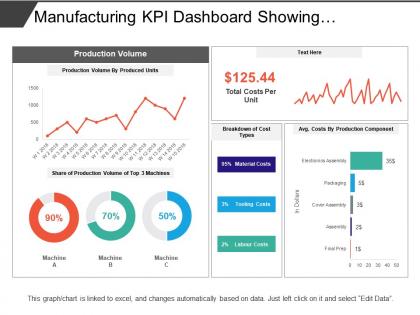 Manufacturing kpi dashboard showing production volume and cost breakdown
Presenting this set of slides with name - Manufacturing Kpi Dashboard Showing Production Volume And Cost Breakdown. This is a four stage process. The stages in this process are Manufacturing, Production, Manufacture.
-
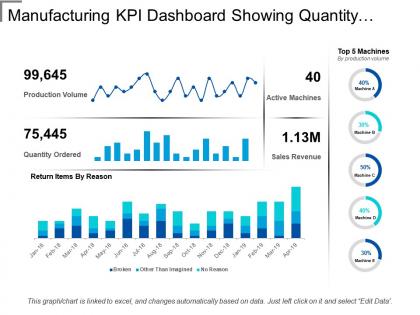 Manufacturing kpi dashboard showing quantity ordered and active machines
Presenting this set of slides with name - Manufacturing Kpi Dashboard Showing Quantity Ordered And Active Machines. This is a four stage process. The stages in this process are Manufacturing, Production, Manufacture.
-
 Technology kpi dashboard showing app users and disk usage
Presenting this set of slides with name - Technology Kpi Dashboard Showing App Users And Disk Usage. This is a nine stage process. The stages in this process are Technology, IT, IOT.
-
 Technology kpi dashboard showing application and compute availability
Presenting this set of slides with name - Technology Kpi Dashboard Showing Application And Compute Availability. This is a seven stage process. The stages in this process are Technology, IT, IOT.
-
 Technology kpi dashboard showing defects by type and severity
Presenting this set of slides with name - Technology Kpi Dashboard Showing Defects By Type And Severity. This is a six stage process. The stages in this process are Technology, IT, IOT.
-
 Technology kpi dashboard showing network activities and device usage
Introducing Technology KPI dashboard showing network activities PPT design. Quick download and simple to convert into JPEG and PDF document. High quality presentation slide comes with editing options as color, text and font can be edited at any stage. Preference to display PowerPoint template in standard and widescreen display view. Presentation graphic is accessible with different nodes and stages. Easy to present with large audience. Amend the design with corporate name and icon.
-
 Technology kpi dashboard showing percent availability and performance
Displaying Technology KPI dashboard percent availability PowerPoint design. Colors and text can be easily changed as the PPT slide is completely editable. Modify the design with brand name and logo. Presentation diagram is available both Standard and Widescreen slide. Fast and easy download with saving options. Adaptable with other software’s such as PDF or JPG formats. PowerPoint graphic is fully compatible with Google slides as can be merged with them accordingly.
-
 Technology kpi dashboard showing servers online backup and city monitor
Sharing technology KPI dashboard server’s online backup presentation template.PPT design is adjustable with Google slides. Quick to download and can be shared into JPG and PDF format. Fully amendable as color, text and font as elements can be modified. Sharing can be possible on both standard and widescreen. Matching designs are available with different nodes and stages. Ready to use PowerPoint slide are compatible with Google slides and can be merged easily.
-
 Technology kpi dashboard snapshot showing site visitors and server control panel
Showcasing technology KPI dashboard presentation slide that comes with editing options. PowerPoint design can be downloaded with different nodes and stages. Completely modifiable design as fonts, text, colors can be edited. Customize the presentation by adding trade information i.e. name, logo, icon and tagline. Simple and fast download. Easy convert into PDF or JPG formats. Works well with Google slides. PPT template is easy to share among large set of audience.
-
 Financial hospitality management kpi and dashboard
Increase audience engagement and knowledge by dispensing information using Financial Hospitality Management KPI And Dashboard. This template helps you present information on three stages. You can also present information on Minimum, Medium, Maximum using this PPT design. This layout is completely editable so personaize it now to meet your audiences expectations.
-
 Hospitality management kpi and dashboard icons slide
Presenting our premium Hospitality Management KPI And Dashboard Icons Slide set of slides with flexible icons. The icons are designed by our group of professionals. Add these Hospitality Management KPI And Dashboard Icons Slide to your presentation to make it visually appealing. Also, edit them according to your requirement. Download it and captive your audience.
-
 Kpi dashboard for monitoring software devops automation tools and technologies it
This slide shows software development project management dashboard. KPIs covered in the dashboard are status of planning, design, development, testing project launch date, project budget, overdue tasks, workload and upcoming deadlines.Present the topic in a bit more detail with this KPI Dashboard For Monitoring Software DevOps Automation Tools And Technologies IT Use it as a tool for discussion and navigation on KPI Dashboard For Monitoring Software Development This template is free to edit as deemed fit for your organization. Therefore download it now.
-
 PMO Dashboard With Strategy And Delivery KPI
Introducing our PMO Dashboard With Strategy And Delivery KPI set of slides. The topics discussed in these slides are Strategy, Capability, Delivery. This is an immediately available PowerPoint presentation that can be conveniently customized. Download it and convince your audience.
-
 KPI Dashboard To Monitor Sales And Guide For Positioning Extended Brand Branding
Following slide displays sales and orders performance monitoring dashboard. Key performance indicators covered in the slide are return reasons, perfect order rate, total orders, top seller by orders.Deliver an outstanding presentation on the topic using this KPI Dashboard To Monitor Sales And Guide For Positioning Extended Brand Branding. Dispense information and present a thorough explanation of Brand Awareness, Advertising Awareness, Brand Commitment using the slides given. This template can be altered and personalized to fit your needs. It is also available for immediate download. So grab it now.
-
 Dashboard KPI Colored Icon In Powerpoint Pptx Png And Editable Eps Format
Give your next presentation a sophisticated, yet modern look with this 100 percent editable Dashboard kpi colored icon in powerpoint pptx png and editable eps format. Choose from a variety of customizable formats such as PPTx, png, eps. You can use these icons for your presentations, banners, templates, One-pagers that suit your business needs.
-
 Dashboard KPI Monotone Icon In Powerpoint Pptx Png And Editable Eps Format
Make your presentation profoundly eye-catching leveraging our easily customizable Dashboard kpi monotone icon in powerpoint pptx png and editable eps format. It is designed to draw the attention of your audience. Available in all editable formats, including PPTx, png, and eps, you can tweak it to deliver your message with ease.
-
 Customer Checkout Behavior Kpi Dashboard Analyzing And Implementing Management System
This slide represents the dashboard to help management in analyzing the point at which customers leave the checkout process. It includes details related to KPIs such as shipping drop-off, payment drop-off etc. Present the topic in a bit more detail with this Customer Checkout Behavior Kpi Dashboard Analyzing And Implementing Management System. Use it as a tool for discussion and navigation on Dashboard, Comparison Period, Session With Transaction. This template is free to edit as deemed fit for your organization. Therefore download it now.
-
 Identifying And Optimizing Customer Touchpoints KPI Dashboard For Tracking Consumer Journey Touchpoints
This slide covers a touchpoint dashboard with different customer journey stages. It also includes a detailed evaluation of each stage on the basis of experience, importance, etc. Deliver an outstanding presentation on the topic using this Identifying And Optimizing Customer Touchpoints KPI Dashboard For Tracking Consumer Journey Touchpoints. Dispense information and present a thorough explanation of KPI Dashboard For Tracking, Consumer Journey Touchpoints using the slides given. This template can be altered and personalized to fit your needs. It is also available for immediate download. So grab it now.
-
 Financial Planning And Analysis Best Practices KPI Metrics Dashboard Highlighting Organization
The following slide outlines the glimpse of financial analysis course. The slide covers information about the key highlights of the course, attendees and learning outcome. Increase audience engagement and knowledge by dispensing information using Financial Planning And Analysis Best Practices KPI Metrics Dashboard Highlighting Organization. This template helps you present information on two stages. You can also present information on Key Highlights, Attendees, Learning Outcome, Financial Analysis Course using this PPT design. This layout is completely editable so personaize it now to meet your audiences expectations.
-
 Mobile App Marketing Result Analysis With KPI Dashboard Understanding Pros And Cons MKT SS V
The following slide highlights mobile application promotions outcomes to optimize brand reach and assess new customers acquired. It includes elements such as sessions, responses, response rate, installs, activated, engaged, buyers, campaign results etc. Present the topic in a bit more detail with this Mobile App Marketing Result Analysis With KPI Dashboard Understanding Pros And Cons MKT SS V. Use it as a tool for discussion and navigation on Campaign, App Marketing, Result Analysis. This template is free to edit as deemed fit for your organization. Therefore download it now.
-
 Analysis And Deployment Of Efficient Ecommerce Customer Checkout Behavior KPI Dashboard
This slide represents the dashboard to help management in analyzing the point at which customers leave the checkout process. It includes details related to KPIs such as shipping drop off, payment drop off etc. Deliver an outstanding presentation on the topic using this Analysis And Deployment Of Efficient Ecommerce Customer Checkout Behavior KPI Dashboard. Dispense information and present a thorough explanation of Customer Checkout Behavior, KPI Dashboard, Shipping Dropoff using the slides given. This template can be altered and personalized to fit your needs. It is also available for immediate download. So grab it now.
-
 Manufacturing KPIS And Metrics Dashboard Icon
Presenting our set of slides with Manufacturing KPIS And Metrics Dashboard Icon. This exhibits information on three stages of the process. This is an easy to edit and innovatively designed PowerPoint template. So download immediately and highlight information on Manufacturing KPIS, Metrics Dashboard Icon.
-
 Customer Service Measurement KPI Dashboard Workplace Innovation And Technological
Mentioned slide portrays customer service measurement KPI dashboard that includes metrics namely request volume vs. service level, customer satisfaction, customer retention, costs per support and average time to solve issue. Deliver an outstanding presentation on the topic using this Customer Service Measurement KPI Dashboard Workplace Innovation And Technological. Dispense information and present a thorough explanation of Customer Satisfaction, Costs, Customer Retention using the slides given. This template can be altered and personalized to fit your needs. It is also available for immediate download. So grab it now.
-
 Dashboard To Track And Analyse Change Management Training Kpis Role Of Training In Effective
This slide represents the KPI dashboard to track and monitor the effectiveness of change management training program conducted by the organization. It includes key metrics such as active employees, no.of trainings, cost etc. Increase audience engagement and knowledge by dispensing information using Dashboard To Track And Analyse Change Management Training Kpis Role Of Training In Effective. This template helps you present information on one stages. You can also present information on Metrics, Kpis, Cost Per Employee using this PPT design. This layout is completely editable so personaize it now to meet your audiences expectations.
-
 Dashboard To Track And Analyse KPIs Change Administration Training Program Outline
This slide represents the KPI dashboard to track and monitor the effectiveness of change management training program conducted by the organization. It includes key metrics such as active employees,no.of trainings,cost etc.Deliver an outstanding presentation on the topic using this Dashboard To Track And Analyse KPIs Change Administration Training Program Outline. Dispense information and present a thorough explanation of Employee Engagement,Returns Investments,Customer Engagement using the slides given. This template can be altered and personalized to fit your needs. It is also available for immediate download. So grab it now.
-
 Procurement kpi dashboard snapshot data driven and editable ppt sample file
Presenting procurement kpi dashboard snapshot data driven and editable ppt sample file. This is a procurement kpi dashboard data driven and editable ppt sample file. This is a seven stage process. The stages in this process are business, strategy, growth, finance, chart and graph.
-
 Achieving Sales Target Sales Performance And Sales Kpi Dashboard Snapshot Ppt Icon
Presenting Achieving Sales Target Sales Performance and Sales KPI Dashboard Snapshot PPT Icon. This presentation includes five stage processes with all the instructions to customize as per your needs and preferences. The stages in this process are sales objectives, sales goal, achieving sales target. You can add your brand’s name, logo or label for that extra impact. The Complete information and Enhanced Visuals are the strongest points of this Sales KPI Dashboard PPT.
-
 Project status kpi dashboard showing performance and resource capacity
Presenting this set of slides with name - Project Status Kpi Dashboard Showing Performance And Resource Capacity. This is a six stage process. The stages in this process are Project Health Card, Project Performance, Project Status.
-
 Project status kpi dashboard snapshot showing progress and risk matrix
Presenting project status KPI dashboard snapshot showing progress and risk matrix PowerPoint template. Simple data input like company logo, name or trademark. This PowerPoint theme is fully supported by Google slides. Picture quality of these slides does not change even when projected on large screen. This formats can be easily changed to JPEG and PDF applications. This template is suitable for marketing, sales persons, business managers and entrepreneurs. Adjust PPT layout, font, text and color as per your necessity
-
 Project status kpi dashboard showing project plan and burndown chart
Presenting status KPI dashboard showing project plan and burndown chart PowerPoint slides. This layout is Compatible with Google slides. Easy to put in company logo, trademark or name; accommodate words to support the key points. Images do no blur out even when they are projected on large screen.PPT template can be utilized by sales and marketing teams and business managers. Instantly downloadable slide and supports formats like JPEG and PDF. Adjust colors, text and fonts as per your business requirements.
-
 Project status kpi dashboard showing workload cost and issues
Presenting this set of slides with name - Project Status Kpi Dashboard Showing Workload Cost And Issues. This is a four stage process. The stages in this process are Project Health Card, Project Performance, Project Status.
-
 1114 Kpis Scorecards And Dashboards Powerpoint Presentation
We are proud to present our 1114 kpis scorecards and dashboards powerpoint presentation. Interconnected text box diagram has been used to decorate this power point template slide. This PPT diagram slide contains the concept of displaying KPIS score card. We have also used dashboard graphic to decorate this PPT slide.
-
 Technology kpi dashboard showing availability and performance
Presenting this set of slides with name - Technology Kpi Dashboard Showing Availability And Performance. This is a five stage process. The stages in this process are Technology, IT, IOT.
-
 Kpis and dashboard ppt powerpoint presentation file example introduction
Presenting this set of slides with name - Kpis And Dashboard Ppt Powerpoint Presentation File Example Introduction. This is a two stage process. The stages in this process are Dashboard, Management, Marketing, Business.
-
 Kpi and dashboard ppt powerpoint presentation file visual aids
Presenting this set of slides with name - Kpi And Dashboard Ppt Powerpoint Presentation File Visual Aids. This is a two stage process. The stages in this process are Business, Management, Marketing.
-
 Kpi and dashboard snapshot ppt styles infographic template
Presenting this set of slides with name - Kpi And Dashboard Snapshot Ppt Styles Infographic Template. This is a two stage process. The stages in this process are Dashboard, Business, Management, Marketing.
-
 Retail kpi dashboard showing sales revenue customers and out of stock items
Presenting this set of slides with name - Retail Kpi Dashboard Showing Sales Revenue Customers And Out Of Stock Items. This is a six stage process. The stages in this process are Percentage, Product, Management, Marketing, Business.
-
 Kpi metrics and dashboard ppt slides graphics tutorials
Presenting this set of slides with name - Kpi Metrics And Dashboard Ppt Slides Graphics Tutorials. This is a three stage process. The stages in this process are Employee Weekly Efficiency Dashboard, Labor Effectiveness Dashboard.


