Powerpoint Templates and Google slides for Dashboard And Analytics
Save Your Time and attract your audience with our fully editable PPT Templates and Slides.
-
 Mobile analytics dashboard showing daily and weekly retention
Presenting this set of slides with name - Mobile Analytics Dashboard Showing Daily And Weekly Retention. This is a four stage process. The stages in this process are Mobile Analytics, Mobile Tracking, Mobile Web Analytics.
-
 Vendor kpi dashboard showing store analytics sales by product and product stats
Presenting this set of slides with name - Vendor Kpi Dashboard Showing Store Analytics Sales By Product And Product Stats. This is a four stage process. The stages in this process are Vendor, Supplier, Retailer.
-
 Business intelligence market analytics and performance dashboard
Presenting this set of slides with name - Business Intelligence Market Analytics And Performance Dashboard. This is a three stage process. The stages in this process are Business Understanding, Business Intelligence, Business Knowledge.
-
 Business analytics dashboard snapshot customer share and balance by region
This is a four stage process. The stages in this process are Business Analytics, BA, Organizations Data.
-
 Business analytics dashboard snapshot with net sales product inventory purchases and performance
This is a five stage process. The stages in this process are Business Analytics, BA, Organizations Data.
-
 Business analytics dashboard snapshot with online sales tracking and product profit per unit
This is a two stage process. The stages in this process are Business Analytics, BA, Organizations Data.
-
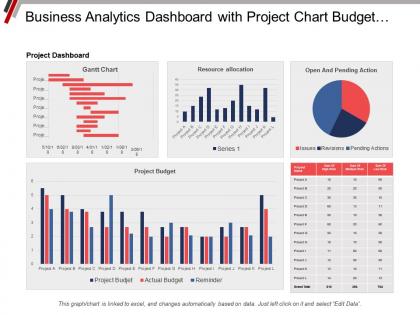
 Business analytics dashboard snapshot with project chart budget resource allocation and pending actions
This is a five stage process. The stages in this process are Business Analytics, BA, Organizations Data.
-
 Business analytics dashboard snapshot with revenue by month and region
This is a two stage process. The stages in this process are Business Analytics, BA, Organizations Data.
-
 Business analytics dashboard snapshot with revenue per product line and detailed profit
This is a eight stage process. The stages in this process are Business Analytics, BA, Organizations Data.
-
 Business analytics dashboard with supply chain overview and sales in unit price increase or decrease
This is a three stage process. The stages in this process are Business Analytics, BA, Organizations Data.
-
 Business analytics dashboard with total leads sales and new customers
This is a three stage process. The stages in this process are Business Analytics, BA, Organizations Data.
-
 Website Speed Optimization And Bounce Rate Analytics Dashboard
This slide covers website loading speed analytics. It also includes average bounce rates, time spend on website, country based average load time, browser based bounce rates, etc. Introducing our Website Speed Optimization And Bounce Rate Analytics Dashboard set of slides. The topics discussed in these slides are Website Speed Optimization, Bounce Rate Analytics, Dashboard. This is an immediately available PowerPoint presentation that can be conveniently customized. Download it and convince your audience.
-
 Workforce Sales And Productivity Analytics Dashboard Icon
Presenting our set of slides with name Workforce Sales And Productivity Analytics Dashboard Icon. This exhibits information on four stages of the process. This is an easy to edit and innovatively designed PowerPoint template. So download immediately and highlight information on Workforce Sales And Productivity, Analytics Dashboard Icon.
-
 Analytics Dashboard Colored Icon In Powerpoint Pptx Png And Editable Eps Format
Give your next presentation a sophisticated, yet modern look with this 100 percent editable Analytics dashboard colored icon in powerpoint pptx png and editable eps format. Choose from a variety of customizable formats such as PPTx, png, eps. You can use these icons for your presentations, banners, templates, One-pagers that suit your business needs.
-
 Analytics Dashboard Monotone Icon In Powerpoint Pptx Png And Editable Eps Format
Make your presentation profoundly eye-catching leveraging our easily customizable Analytics dashboard monotone icon in powerpoint pptx png and editable eps format. It is designed to draw the attention of your audience. Available in all editable formats, including PPTx, png, and eps, you can tweak it to deliver your message with ease.
-
 SLA Dashboard Icon With Analytics And Interfaces
Presenting our set of slides with SLA Dashboard Icon With Analytics And Interfaces. This exhibits information on three stages of the process. This is an easy to edit and innovatively designed PowerPoint template. So download immediately and highlight information on SLA Dashboard, Analytics And Interfaces.
-
 SLA Dashboard With Graph And Analytics Icon
Introducing our SLA Dashboard With Graph And Analytics Icon set of slides. The topics discussed in these slides are SLA Dashboard, Graph And Analytics. This is an immediately available PowerPoint presentation that can be conveniently customized. Download it and convince your audience.
-
 Time To Market Analytics And Monitoring Dashboard Icon
Introducing our premium set of slides with Time To Market Analytics And Monitoring Dashboard Icon. Ellicudate the four stages and present information using this PPT slide. This is a completely adaptable PowerPoint template design that can be used to interpret topics like Time To Market, Analytics And Monitoring, Dashboard Icon. So download instantly and tailor it with your information.
-
 Transportation Metrics And Analytics Dashboard
Introducing our Transportation Metrics And Analytics Dashboard set of slides. The topics discussed in these slides are Transportation, Analytics, Dashboard. This is an immediately available PowerPoint presentation that can be conveniently customized. Download it and convince your audience.
-
 Transportation Reporting And Analytics Dashboard Snapshot
The following slide highlights the transportation reporting and analytics dashboard snapshot illustrating total order on time pick up, on time delivery, delivery efficiency, shipment lead time, carrier details and address specific pick up, delivery and transit time reports. Presenting our well structured Transportation Reporting And Analytics Dashboard. The topics discussed in this slide are Analytics, Dashboard, Transportation. This is an instantly available PowerPoint presentation that can be edited conveniently. Download it right away and captivate your audience.
-
 Customer Analytics Dashboard In Powerpoint And Google Slides Cpb
Presenting our Customer Analytics Dashboard In Powerpoint And Google Slides Cpb PowerPoint template design. This PowerPoint slide showcases five stages. It is useful to share insightful information on Customer Analytics Dashboard. This PPT slide can be easily accessed in standard screen and widescreen aspect ratios. It is also available in various formats like PDF, PNG, and JPG. Not only this, the PowerPoint slideshow is completely editable and you can effortlessly modify the font size, font type, and shapes according to your wish. Our PPT layout is compatible with Google Slides as well, so download and edit it as per your knowledge.
-
 Predictive Analytics Dashboard Colored Icon In Powerpoint Pptx Png And Editable Eps Format
Give your next presentation a sophisticated, yet modern look with this 100 percent editable Predictive analytics dashboard colored icon in powerpoint pptx png and editable eps format. Choose from a variety of customizable formats such as PPTx, png, eps. You can use these icons for your presentations, banners, templates, One-pagers that suit your business needs.
-
 Predictive Analytics Dashboard Monotone Icon In Powerpoint Pptx Png And Editable Eps Format
Make your presentation profoundly eye-catching leveraging our easily customizable Predictive analytics dashboard monotone icon in powerpoint pptx png and editable eps format. It is designed to draw the attention of your audience. Available in all editable formats, including PPTx, png, and eps, you can tweak it to deliver your message with ease.
-
 Ecommerce Dashboard Google Analytics In Powerpoint And Google Slides Cpb
Presenting our Ecommerce Dashboard Google Analytics In Powerpoint And Google Slides Cpb PowerPoint template design. This PowerPoint slide showcases six stages. It is useful to share insightful information on Ecommerce Dashboard Google Analytics. This PPT slide can be easily accessed in standard screen and widescreen aspect ratios. It is also available in various formats like PDF, PNG, and JPG. Not only this, the PowerPoint slideshow is completely editable and you can effortlessly modify the font size, font type, and shapes according to your wish. Our PPT layout is compatible with Google Slides as well, so download and edit it as per your knowledge.
-
 Cloud governance dashboard snapshot analytics auditing and budget
Presenting this set of slides with name - Cloud Governance Dashboard Snapshot Analytics Auditing And Budget. This is a three stage process. The stages in this process are Cloud Governance, Cloud Computing, Cloud Management.
-
 Employee analytics dashboard showing overtime salary and bonus
Presenting this set of slides with name Employee Analytics Dashboard Showing Overtime Salary And Bonus. The topics discussed in these slides are Employee Strength, Performance, Overtime, Bonus. This is a completely editable PowerPoint presentation and is available for immediate download. Download now and impress your audience.
-
 Summarize business analytics dashboard with graphs and pie chart
Presenting this set of slides with name Summarize Business Analytics Dashboard With Graphs And Pie Chart. The topics discussed in these slides is Summarize Business Analytics Dashboard With Graphs And Pie Chart. This is a completely editable PowerPoint presentation and is available for immediate download. Download now and impress your audience.
-
 Industry analytics dashboard for gym health and fitness clubs ppt powerpoint presentation example
This slide covers the Key performance indicators for analysing social media platforms, email campaigns and website performance. Increase audience engagement and knowledge by dispensing information using Industry Analytics Dashboard For Gym Health And Fitness Clubs Ppt Powerpoint Presentation Example. This template helps you present information on one stage. You can also present information on Analytics Dashboard For Gym Health And Fitness Clubs using this PPT design. This layout is completely editable so personalize it now to meet your audiences expectations.
-
 Sense buzz analytics dashboard snapshot with quantity and sales kpis powerpoint template
This slide Covers the Statistical Representation of Sense Buzz. Data covered in this dashboard snapshot includes-Quantity per type with sales per type over time. This is Sense Buzz Analytics Dashboard Snapshot With Quantity And Sales KPIs Powerpoint Template with high quality vector based graphics, that can be edited as per your business needs. You can also reproduce this slide in various formats, be it PNG, JPG, etc. This slide also comes with an additional feature of portrayal on standard and widescreen aspect ratios, thus retaining its high quality.
-
 Analytics dashboard for gym health and fitness clubs wellness industry overview ppt gallery
This slide covers the Key performance indicators for analysing social media platforms, email campaigns and website performance Present the topic in a bit more detail with this Analytics Dashboard For Gym Health And Fitness Clubs Wellness Industry Overview Ppt Gallery. Use it as a tool for discussion and navigation on social media friends. This template is free to edit as deemed fit for your organization. Therefore download it now.
-
 Analytics dashboard for gym health and fitness clubs ppt powerpoint presentation show template
This slide covers the Key performance indicators for analysing social media platforms, email campaigns and website performance Increase audience engagement and knowledge by dispensing information using Analytics Dashboard For Gym Health And Fitness Clubs Ppt Powerpoint Presentation Show Template. This template helps you present information on seven stages. You can also present information on Analytics Dashboard For Gym Health And Fitness Clubs using this PPT design. This layout is completely editable so personaize it now to meet your audiences expectations.
-
 Analytics dashboard for gym health and fitness clubs market entry strategy industry ppt ideas
This slide covers the Key performance indicators for analysing social media platforms, email campaigns and website performance.Present the topic in a bit more detail with this Analytics Dashboard For Gym Health And Fitness Clubs Market Entry Strategy Industry Ppt Ideas. Use it as a tool for discussion and navigation on referrals from social media friends. This template is free to edit as deemed fit for your organization. Therefore download it now.
-
 Human resource reporting and analytics dashboard with employee performance kpi
Presenting our well structured Human Resource Reporting And Analytics Dashboard With Employee Performance KPI. The topics discussed in this slide are Human Resource Reporting, Analytics Dashboard, Employee Performance KPI. This is an instantly available PowerPoint presentation that can be edited conveniently. Download it right away and captivate your audience.
-
 Analytics dashboard for gym health and fitness clubs performance ppt powerpoint presentation pictures
This slide covers the Key performance indicators for analysing social media platforms, email campaigns and website performance Introducing Analytics Dashboard For Gym Health And Fitness Clubs Performance Ppt Powerpoint Presentation Pictures to increase your presentation threshold. Encompassed with seven stages, this template is a great option to educate and entice your audience. Dispence information on Analytics Dashboard For Gym Health And Fitness Clubs , using this template. Grab it now to reap its full benefits.
-
 Dashboard of mobile game analytics by month and hour category powerpoint template
This slide Showcase the Mobile game Analytics. Data covered in this dashboard includes-Month over Month Analysis and Hour over hour analysis, user session and revenue and conversion with average purchase per user. This is Dashboard Of Mobile Game Analytics By Month And Hour Category Powerpoint Template with high quality vector based graphics, that can be edited as per your business needs. You can also reproduce this slide in various formats, be it PNG, JPG, etc. This slide also comes with an additional feature of portrayal on standard and widescreen aspect ratios, thus retaining its high quality.
-
 Analytics dashboard for gym health and fitness clubs health and fitness clubs industry ppt graphics
This slide covers the Key performance indicators for analysing social media platforms, email campaigns and website performance. Introducing Analytics Dashboard For Gym Health And Fitness Clubs Health And Fitness Clubs Industry Ppt Graphics to increase your presentation threshold. Encompassed with seven stages, this template is a great option to educate and entice your audience. Dispence information on Analytics Dashboard For Gym Health And Fitness Clubs, using this template. Grab it now to reap its full benefits.


