Powerpoint Templates and Google slides for Dashboard Analytics
Save Your Time and attract your audience with our fully editable PPT Templates and Slides.
-
 Dashboard Of Marketing Campaign Operational Analytics
This slide showcases the marketing campaign analytics dashboard of an organization. It further includes various elements such as cost per acquisition, total acquisition, total clicks, total impressions, etc.Introducing our Dashboard Of Marketing Campaign Operational Analytics set of slides. The topics discussed in these slides are Cost Per Acquisition, Total Spend, Acquisitions Campaign. This is an immediately available PowerPoint presentation that can be conveniently customized. Download it and convince your audience.
-
 User Analytics Dashboard For Music Streaming Apps
This slide highlights analytical dashboard for music streaming apps to provide valuable insights into user behaviour and interactions. It includes various features such as goal review, listeners and revenue generation.Introducing our User Analytics Dashboard For Music Streaming Apps set of slides. The topics discussed in these slides are User Analytics, Dashboard For Music, Streaming Apps. This is an immediately available PowerPoint presentation that can be conveniently customized. Download it and convince your audience.
-
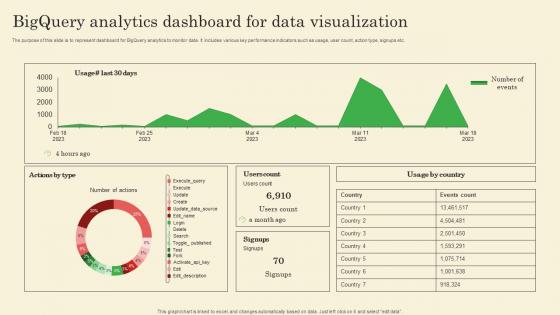 Bigquery Analytics Dashboard For Data Visualization
The purpose of this slide is to represent dashboard for BigQuery analytics to monitor data. It includes various key performance indicators such as usage, user count, action type, signups etc. Introducing our Bigquery Analytics Dashboard For Data Visualization set of slides. The topics discussed in these slides are Users Count, Usage By Country. This is an immediately available PowerPoint presentation that can be conveniently customized. Download it and convince your audience.
-
 Credit Risk Management Dashboard For Banking Analytics
This slide illustrates KPI dashboard for credit risk management to understand creditworthiness and know the capacity of paying back on time. It includes metrics such as denied vs authorized loans by product, approved value per location, etc. Introducing our Credit Risk Management Dashboard For Banking Analytics set of slides. The topics discussed in these slides are Management, Dashboard, Analytics. This is an immediately available PowerPoint presentation that can be conveniently customized. Download it and convince your audience.
-
 Linkedin Analytics Dashboard Using Power Bi
This slide highlights power BI dashboard for LinkedIn analytics. The purpose of this template is to provide businesses with at-a-glance visual feedback for comparing various key performance indicators. It includes elements such as connections, companies, reactions, etc. Introducing our This slide highlights power BI dashboard for LinkedIn analytics. The purpose of this template is to provide businesses with at-a-glance visual feedback for comparing various key performance indicators. It includes elements such as connections, companies, reactions, etc. set of slides. The topics discussed in these slides are Invitation Sent, Reaction, Invitation Received This is an immediately available PowerPoint presentation that can be conveniently customized. Download it and convince your audience.
-
 Linkedin Analytics Kpi Dashboard To Gain Strategic Insights
This slide highlights power BI dashboard for LinkedIn analytics. The purpose of this template is to provide businesses with at-a-glance visual feedback for comparing various key performance indicators. It includes elements such as connections, companies, reactions, etc. Presenting our well structured Linkedin Analytics Kpi Dashboard To Gain Strategic Insights The topics discussed in this slide are This slide highlights power BI dashboard for LinkedIn analytics. The purpose of this template is to provide businesses with at-a-glance visual feedback for comparing various key performance indicators. It includes elements such as connections, companies, reactions, etc. This is an instantly available PowerPoint presentation that can be edited conveniently. Download it right away and captivate your audience.
-
 Linkedin Impressions Analytics Kpi Dashboard
This slide highlights the LinkedIn analytics KPI dashboard. The purpose of this slide is to help businesses in analyzing the performance of their content for reaching with target audience. It includes elements such as followers, click-through rate, engagement, etc. Presenting our well structured Linkedin Impressions Analytics Kpi Dashboard The topics discussed in this slide are Company Industry, Job Function, Job Seniority This is an instantly available PowerPoint presentation that can be edited conveniently. Download it right away and captivate your audience.
-
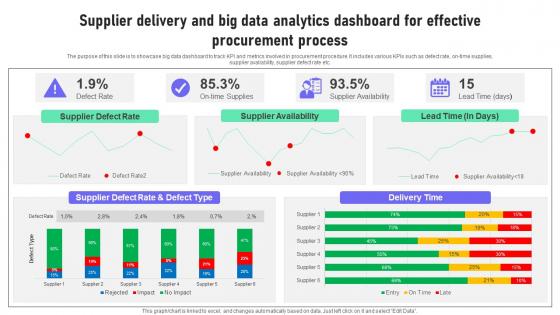 Supplier Delivery And Big Data Analytics Dashboard For Effective Procurement Process
The purpose of this slide is to showcase big data dashboard to track KPI and metrics involved in procurement procedure. It includes various KPIs such as defect rate, on-time supplies, supplier availability, supplier defect rate etc. Presenting our well structured Supplier Delivery And Big Data Analytics Dashboard For Effective Procurement Process. The topics discussed in this slide are Procurement, Process, Dashboard. This is an instantly available PowerPoint presentation that can be edited conveniently. Download it right away and captivate your audience.
-
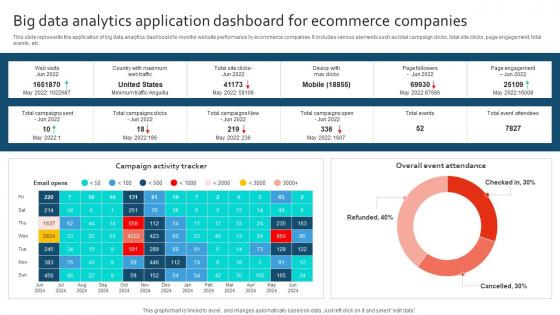 Big Data Analytics Application Dashboard For Ecommerce Companies
This slide represents the application of big data analytics dashboard to monitor website performance by ecommerce companies. It includes various elements such as total campaign clicks, total site clicks, page engagement, total events, etc. Introducing our Big Data Analytics Application Dashboard For Ecommerce Companies set of slides. The topics discussed in these slides are Campaign Activity Tracker, Ecommerce Companies. This is an immediately available PowerPoint presentation that can be conveniently customized. Download it and convince your audience.
-
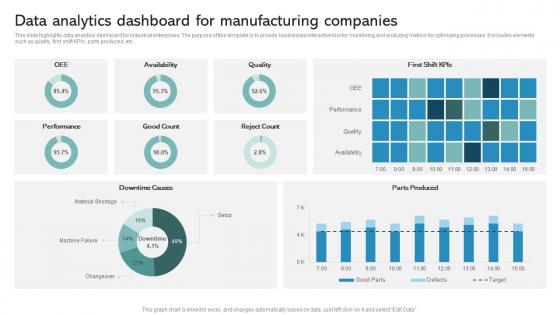 Data Analytics Dashboard For Manufacturing Companies
This slide highlights data analytics dashboard for industrial enterprises. The purpose of this template is to provide businesses interactive tool for monitoring and analyzing metrics for optimizing processes. It includes elements such as quality, first shift KPIs, parts produced, etc. Introducing our Data Analytics Dashboard For Manufacturing Companies set of slides. The topics discussed in these slides are Performance, Good Count, Reject Count, Availability, Quality. This is an immediately available PowerPoint presentation that can be conveniently customized. Download it and convince your audience.
-
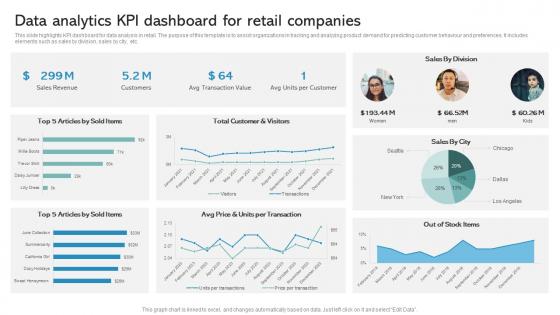 Data Analytics KPI Dashboard For Retail Companies
This slide highlights KPI dashboard for data analysis in retail. The purpose of this template is to assist organizations in tracking and analyzing product demand for predicting customer behaviour and preferences. It includes elements such as sales by division, sales by city, etc. Presenting our well structured Data Analytics KPI Dashboard For Retail Companies. The topics discussed in this slide are Total Customer And Visitors, Units Per Transaction, Articles By Sold Items. This is an instantly available PowerPoint presentation that can be edited conveniently. Download it right away and captivate your audience.
-
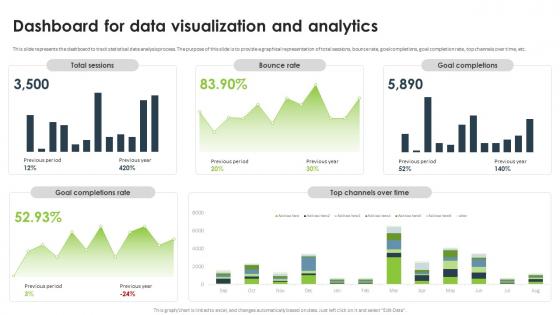 Statistical Analysis For Data Driven Dashboard For Data Visualization And Analytics
This slide represents the dashboard to track statistical data analysis process. The purpose of this slide is to provide a graphical representation of total sessions, bounce rate, goal completions, goal completion rate, top channels over time, etc. Present the topic in a bit more detail with this Statistical Analysis For Data Driven Dashboard For Data Visualization And Analytics. Use it as a tool for discussion and navigation on Data Visualization And Analytics, Bounce Rate, Goal Completions, Goal Completion Rate. This template is free to edit as deemed fit for your organization. Therefore download it now.
-
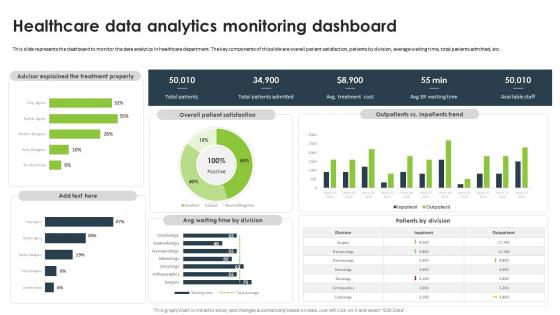 Statistical Analysis For Data Driven Healthcare Data Analytics Monitoring Dashboard
This slide represents the dashboard to monitor the data analytics in healthcare department. The key components of this slide are overall patient satisfaction, patients by division, average waiting time, total patients admitted, etc. Present the topic in a bit more detail with this Statistical Analysis For Data Driven Healthcare Data Analytics Monitoring Dashboard. Use it as a tool for discussion and navigation on Healthcare Data Analytics, Monitoring Dashboard, Healthcare Department. This template is free to edit as deemed fit for your organization. Therefore download it now.
-
 Digital Marketing Analytics Dashboard For E Commerce Brands
This slide displays dashboard for digital marketing analytics that helps to track campaign performance. It evaluates on the basis of KPIs such as conversion rate, cost per conversion, cost per click, etc. Presenting our well structured Digital Marketing Analytics Dashboard For E Commerce Brands The topics discussed in this slide are Digital Marketing, Analytics Dashboard, E Commerce Brands This is an instantly available PowerPoint presentation that can be edited conveniently. Download it right away and captivate your audience.
-
 Transforming From Traditional Dashboard Analytics Business Model Innovation Impact On Customer DT SS
This slide represents an analytics dashboard for measuring impact on customer satisfaction due to adoption of new digital business model. It tracks KPIS such as net promoter score, customer retention and customer effort score. Present the topic in a bit more detail with this Transforming From Traditional Dashboard Analytics Business Model Innovation Impact On Customer DT SS Use it as a tool for discussion and navigation on Net Promoter Score, Customer Retention, Customer Effort Score This template is free to edit as deemed fit for your organization. Therefore download it now.
-
 Transforming From Traditional Dashboard Analytics Measuring Impact On User Metrics And Revenue DT SS
This slide analyzes the impact od digital business model innovation on user metrics and recurring revenue of business. It tracks KPIs such as monthly recurring revenue, revenue growth, active users, life time value, cost of customer acquisition, churn rate, growth by channel, subscription plan, etc. Present the topic in a bit more detail with this Transforming From Traditional Dashboard Analytics Measuring Impact On User Metrics And Revenue DT SS Use it as a tool for discussion and navigation on Monthly Recurring Revenue, Monthly Revenue Growth, Active Users This template is free to edit as deemed fit for your organization. Therefore download it now.
-
 Social Media Analytics With Tools Dashboards For Social Media Analytics Tracking And Monitoring
This slide depicts the dashboard for Social Media Analytics insights. The purpose of this slide is to highlight insights such as brand awareness, audience growth, post-engagement rate, provider analytics, etc. Present the topic in a bit more detail with this Social Media Analytics With Tools Dashboards For Social Media Analytics Tracking And Monitoring. Use it as a tool for discussion and navigation on Dashboards For Social Media, Analytics Tracking And Monitoring, Brand Awareness, Audience Growth, Post Engagement Rate. This template is free to edit as deemed fit for your organization. Therefore download it now.
-
 Dashboard Analytics Measuring Supply Chain Efficiency Digital Transformation Of Retail DT SS
This slide represents a supply chain management dashboard measuring the efficiency of supply chain operations after effective digital transformation of retail operations. It includes inventory to sales, inventory turnover, carrying cost of inventory, inventory accuracy, and percentage out of stock items. Deliver an outstanding presentation on the topic using this Dashboard Analytics Measuring Supply Chain Efficiency Digital Transformation Of Retail DT SS Dispense information and present a thorough explanation of Dashboard Analytics, Carrying Cost Of Inventory, Supply Chain Efficiency using the slides given. This template can be altered and personalized to fit your needs. It is also available for immediate download. So grab it now.
-
 Dashboard Analytics Monitoring Retail Store Performance Digital Transformation Of Retail DT SS
This slide represents a retail KPI dashboard measuring the performance of retail store. It tracks KPIs such as sales revenue, customers, average transaction price, average units per customer, top five articles by sold items, total customers and visitors, collections by revenue , average price and units per transaction, etc. Present the topic in a bit more detail with this Dashboard Analytics Monitoring Retail Store Performance Digital Transformation Of Retail DT SS Use it as a tool for discussion and navigation on Sales Revenue, Customers, Transaction Price This template is free to edit as deemed fit for your organization. Therefore download it now.
-
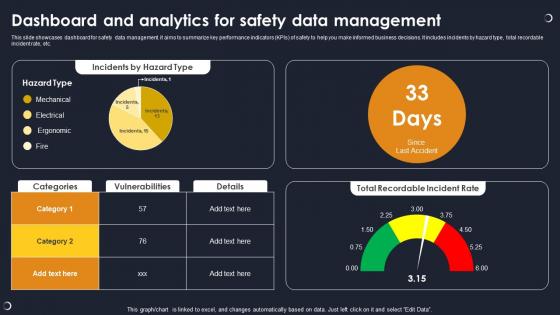 Dashboard And Analytics For Safety Data Management
This slide showcases dashboard for safety data management. it aims to summarize key performance indicators KPIs of safety to help you make informed business decisions. It includes incidents by hazard type, total recordable incident rate, etc. Presenting our well structured Dashboard And Analytics For Safety Data Management. The topics discussed in this slide are Incidents By Hazard Type, Vulnerabilities, Total Recordable Incident Rate. This is an instantly available PowerPoint presentation that can be edited conveniently. Download it right away and captivate your audience.
-
 Healthcare Analytics Dashboard Using Iot How Iomt Is Transforming Medical Industry IoT SS V
Following slide exhibits dashboard that provides health care data after deployment of internet of things IoT technology. It includes indicators such as patient satisfaction, total patients, average waiting time etc. Deliver an outstanding presentation on the topic using this Healthcare Analytics Dashboard Using Iot How Iomt Is Transforming Medical Industry IoT SS V. Dispense information and present a thorough explanation of Healthcare, Analytics, Dashboard using the slides given. This template can be altered and personalized to fit your needs. It is also available for immediate download. So grab it now.
-
 Healthcare Analytics Dashboard Using IoT Technology Guide To Networks For IoT Healthcare IoT SS V
Following slide exhibits dashboard that provides health care data after deployment of internet of things IoT technology. It includes indicators such as patient satisfaction, total patients, average waiting time etc. Present the topic in a bit more detail with this Healthcare Analytics Dashboard Using IoT Technology Guide To Networks For IoT Healthcare IoT SS V. Use it as a tool for discussion and navigation on Healthcare Analytics, Dashboard Using Iot Technology. This template is free to edit as deemed fit for your organization. Therefore download it now.
-
 Dashboard Measuring Key Partner Analytics And Performance Nurturing Relationships
This slide analyzes a dashboard examining various partner pipeline metrics. It tracks KPIs such as, partner opportunity pipeline, leads, demo units, co-brand requests, market development funds requests and budget, new partners, open pipeline, certified partners, e-learnings. Deliver an outstanding presentation on the topic using this Dashboard Measuring Key Partner Analytics And Performance Nurturing Relationships Dispense information and present a thorough explanation of Opportunities, Certified Partners, Performance Indicators using the slides given. This template can be altered and personalized to fit your needs. It is also available for immediate download. So grab it now.
-
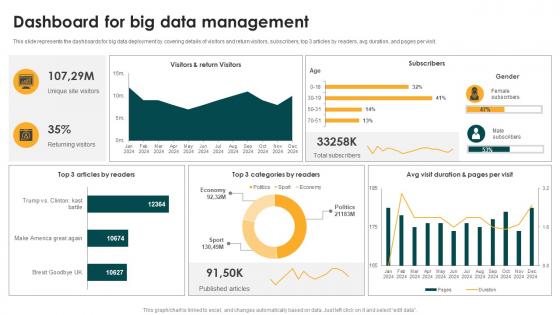 Dashboard For Big Data Management Big Data Analytics And Management
This slide represents the dashboards for big data deployment by covering details of visitors and return visitors, subscribers, top 3 articles by readers, avg duration, and pages per visit. Present the topic in a bit more detail with this Dashboard For Big Data Management Big Data Analytics And Management. Use it as a tool for discussion and navigation on Dashboard For Big Data Management. This template is free to edit as deemed fit for your organization. Therefore download it now.
-
 Saas Software Dashboard For Providing Customer Analytics Insight
This slide illustrates SaaS analytics software KPI dashboard for offering users with real time data insights, facilitating informed decision making. It includes metrics such as engagement frequency, user category visit rate, interaction length, content provider, etc. Presenting our well structured Saas Software Dashboard For Providing Customer Analytics Insight The topics discussed in this slide are Engagement Frequency, Saas Software, Analytics Insight This is an instantly available PowerPoint presentation that can be edited conveniently. Download it right away and captivate your audience.
-
 Healthcare Analytics Dashboard Using IoT Technology IoMT Applications In Medical Industry IoT SS V
Following slide exhibits dashboard that provides health care data after deployment of internet of things IoT technology. It includes indicators such as patient satisfaction, total patients, average waiting time etc. Deliver an outstanding presentation on the topic using this Healthcare Analytics Dashboard Using IoT Technology IoMT Applications In Medical Industry IoT SS V. Dispense information and present a thorough explanation of Overall Patient Satisfaction, Patients By Division using the slides given. This template can be altered and personalized to fit your needs. It is also available for immediate download. So grab it now.
-
 Dashboard Analytics Measuring Digital Elevating Small And Medium Enterprises Digital Transformation DT SS
This slide presents dashboard that helps in tracking digital vitality score highlighting the success of digital transformation across organization. It tracks KPIs such as strategy, data, organizational alignment and customer experience. Deliver an outstanding presentation on the topic using this Dashboard Analytics Measuring Digital Elevating Small And Medium Enterprises Digital Transformation DT SS. Dispense information and present a thorough explanation of Organizational Alignment, Customer Experience, Dashboard Analytics using the slides given. This template can be altered and personalized to fit your needs. It is also available for immediate download. So grab it now.
-
 Dashboard Analytics Measuring Impact Elevating Small And Medium Enterprises Digital Transformation DT SS
This slide presents an analytics dashboard monitoring the efficiency gained due to integration of RPA in SME. It tracks, money saved, time saved, productivity, money saved per process, etc. Present the topic in a bit more detail with this Dashboard Analytics Measuring Impact Elevating Small And Medium Enterprises Digital Transformation DT SS. Use it as a tool for discussion and navigation on Tax Management, Termination, Travel And Expense. This template is free to edit as deemed fit for your organization. Therefore download it now.
-
 Robotic Process Analytics Dashboard For Automation
This slide illustrates KPI dashboard of robotics process by providing insights into performance and effectiveness of automated robots. It includes metrics such as robot running time, monthly workforce savings, monthly operational cost, etc. Introducing our Robotic Process Analytics Dashboard For Automation set of slides. The topics discussed in these slides are Robot Running Time, Investment Performance. This is an immediately available PowerPoint presentation that can be conveniently customized. Download it and convince your audience.
-
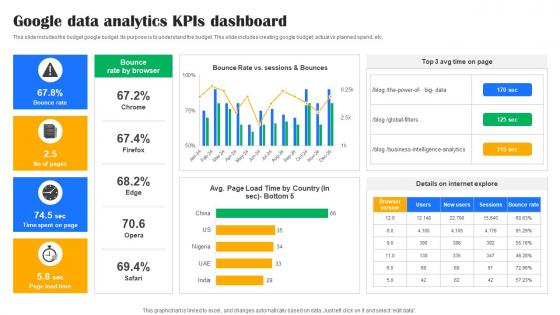 Google Data Analytics KPIS Dashboard
This slide includes the budget google budget. Its purpose is to understand the budget. This slide includes creating google budget, actual vs planned spend, etc. Introducing our Google Data Analytics KPIS Dashboard set of slides. The topics discussed in these slides are Data Analytics, KPIS Dashboard This is an immediately available PowerPoint presentation that can be conveniently customized. Download it and convince your audience.
-
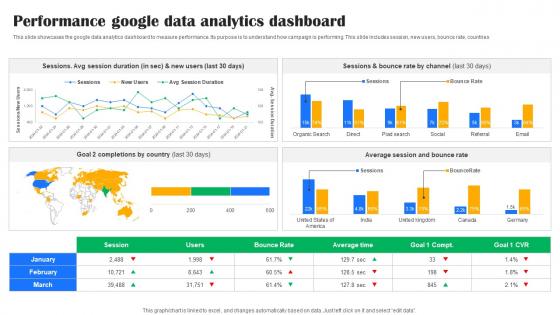 Performance Google Data Analytics Dashboard
This slide showcases the google data analytics dashboard to measure performance. Its purpose is to understand how campaign is performing. This slide includes session, new users, bounce rate, countries. Introducing our Performance Google Data Analytics Dashboard set of slides. The topics discussed in these slides are Performance, Google Data Analytics, Dashboard This is an immediately available PowerPoint presentation that can be conveniently customized. Download it and convince your audience.
-
 Implementing Big Data Analytics Effective Supplier Performance Assessment Dashboard CRP DK SS
This slide showcases dashboard for analyzing supplier performance with KPIs such as defect rate, on time supplies, average procurement cycle, delivery time etc. Deliver an outstanding presentation on the topic using this Implementing Big Data Analytics Effective Supplier Performance Assessment Dashboard CRP DK SS. Dispense information and present a thorough explanation of Analyzing Supplier Performance, Average Procurement Cycle, Assessment Dashboard using the slides given. This template can be altered and personalized to fit your needs. It is also available for immediate download. So grab it now.
-
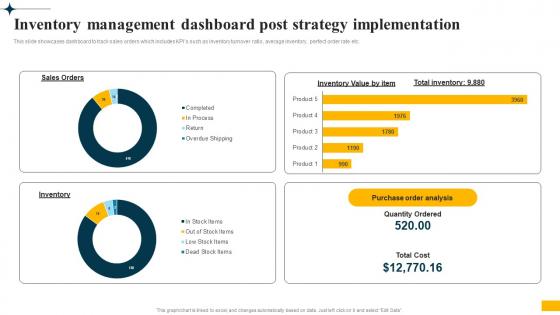 Implementing Big Data Analytics Inventory Management Dashboard Post Strategy Implementation CRP DK SS
This slide showcases dashboard to track sales orders which includes KPIs such as inventory turnover ratio, average inventory, perfect order rate etc. Deliver an outstanding presentation on the topic using this Implementing Big Data Analytics Inventory Management Dashboard Post Strategy Implementation CRP DK SS. Dispense information and present a thorough explanation of Inventory Management Dashboard, Post Strategy Implementation, Dashboard To Track Sales using the slides given. This template can be altered and personalized to fit your needs. It is also available for immediate download. So grab it now.
-
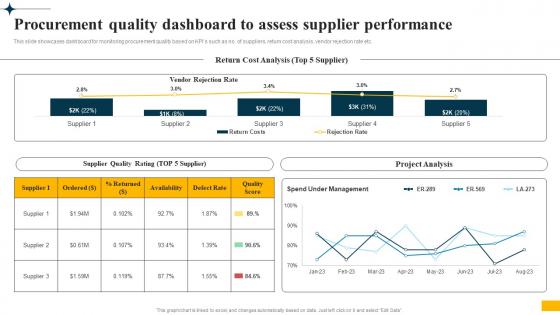 Implementing Big Data Analytics Procurement Quality Dashboard To Assess Supplier Performance CRP DK SS
This slide showcases dashboard for monitoring procurement quality based on KPIs such as no. of suppliers, return cost analysis, vendor rejection rate etc. Present the topic in a bit more detail with this Implementing Big Data Analytics Procurement Quality Dashboard To Assess Supplier Performance CRP DK SS. Use it as a tool for discussion and navigation on Procurement Quality Dashboard, Assess Supplier Performance, Vendor Rejection Rate. This template is free to edit as deemed fit for your organization. Therefore download it now.
-
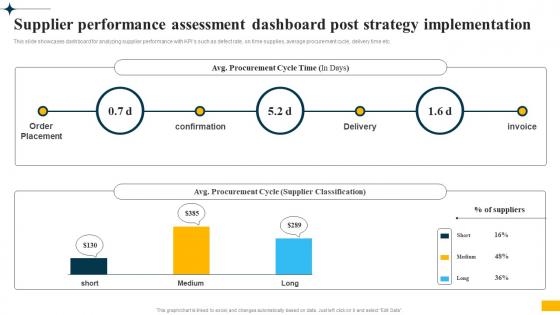 Implementing Big Data Analytics Supplier Performance Assessment Dashboard Post Strategy CRP DK SS
This slide showcases dashboard for analyzing supplier performance with KPIs such as defect rate, on time supplies, average procurement cycle, delivery time etc. Deliver an outstanding presentation on the topic using this Implementing Big Data Analytics Supplier Performance Assessment Dashboard Post Strategy CRP DK SS. Dispense information and present a thorough explanation of Supplier Performance Assessment, Dashboard Post, Strategy Implementation, Average Procurement Cycle using the slides given. This template can be altered and personalized to fit your needs. It is also available for immediate download. So grab it now.
-
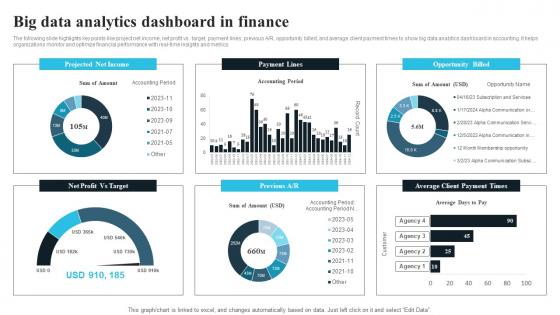 Big Data Analytics Dashboard In Finance
The following slide highlights key points like project net income, net profit vs. target, payment lines, previous AR, opportunity billed, and average client payment times to show big data analytics dashboard in accounting. It helps organizations monitor and optimize financial performance with real-time insights and metrics. Introducing our Big Data Analytics Dashboard In Finance set of slides. The topics discussed in these slides are Projected Net Income, Opportunity Billed. This is an immediately available PowerPoint presentation that can be conveniently customized. Download it and convince your audience.
-
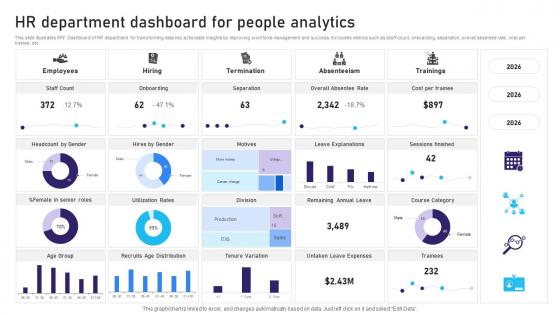 HR Department Dashboard For People Analytics
This slide illustrates KPI Dashboard of HR department for transforming data into actionable insights by improving workforce management and success. It includes metrics such as staff count, onboarding, separation, overall absentee rate, cost per trainee, etc. Introducing our HR Department Dashboard For People Analytics set of slides. The topics discussed in these slides are Employees, Hiring, Termination. This is an immediately available PowerPoint presentation that can be conveniently customized. Download it and convince your audience.
-
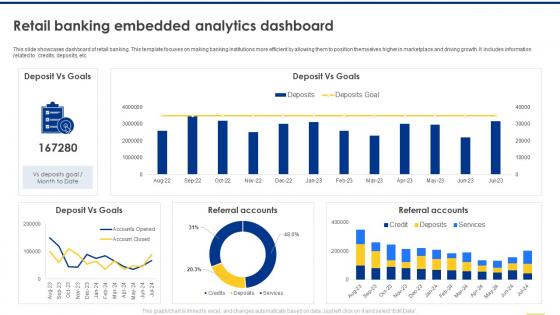 Navigating The Banking Industry Retail Banking Embedded Analytics Dashboard
This slide showcases dashboard of retail banking. This template focuses on making banking institutions more efficient by allowing them to position themselves higher in marketplace and driving growth. It includes information related to credits, deposits, etc. Present the topic in a bit more detail with this Navigating The Banking Industry Retail Banking Embedded Analytics Dashboard. Use it as a tool for discussion and navigation on Dashboard Of Retail Banking, Making Banking Institutions, Driving Growth, Analytics Dashboard. This template is free to edit as deemed fit for your organization. Therefore download it now.
-
 Big Data Analytics Dashboard For Electric Energy Sector Industries
This slide represents the dashboard of big data analytics providing key insights to enhance energy sector efficiency. It includes various KPIs such as total consumption, power cuts, etc. Introducing our Big Data Analytics Dashboard For Electric Energy Sector Industries set of slides. The topics discussed in these slides are Big Data Analytics Dashboard, Electric Energy Sector Industries. This is an immediately available PowerPoint presentation that can be conveniently customized. Download it and convince your audience.
-
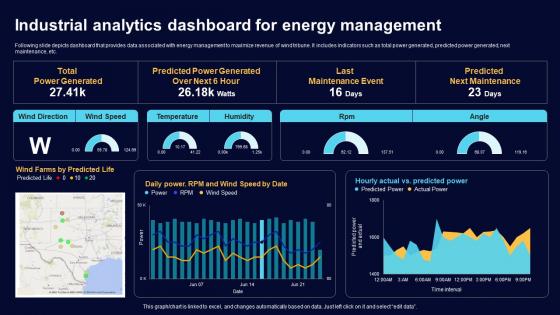 Industrial Analytics Dashboard For Energy Comprehensive Guide For Big Data IoT SS
Following slide depicts dashboard that provides data associated with energy management to maximize revenue of wind tribune. It includes indicators such as total power generated, predicted power generated, next maintenance, etc.Present the topic in a bit more detail with this Industrial Analytics Dashboard For Energy Comprehensive Guide For Big Data IoT SS. Use it as a tool for discussion and navigation on Power Generated, Predicted Power, Maintenance Event. This template is free to edit as deemed fit for your organization. Therefore download it now.
-
 IoT Big Data Analytics Dashboard For Manufacturing Comprehensive Guide For Big Data IoT SS
Following slide depicts dashboard that provides real time data about manufacturing industry operations and production. It includes metrics such as productivity, units cost, operators available by function, etc.Present the topic in a bit more detail with this IoT Big Data Analytics Dashboard For Manufacturing Comprehensive Guide For Big Data IoT SS. Use it as a tool for discussion and navigation on Understand Customer, Improve Customer Engagement, Customer Personalized. This template is free to edit as deemed fit for your organization. Therefore download it now.
-
 Big Data Analytics Dashboard To Track Retail Big Data Analytics Applications Data Analytics SS
This slide showcases dashboard for monitoring retail business performance which helps in improving revenue generation. It provides information regarding KPIs such as gross margin, sales, card abandonment rate, average unit price etc. Present the topic in a bit more detail with this Big Data Analytics Dashboard To Track Retail Big Data Analytics Applications Data Analytics SS. Use it as a tool for discussion and navigation on Cart Abandonment Rate, Average Transactions. This template is free to edit as deemed fit for your organization. Therefore download it now.
-
 Data Analytics Dashboard To Track Hospital Big Data Analytics Applications Data Analytics SS
This slide showcases dashboard for tracking hospitals activities which helps in improving performance efficiency. It provides information regarding bed occupancy rate, patient satisfaction rate, staff to patient ratio, room turnover etc. Present the topic in a bit more detail with this Data Analytics Dashboard To Track Hospital Big Data Analytics Applications Data Analytics SS. Use it as a tool for discussion and navigation on Bed Occupancy Rates, Equipment Utilization Rate. This template is free to edit as deemed fit for your organization. Therefore download it now.
-
 Analytics Dashboard Measuring Impact On Power Production Enabling Growth Centric DT SS
This slide represents an analytics dashboard for effective energy monitoring and management. It tracks KPIs such as energy production, solar energy production, savings, energy produced, carbon savings, and financial savings. Present the topic in a bit more detail with this Analytics Dashboard Measuring Impact On Power Production Enabling Growth Centric DT SS Use it as a tool for discussion and navigation on System Frequency, Ambient Temperature, Relative Humidity This template is free to edit as deemed fit for your organization. Therefore download it now.
-
 Analytics Dashboard Tracking Effective Energy Monitoring And Enabling Growth Centric DT SS
This slide presents how power companies can utilize analytics-driven insights for monitoring equipment health and performance. It includes predictive analytics, anomaly detection, trend analysis, and prescriptive analytics. Deliver an outstanding presentation on the topic using this Analytics Dashboard Tracking Effective Energy Monitoring And Enabling Growth Centric DT SS Dispense information and present a thorough explanation of Solar Energy, Carbon Savings, Financial Savings using the slides given. This template can be altered and personalized to fit your needs. It is also available for immediate download. So grab it now.
-
 Telecom Industry Consumer Service Analytical Dashboard
This slide depicts assessment of customer service provided by telecom company to analyze customer satisfaction ratings, subscription details, and support statuses. It includes complain by status, retention rate, churn rate, repurchase rate etc. Presenting our well structured Telecom Industry Consumer Service Analytical Dashboard. The topics discussed in this slide are Customer, Repurchasing, Analytical. This is an instantly available PowerPoint presentation that can be edited conveniently. Download it right away and captivate your audience.
-
 Power Sector Analytical Dashboard Showing Digital Transformation Impact
This slide depicts dashboard showcasing impact of digital transformation on power sector to analyse energy saving and performance growth of companies. It involves parameters such as production distribution, energy saving growth chart, performance ratio etc. Introducing our Power Sector Analytical Dashboard Showing Digital Transformation Impact set of slides. The topics discussed in these slides are Analytical, Digital, Transformation. This is an immediately available PowerPoint presentation that can be conveniently customized. Download it and convince your audience.
-
 Fulfillment Center Optimization Warehouse Fleet And Transportation Performance Analytics Dashboard
This slide represents a warehouse fleet and transportation management dashboard to visualize and optimize logistics operations through advanced data analyses. It monitors KPIs such as fleet status, delivery status, deliveries by location, average delivery time hours0 And route Km, loading time And weight, and profit by location. Deliver an outstanding presentation on the topic using this Fulfillment Center Optimization Warehouse Fleet And Transportation Performance Analytics Dashboard Dispense information and present a thorough explanation of Course Topics, Course Duration, Course Description using the slides given. This template can be altered and personalized to fit your needs. It is also available for immediate download. So grab it now.
-
 Digital Marketing Campaign Performance Analytics Dashboard
This slide depicts analysis of marketing campaign performance analytics for measuring customer involvement with campaign. It includes parameters such as visitors, leads, total revenue, bounce rate, customer churn rate, order value, customer life time value etc. Presenting our well structured Digital Marketing Campaign Performance Analytics Dashboard. The topics discussed in this slide are Annual Recurring Revenue, Customer Lifetime Value, Completed Transactions. This is an instantly available PowerPoint presentation that can be edited conveniently. Download it right away and captivate your audience.
-
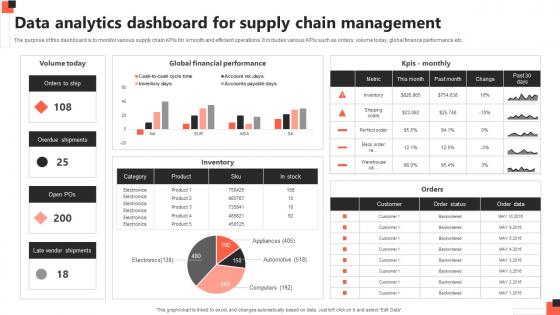 Data Analytics Dashboard For Supply Chain Management
The purpose of this dashboard is to monitor various supply chain KPIs for smooth and efficient operations. It includes various KPIs such as orders, volume today, global finance performance etc. Introducing our Data Analytics Dashboard For Supply Chain Management set of slides. The topics discussed in these slides are Volume Today, Global Financial Performance, Inventory. This is an immediately available PowerPoint presentation that can be conveniently customized. Download it and convince your audience.
-
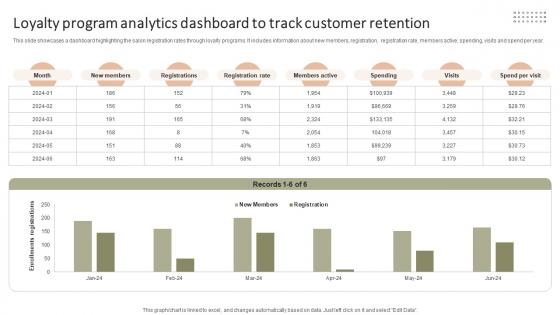 Loyalty Program Analytics Dashboard To Improving Client Experience And Sales Strategy SS V
This slide showcases a dashboard highlighting the salon registration rates through loyalty programs. It includes information about new members, registration, registration rate, members active, spending, visits and spend per year. Present the topic in a bit more detail with this Loyalty Program Analytics Dashboard To Improving Client Experience And Sales Strategy SS V. Use it as a tool for discussion and navigation on Registration Rate, Members Active, Registrations. This template is free to edit as deemed fit for your organization. Therefore download it now.
-
 Implementing Workforce Analytics Dashboard For Assessing Workforce Efficiency Post Data Analytics SS
This slide showcases dashboard illustrating workforce performance efficiency which helps in in tracking employee productivity levels in business. It provides information regarding corporate performance, employee productivity, project achievement, overtime hours, overall labor effectiveness etc. Deliver an outstanding presentation on the topic using this Implementing Workforce Analytics Dashboard For Assessing Workforce Efficiency Post Data Analytics SS. Dispense information and present a thorough explanation of Dashboard For Assessing Workforce, Post Strategy Implementation, Employee Productivity, Project Achievement using the slides given. This template can be altered and personalized to fit your needs. It is also available for immediate download. So grab it now.
-
 Implementing Workforce Analytics Dashboard To Monitor Employee Performance Post Data Analytics SS
This slide represents dashboard for tracking employee productivity post workload management which helps in assessing workforce activity schedule to optimize performance. It provides information regarding KPI metrics such as working times, projects, tracked time, productivity growth, overall employee effectiveness. Present the topic in a bit more detail with this Implementing Workforce Analytics Dashboard To Monitor Employee Performance Post Data Analytics SS. Use it as a tool for discussion and navigation on Dashboard To Monitor, Employee Performance, Post Workload Management, Tracked Time, Productivity Growth. This template is free to edit as deemed fit for your organization. Therefore download it now.
-
 Implementing Workforce Analytics Employee Engagement Dashboard Post Strategy Data Analytics SS
This slide showcases dashboard for tracking employee engagement post deployment of improvement strategies. It provides information regarding KPI metrics such as engagement, burnout risk, turnover risk, satisfaction, professional growth, alignment, autonomy and organization support. Deliver an outstanding presentation on the topic using this Implementing Workforce Analytics Employee Engagement Dashboard Post Strategy Data Analytics SS. Dispense information and present a thorough explanation of Employee Engagement Dashboard, Post Strategy Implementation, Professional Growth, Alignment using the slides given. This template can be altered and personalized to fit your needs. It is also available for immediate download. So grab it now.
-
 Pinterest Affiliate Marketing Analytics Kpi Dashboard
This slide represents pinterest affiliate marketing KPI dashboard which assists to diversify revenue and drive conversion for products. It includes key components such as total impressions, total audience reach, etc Presenting our well structured Pinterest Affiliate Marketing Analytics Kpi Dashboard The topics discussed in this slide are Impressions, Total Audience, Engagement. This is an instantly available PowerPoint presentation that can be edited conveniently. Download it right away and captivate your audience.
-
 Supplier Risk Management Analytical Dashboard
This slide illustrates supplier risk management KPI or dashboard and includes suppliers, new suppliers, surveys conducted, overdue measures, etc. Presenting our well structured Supplier Risk Management Analytical Dashboard The topics discussed in this slide are New Suppliers, Surveys Conducted, Overdue Measures. This is an instantly available PowerPoint presentation that can be edited conveniently. Download it right away and captivate your audience.
-
 Healthcare Analytics Dashboard Using IoT Technology Comprehensive Guide To Networks IoT SS
Following slide exhibits dashboard that provides health care data after deployment of internet of things IoT technology. It includes indicators such as patient satisfaction, total patients, average waiting time etc. Present the topic in a bit more detail with this Healthcare Analytics Dashboard Using IoT Technology Comprehensive Guide To Networks IoT SS. Use it as a tool for discussion and navigation on Healthcare Analytics, Dashboard Using IoT Technology, Patient Satisfaction. This template is free to edit as deemed fit for your organization. Therefore download it now.
-
 Big Data Analytics Dashboard To Track Retail Performance Data Driven Insights Big Data Analytics SS V
This slide showcases dashboard for monitoring retail business performance which helps in improving revenue generation. It provides information regarding KPIs such as gross margin, sales, card abandonment rate, average unit price etc. Present the topic in a bit more detail with this Big Data Analytics Dashboard To Track Retail Performance Data Driven Insights Big Data Analytics SS V Use it as a tool for discussion and navigation on Big Data Analytics Dashboard, Track Retail Performance This template is free to edit as deemed fit for your organization. Therefore download it now.
-
 Data Analytics Dashboard To Track Hospital Performance Data Driven Insights Big Data Analytics SS V
This slide showcases dashboard for tracking hospitals activities which helps in improving performance efficiency. It provides information regarding bed occupancy rate, patient satisfaction rate, staff to patient ratio, room turnover etc. Deliver an outstanding presentation on the topic using this Data Analytics Dashboard To Track Hospital Performance Data Driven Insights Big Data Analytics SS V Dispense information and present a thorough explanation of Bed Occupancy Rates, Efficiency Costs, Satisfaction Service Indicators using the slides given. This template can be altered and personalized to fit your needs. It is also available for immediate download. So grab it now.
-
 Generating Channel Analytics Dashboard Using Youtube Automation Tools
This slide represents YouTube channel analytics dashboard using automation tools to assist companies in analyzing video performance and subscribers behavior. It includes various components such as gained and lost subscribers, top performing video, etc. Introducing our Generating Channel Analytics Dashboard Using Youtube Automation Tools set of slides. The topics discussed in these slides are Analytics, Automation, Dashboard. This is an immediately available PowerPoint presentation that can be conveniently customized. Download it and convince your audience.


