Powerpoint Templates and Google slides for Dashboard Analytics
Save Your Time and attract your audience with our fully editable PPT Templates and Slides.
-
 Google Analytics Tool To Create Custom Dashboards Edu Ppt
Presenting Google Analytics Tool to Create Custom Dashboards. This slide is well crafted and designed by our PowerPoint experts. This PPT presentation is thoroughly researched by the experts and every slide consists of an appropriate content. You can add or delete the content as per your need.
-
 Big Data Governance Challenges Roadmap Processes Strategy Analytics Dashboard
This complete deck can be used to present to your team. It has PPT slides on various topics highlighting all the core areas of your business needs. This complete deck focuses on Big Data Governance Challenges Roadmap Processes Strategy Analytics Dashboard and has professionally designed templates with suitable visuals and appropriate content. This deck consists of total of thirteen slides. All the slides are completely customizable for your convenience. You can change the colour, text and font size of these templates. You can add or delete the content if needed. Get access to this professionally designed complete presentation by clicking the download button below.
-
 Loyalty Program Advantages Analytic Dashboard Successful Engagement Model
It has PPT slides covering wide range of topics showcasing all the core areas of your business needs. This complete deck focuses on Loyalty Program Advantages Analytic Dashboard Successful Engagement Model and consists of professionally designed templates with suitable graphics and appropriate content. This deck has total of twelve slides. Our designers have created customizable templates for your convenience. You can make the required changes in the templates like colour, text and font size. Other than this, content can be added or deleted from the slide as per the requirement. Get access to this professionally designed complete deck PPT presentation by clicking the download button below.
-
 Data Analytic Icon Business Growth Analysis Gear Magnifying Glass Dashboard
This complete deck can be used to present to your team. It has PPT slides on various topics highlighting all the core areas of your business needs. This complete deck focuses on Data Analytic Icon Business Growth Analysis Gear Magnifying Glass Dashboard and has professionally designed templates with suitable visuals and appropriate content. This deck consists of total of twelve slides. All the slides are completely customizable for your convenience. You can change the colour, text and font size of these templates. You can add or delete the content if needed. Get access to this professionally designed complete presentation by clicking the download button below.
-
 Data Business Analytics Dollar Storage Marketing Dashboard Customers
If you require a professional template with great design, then this Data Business Analytics Dollar Storage Marketing Dashboard Customers is an ideal fit for you. Deploy it to enthrall your audience and increase your presentation threshold with the right graphics, images, and structure. Portray your ideas and vision using twelve slides included in this complete deck. This template is suitable for expert discussion meetings presenting your views on the topic. With a variety of slides having the same thematic representation, this template can be regarded as a complete package. It employs some of the best design practices, so everything is well-structured. Not only this, it responds to all your needs and requirements by quickly adapting itself to the changes you make. This PPT slideshow is available for immediate download in PNG, JPG, and PDF formats, further enhancing its usability. Grab it by clicking the download button.
-
 Sales force effectiveness businesses analytics customer segmentation performance dashboard
Engage buyer personas and boost brand awareness by pitching yourself using this prefabricated set. This Sales Force Effectiveness Businesses Analytics Customer Segmentation Performance Dashboard is a great tool to connect with your audience as it contains high-quality content and graphics. This helps in conveying your thoughts in a well-structured manner. It also helps you attain a competitive advantage because of its unique design and aesthetics. In addition to this, you can use this PPT design to portray information and educate your audience on various topics. With twelve slides, this is a great design to use for your upcoming presentations. Not only is it cost-effective but also easily pliable depending on your needs and requirements. As such color, font, or any other design component can be altered. It is also available for immediate download in different formats such as PNG, JPG, etc. So, without any further ado, download it now.
-
 Advanced Data Analytics Dashboard For Search Engine
This slide depicts the advanced data analytics dashboard for search engine. The purpose of this template is to help the investor determine the efficiency of search engine through the study of various indicators such as number of sessions, bounce rate, average time per session, etc.Presenting our well structured Advanced Data Analytics Dashboard For Search Engine. The topics discussed in this slide are Communication Channel, Organic Search, Organic Search. This is an instantly available PowerPoint presentation that can be edited conveniently. Download it right away and captivate your audience.
-
 Analytics Dashboard For CRM Strategy Evaluation
This slide highlights the various metrics to be measured for evaluating CRM strategy. The purpose of this template is to help the CRM manager identify improvements and assess tactical success.Presenting our well structured Analytics Dashboard For CRM Strategy Evaluation. The topics discussed in this slide are Under Management, Total Revenue, Assets Outflow. This is an instantly available PowerPoint presentation that can be edited conveniently. Download it right away and captivate your audience.
-
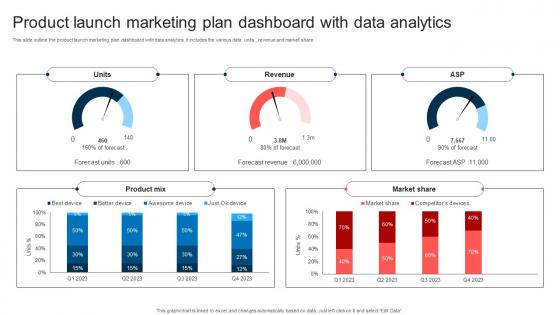 Product Launch Marketing Plan Dashboard With Data Analytics
This slide outline the product launch marketing plan dashboard with data analytics. It includes the various data units , revenue and market share Introducing our Product Launch Marketing Plan Dashboard With Data Analytics set of slides. The topics discussed in these slides are Marketing, Dashboard, Analytics. This is an immediately available PowerPoint presentation that can be conveniently customized. Download it and convince your audience.
-
 Marketing Analytics Dashboard To Evaluate Social Media Innovative Marketing Strategies For Tech Strategy SS V
The following slide showcases performance key performance indicator KPI dashboard through which marketing team can measure social media campaign performance. The KPIs highlighted are YouTube channel views, Facebook daily reach, LinkedIn clicks and likes, etc. Present the topic in a bit more detail with this Marketing Analytics Dashboard To Evaluate Social Media Innovative Marketing Strategies For Tech Strategy SS V. Use it as a tool for discussion and navigation on Facebook Daily, Linkedin Clicks And Likes. This template is free to edit as deemed fit for your organization. Therefore download it now.
-
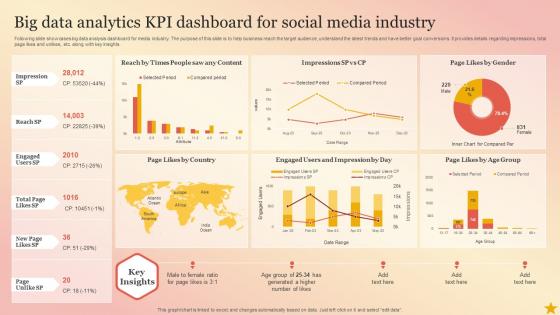 Big Data Analytics Kpi Dashboard For Social Media Industry
Following slide showcases big data analysis dashboard for media industry. The purpose of this slide is to help business reach the target audience, understand the latest trends and have better goal conversions. It provides details regarding impressions, total page likes and unlikes, etc. along with key insights. Introducing our Big Data Analytics Kpi Dashboard For Social Media Industry set of slides. The topics discussed in these slides are Page Likes By Gender, Page Likes By Country. This is an immediately available PowerPoint presentation that can be conveniently customized. Download it and convince your audience.
-
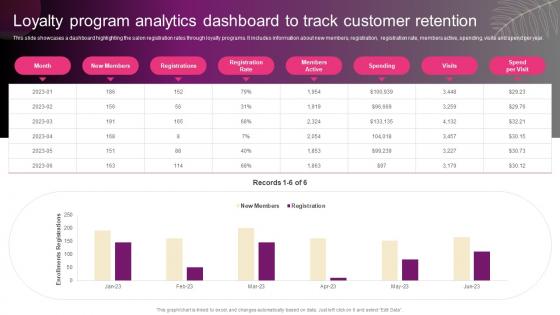 Loyalty Program Analytics Dashboard To Track New Hair And Beauty Salon Marketing Strategy SS
This slide showcases a dashboard highlighting the salon registration rates through loyalty programs. It includes information about new members, registration, registration rate, members active, spending, visits and spend per year. Present the topic in a bit more detail with this Loyalty Program Analytics Dashboard To Track New Hair And Beauty Salon Marketing Strategy SS. Use it as a tool for discussion and navigation on Loyalty Program, Analytics Dashboard, Customer Retention. This template is free to edit as deemed fit for your organization. Therefore download it now.
-
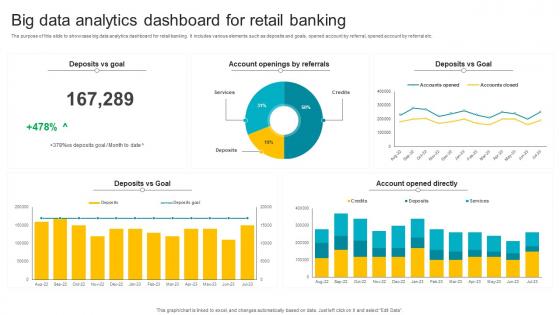 Big Data Analytics Dashboard For Retail Banking
The purpose of this slide to showcase big data analytics dashboard for retail banking. It includes various elements such as deposits and goals, opened account by referral, opened account by referral etc. Introducing our Big Data Analytics Dashboard For Retail Banking set of slides. The topics discussed in these slides are Account Openings By Referrals, Deposits Vs Goal. This is an immediately available PowerPoint presentation that can be conveniently customized. Download it and convince your audience.
-
 Marketing Analytics Dashboard To Evaluate Digital Marketing Strategies For Startups Strategy SS V
The following slide showcases performance key performance indicator KPI dashboard through which marketing team can measure social media campaign performance. The KPIs highlighted are YouTube channel views, Facebook daily reach, LinkedIn clicks and likes, etc. Present the topic in a bit more detail with this Marketing Analytics Dashboard To Evaluate Digital Marketing Strategies For Startups Strategy SS V. Use it as a tool for discussion and navigation on Analytics, Marketing, Media. This template is free to edit as deemed fit for your organization. Therefore download it now.
-
 Asset Allocation Investment Asset Allocation Dashboard Analytics Measurement
This slide showcases a dashboard for monitoring and reporting on asset allocation. It help track benchmarks asset class returns, calculates a composite index return for comparison with the portfolios performance and compares the current and target allocations with different chart options. Present the topic in a bit more detail with this Asset Allocation Investment Asset Allocation Dashboard Analytics Measurement Use it as a tool for discussion and navigation on Comparison Of Returns, Current Versus Target Allocation This template is free to edit as deemed fit for your organization. Therefore download it now.
-
 Asset Allocation Investment Equity Asset Allocation Dashboard Analytics
This slide represents an equity asset allocation dashboard to measure and manage the performance of equity overtime. It tracks KPIs such as, average position size, market cap distribution, average PE distribution, ratio and yield, by geography, industry, currency and holding lists. Deliver an outstanding presentation on the topic using this Asset Allocation Investment Equity Asset Allocation Dashboard Analytics Dispense information and present a thorough explanation of Quick Reallocations, High Transaction Costs, Modest Transaction Costs using the slides given. This template can be altered and personalized to fit your needs. It is also available for immediate download. So grab it now.
-
 Marketing Analytics Dashboard To Evaluate Social Media Marketing Your Startup Best Strategy SS V
The following slide showcases performance key performance indicator KPI dashboard through which marketing team can measure social media campaign performance. The kpis highlighted are youtube channel views, facebook daily reach, linkedin clicks and likes, etc. Deliver an outstanding presentation on the topic using this Marketing Analytics Dashboard To Evaluate Social Media Marketing Your Startup Best Strategy SS V. Dispense information and present a thorough explanation of Marketing, Analytics, Evaluate using the slides given. This template can be altered and personalized to fit your needs. It is also available for immediate download. So grab it now.
-
 Marketing Analytics Dashboard To Evaluate Social Media Promotional Tactics To Boost Strategy SS V
The following slide showcases performance key performance indicator KPI dashboard through which marketing team can measure social media campaign performance. The KPIs highlighted are YouTube channel views, Facebook daily reach, LinkedIn clicks and likes, etc. Present the topic in a bit more detail with this Marketing Analytics Dashboard To Evaluate Social Media Promotional Tactics To Boost Strategy SS V. Use it as a tool for discussion and navigation on Youtube Channel Views, Facebook Page Likes. This template is free to edit as deemed fit for your organization. Therefore download it now.
-
 How To Create Cost Effective Marketing Analytics Dashboard To Evaluate Social MKT SS V
The following slide showcases performance key performance indicator KPI dashboard through which marketing team can measure social media campaign performance. The KPIs highlighted are YouTube channel views, Facebook daily reach, LinkedIn clicks and likes, etc. Present the topic in a bit more detail with this How To Create Cost Effective Marketing Analytics Dashboard To Evaluate Social MKT SS V. Use it as a tool for discussion and navigation on Facebook Daily Reach, Linkedin Clicks And Likes. This template is free to edit as deemed fit for your organization. Therefore download it now.
-
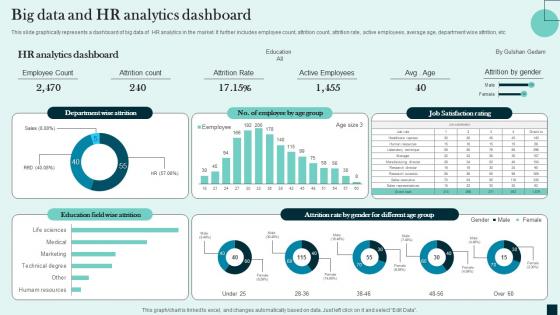 Big Data And HR Analytics Dashboard
This slide graphically represents a dashboard of big data of HR analytics in the market. It further includes employee count, attrition count, attrition rate, active employees, average age, department wise attrition, etc. Presenting our well structured Big Data And HR Analytics Dashboard. The topics discussed in this slide are Data, Analytics, Employee. This is an instantly available PowerPoint presentation that can be edited conveniently. Download it right away and captivate your audience.
-
 KPI Dashboard To Assess M And A Analytics Report Guide Of Business Merger And Acquisition Plan Strategy SS V
This slide covers KPI dashboard to assess MAndA analytics report. It involves key details such as percentage of total number of MAndA, nature of business acquired and digital focused acquisitions. Present the topic in a bit more detail with this KPI Dashboard To Assess M And A Analytics Report Guide Of Business Merger And Acquisition Plan Strategy SS V. Use it as a tool for discussion and navigation on Digital Focused Acquisitions, Nature Of Business Acquired. This template is free to edit as deemed fit for your organization. Therefore download it now.
-
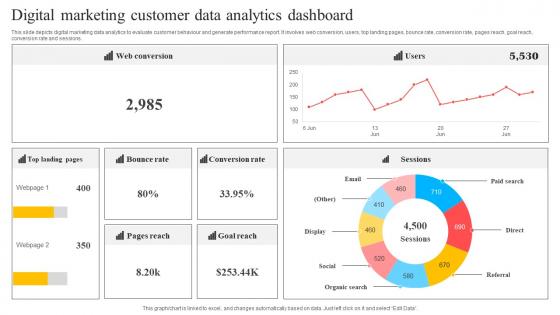 Digital Marketing Customer Data Analytics Dashboard
This slide depicts digital marketing data analytics to evaluate customer behaviour and generate performance report. It involves web conversion, users, top landing pages, bounce rate, conversion rate, pages reach, goal reach, conversion rate and sessions. Introducing our Digital Marketing Customer Data Analytics Dashboard set of slides. The topics discussed in these slides are Bounce Rate, Conversion Rate, Goal Reach. This is an immediately available PowerPoint presentation that can be conveniently customized. Download it and convince your audience.
-
 Marketing Analytics Dashboard To Evaluate Social Low Budget Marketing Techniques Strategy SS V
The following slide showcases performance key performance indicator KPI dashboard through which marketing team can measure social media campaign performance. The KPIs highlighted are YouTube channel views, Facebook daily reach, LinkedIn clicks and likes, etc. Deliver an outstanding presentation on the topic using this Marketing Analytics Dashboard To Evaluate Social Low Budget Marketing Techniques Strategy SS V. Dispense information and present a thorough explanation of Marketing, Analytics, Campaign using the slides given. This template can be altered and personalized to fit your needs. It is also available for immediate download. So grab it now.
-
 Cloud Development Dashboard For Web Analytics
This slide depicts dashboard for cloud based web analytics to analyse digital marketing growth of business. It includes factors such as social interactions, key web metrics, key sales metrics, digital channel proportion and regional sales stsus Introducing our Cloud Development Dashboard For Web Analytics set of slides. The topics discussed in these slides are Social Interactions, Key Web Metrics. This is an immediately available PowerPoint presentation that can be conveniently customized. Download it and convince your audience.
-
 Online Marketing Ad Data Science Analytics Dashboard
This slide includes the dashboard for data science analysis for online marketing ad performance evaluation. This includes various KPIs such as Ad spend, Ad reach, Ad clicks, CPC, etc. Introducing our Online Marketing Ad Data Science Analytics Dashboard set of slides. The topics discussed in these slides are Marketing, Data, Analytics. This is an immediately available PowerPoint presentation that can be conveniently customized. Download it and convince your audience.
-
 Web Analytics Dashboard For Strategic Website Management
This slide showcases dashboard of web analytics for strategic website management. It further includes top landing pages rate, bounce rate, total conversion rate, total pages, goal value, total sessions, etc. Introducing our Web Analytics Dashboard For Strategic Website Management set of slides. The topics discussed in these slides are Web Conversions, Sessions. This is an immediately available PowerPoint presentation that can be conveniently customized. Download it and convince your audience.
-
 Dashboard For Real Time Analytics In Retail Sector
This slide showcases real-time analytics dashboard for retail sector sales. The purpose of this template is to provide retailers with data analytics for improving inventory management, pricing strategy and allocation of products. It helps business organization to review sales data for identifying changing market trends and patterns. Introducing our Dashboard For Real Time Analytics In Retail Sector set of slides. The topics discussed in these slides are Sold Items, Units Per Transaction. This is an immediately available PowerPoint presentation that can be conveniently customized. Download it and convince your audience.
-
 Real Time Analytics Dashboard For HR Department
This slide showcases HR analysis using business intelligence tool. The purpose of this slide is to understand the workforce demographics and effective management of employees to achieve business goals. It includes elements such as share of female by role, person with disability, etc. Presenting our well structured Real Time Analytics Dashboard For HR Department. The topics discussed in this slide are Departments By Gender, Persons With Disabilities. This is an instantly available PowerPoint presentation that can be edited conveniently. Download it right away and captivate your audience.
-
 Real Time Analytics Dashboard For Measuring Sales Performance
This slide highlights sales performance dashboard for real-time analytics. This slide aims to provide businesses with a helpful tool for forecasting future sales and improving overall revenue generation processes. It provide insights regarding new customers, sales revenue, profit yields, etc. Introducing our Real Time Analytics Dashboard For Measuring Sales Performance set of slides. The topics discussed in these slides are Sales City Performance, Monthly Sales Growth. This is an immediately available PowerPoint presentation that can be conveniently customized. Download it and convince your audience.
-
 Real Time Budget Analytics Dashboard For Business
This slide highlights real-time operational analytics for business entity. The purpose of this slide is to streamline business operations by improving productivity and reducing expenses. It includes elements such budget revenue total, debt to equity ratio, etc. Introducing our Real Time Budget Analytics Dashboard For Business set of slides. The topics discussed in these slides are Budget, Budget Total. This is an immediately available PowerPoint presentation that can be conveniently customized. Download it and convince your audience.
-
 Website Real Time Usage Analytics Dashboard
This slide highlights a real-time analytics dashboard for website usage. This slide aims at improving audience experience and optimizing the sites performance. It provides details regarding latest data sources, latest devices, views per second, etc. Introducing our Website Real Time Usage Analytics Dashboard set of slides. The topics discussed in these slides are Latest Data Sources, Views Per Minute. This is an immediately available PowerPoint presentation that can be conveniently customized. Download it and convince your audience.
-
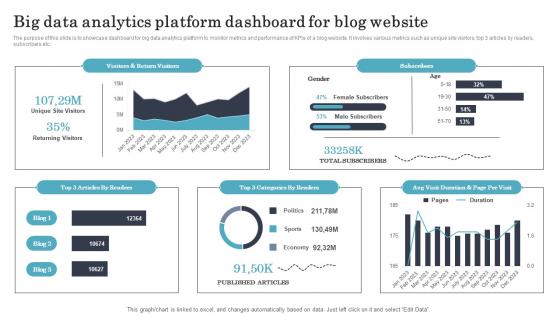 Big Data Analytics Platform Dashboard For Blog Website
The purpose of this slide is to showcase dashboard for big data analytics platform to monitor metrics and performance of KPIs of a blog website. It involves various metrics such as unique site visitors, top 3 articles by readers, subscribers etc. Introducing our Big Data Analytics Platform Dashboard For Blog Website set of slides. The topics discussed in these slides are Subscribers, Categories By Readers. This is an immediately available PowerPoint presentation that can be conveniently customized. Download it and convince your audience.
-
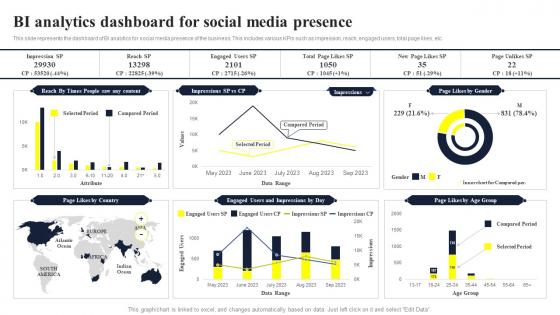 BI Analytics Dashboard For Social Media Presence
This slide represents the dashboard of BI analytics for social media presence of the business. This includes various KPIs such as impression, reach, engaged users, total page likes, etc. Introducing our BI Analytics Dashboard For Social Media Presence set of slides. The topics discussed in these slides are Analytics, Media, Presence. This is an immediately available PowerPoint presentation that can be conveniently customized. Download it and convince your audience.
-
 Metaverse Retail Dashboard For Business Insights And Analytics
This slide showcases dashboard of Metaverse retail for insights. The main purpose of this slide is to provide real time data and insights that are essential for retail business. This includes website traffic, website visitors, bounce rate, etc. Introducing our Metaverse Retail Dashboard For Business Insights And Analytics set of slides. The topics discussed in these slides are Website Traffic, Bounce Rate. This is an immediately available PowerPoint presentation that can be conveniently customized. Download it and convince your audience.
-
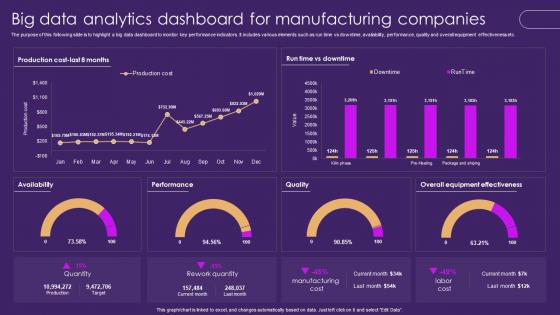 Big Data Analytics Dashboard For Manufacturing Companies
The purpose of this following slide is to highlight a big data dashboard to monitor key performance indicators. It includes various elements such as run time vs downtime, availability, performance, quality and overall equipment effectiveness etc. Introducing our Big Data Analytics Dashboard For Manufacturing Companies set of slides. The topics discussed in these slides are Performance, Quality, Overall Equipment Effectiveness. This is an immediately available PowerPoint presentation that can be conveniently customized. Download it and convince your audience.
-
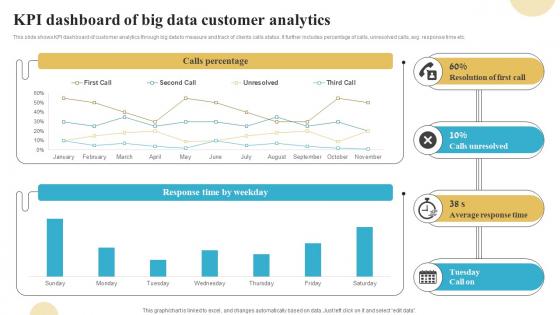 Kpi Dashboard Of Big Data Customer Analytics
This slide shows KPI dashboard of customer analytics through big data to measure and track of clients calls status. It further includes percentage of calls, unresolved calls, avg. response time etc. Presenting our well structured Kpi Dashboard Of Big Data Customer Analytics. The topics discussed in this slide are Calls Percentage, Resolution Of First Call, Calls Unresolved. This is an instantly available PowerPoint presentation that can be edited conveniently. Download it right away and captivate your audience.
-
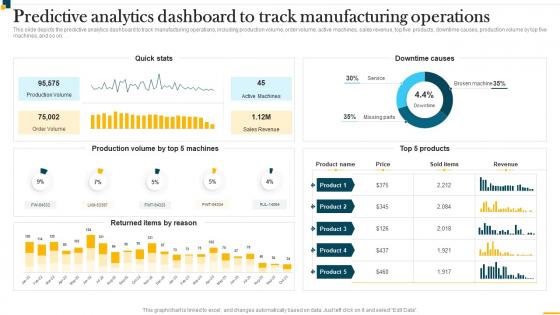 IT In Manufacturing Industry V2 Predictive Analytics Dashboard To Track Manufacturing Operations
This slide depicts the predictive analytics dashboard to track manufacturing operations, including production volume, order volume, active machines, sales revenue, top five products, downtime causes, production volume by top five machines, and so on. Present the topic in a bit more detail with this IT In Manufacturing Industry V2 Predictive Analytics Dashboard To Track Manufacturing Operations. Use it as a tool for discussion and navigation on Predictive Analytics Dashboard, Track Manufacturing Operations, Production Volume. This template is free to edit as deemed fit for your organization. Therefore download it now.
-
 Bizops Analytical Dashboard For Evaluating Financial Performance
This slide represents KPI dashboard for bizops monitoring and tracking of different business operations and ongoing processes. It includes metrics such as current monthly leads, estimated billed, current monthly projects, etc. Introducing our Bizops Analytical Dashboard For Evaluating Financial Performance set of slides. The topics discussed in these slides are Current Monthly Leads, Current Monthly Projects. This is an immediately available PowerPoint presentation that can be conveniently customized. Download it and convince your audience.
-
 Construction Analytics Dashboard For Project Management
This slide illustrates different KPIs of construction project management for providing relevant user information about money involved and various indicators . It includes metrics such as total advancements, collective projects update, elements delivered, etc. Introducing our Construction Analytics Dashboard For Project Management set of slides. The topics discussed in these slides are Construction Project, Management Dashboard. This is an immediately available PowerPoint presentation that can be conveniently customized. Download it and convince your audience.
-
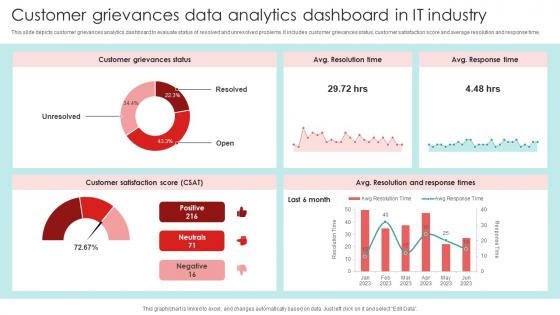 Customer Grievances Data Analytics Dashboard In IT Industry
This slide depicts customer grievances analytics dashboard to evaluate status of resolved and unresolved problems. It includes customer grievances status, customer satisfaction score and average resolution and response time. Introducing our Customer Grievances Data Analytics Dashboard In IT Industry set of slides. The topics discussed in these slides are Customer, Analytics, Industry. This is an immediately available PowerPoint presentation that can be conveniently customized. Download it and convince your audience.
-
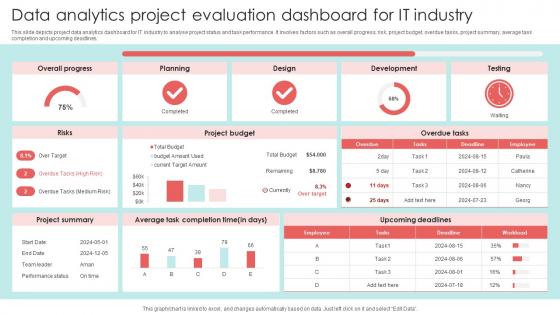 Data Analytics Project Evaluation Dashboard For IT Industry
This slide depicts project data analytics dashboard for IT industry to analyse project status and task performance. It involves factors such as overall progress, risk, project budget, overdue tasks, project summary, average task completion and upcoming deadlines. Presenting our well structured Data Analytics Project Evaluation Dashboard For IT Industry. The topics discussed in this slide are Analytics, Progress, Planning. This is an instantly available PowerPoint presentation that can be edited conveniently. Download it right away and captivate your audience.
-
 Risk Trends Analytics Dashboard For Strategic Planning
This slide illustrates KPI dashboard for risk trends to provide visual and data driven overview of evolving risk. It includes metrics such as tech publication, digital finance, IT blogger, analytics dashboard, etc. Presenting our well structured Risk Trends Analytics Dashboard For Strategic Planning. The topics discussed in this slide are Leadership, Improving, Development. This is an instantly available PowerPoint presentation that can be edited conveniently. Download it right away and captivate your audience.
-
 Retail Analytics Dashboard For Market Expansion
This slide represents retail dashboard for business expansion to analyze and increase various business touchpoints. It includes metrics such as Success rate, Gross profitability index, inventory turnover, etc. Introducing our Retail Analytics Dashboard For Market Expansion set of slides. The topics discussed in these slides are Retail, Analytics, Market. This is an immediately available PowerPoint presentation that can be conveniently customized. Download it and convince your audience.
-
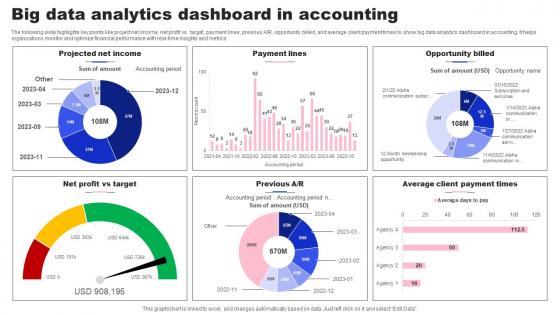 Big Data Analytics Dashboard In Accounting
The following slide highlights key points like project net income, net profit vs. target, payment lines, previous A R, opportunity billed, and average client payment times to show big data analytics dashboard in accounting. It helps organizations monitor and optimize financial performance with real-time insights and metrics. Presenting our well structured Big Data Analytics Dashboard In Accounting. The topics discussed in this slide are Payment Lines, Profit Vs Target. This is an instantly available PowerPoint presentation that can be edited conveniently. Download it right away and captivate your audience.
-
 KPI Dashboard To Assess IOT Analytics In Healthcare Guide Of Integrating Industrial Internet
This slide covers dashboard to assess patient data by integrating IoT to enhance healthcare services. It involves details such as heart rate, temperature and oxygen level. Present the topic in a bit more detail with this KPI Dashboard To Assess IOT Analytics In Healthcare Guide Of Integrating Industrial Internet. Use it as a tool for discussion and navigation on Blood Pressure, Temperature. This template is free to edit as deemed fit for your organization. Therefore download it now.
-
 Business Intelligence Dashboard Showcasing Website Analytics
This slide showcases the Google analytics and power business intelligence dashboard which helps an organization to provide valuable insights website visits and their growth. It include details such as January, march, may, july, august, October, December. Presenting our well structured Business Intelligence Dashboard Showcasing Website Analytics. The topics discussed in this slide are Intelligence, Website, Analytics. This is an instantly available PowerPoint presentation that can be edited conveniently. Download it right away and captivate your audience.
-
 Visual Analytics Dashboard To Boost Marketer Roi
This slide outlines the visual analytics dashboard for marketers. It includes actionable insights and comprehensive view of marketing performance. Presenting our well structured Visual Analytics Dashboard To Boost Marketer Roi. The topics discussed in this slide are Analytics, Dashboard, Performance. This is an instantly available PowerPoint presentation that can be edited conveniently. Download it right away and captivate your audience.
-
 Analytics Dashboard To Track Website Performance Direct Response Marketing Channels Used To Increase MKT SS V
This slide provides an overview of the analytics dashboard that helps to measure the performance of the website. The dashboard includes visits, average session duration, bounce rate, page views and goal conversion. Present the topic in a bit more detail with this Analytics Dashboard To Track Website Performance Direct Response Marketing Channels Used To Increase MKT SS V. Use it as a tool for discussion and navigation on Traffic Sources, Visitors By User Type. This template is free to edit as deemed fit for your organization. Therefore download it now.
-
 Dashboard Of Text Analytics For Obtaining Samples Of Sentiments
This slide showcases a dashboard for text analytics. The main purpose of this text analytics dashboard is tracking sentiments by topic and organize key text from large paragraphs. This includes samples by topic, sentiment over time tec. Presenting our well structured Dashboard Of Text Analytics For Obtaining Samples Of Sentiments. The topics discussed in this slide are Samples Sentiment, Representation Topic, Vocabulary Cloud. This is an instantly available PowerPoint presentation that can be edited conveniently. Download it right away and captivate your audience.
-
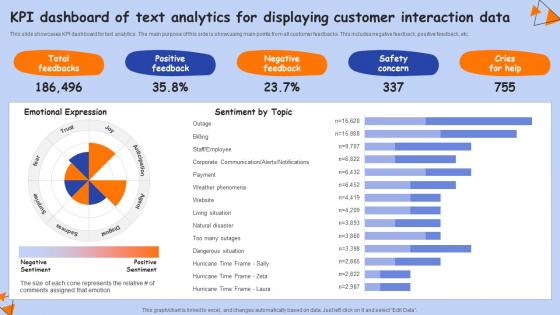 KPI Dashboard Of Text Analytics For Displaying Customer Interaction Data
This slide showcases KPI dashboard for text analytics. The main purpose of this side is showcasing main points from all customer feedbacks. This includes negative feedback, positive feedback, etc.Introducing our KPI Dashboard Of Text Analytics For Displaying Customer Interaction Data set of slides. The topics discussed in these slides are Corporate Communication, Weather Phenomena, Natural Disaster. This is an immediately available PowerPoint presentation that can be conveniently customized. Download it and convince your audience.
-
 KPI Analytics Dashboard For Smart Home Unlocking Potential Of Aiot IoT SS
The purpose of this slide is to showcase key performance indicators KPIs dashboard for smart homes. The metrics mentioned in slide are indoor temperature, humidity, light intensity, etc. Present the topic in a bit more detail with this KPI Analytics Dashboard For Smart Home Unlocking Potential Of Aiot IoT SS. Use it as a tool for discussion and navigation on Living Room, Bedroom. This template is free to edit as deemed fit for your organization. Therefore download it now.
-
 Client Satisfaction Data Analytics Dashboard
This slide shows customer data analytics dashboard that can be used to summaries annual data for compiling data. It include figures related to requests answered, total requests and satisfaction rate, etc.Introducing our Client Satisfaction Data Analytics Dashboard set of slides. The topics discussed in these slides are Requests Answered, Total Requests, Total Revenue. This is an immediately available PowerPoint presentation that can be conveniently customized. Download it and convince your audience.
-
 Data Analytics Dashboard To Determine Client Behaviour
This slide shows customer patterns related data analytics dashboard that can be used to analyse current customer trends for making policies. It include shopping behavioural insights, customer conversion rate, etc.Presenting our well structured Data Analytics Dashboard To Determine Client Behaviour. The topics discussed in this slide are Customers Conversion, Shopping Behavioural, Shopping Activity This is an instantly available PowerPoint presentation that can be edited conveniently. Download it right away and captivate your audience.
-
 Global Regions Client Data Insights And Analytics Dashboard
This slide shows customer data analytics dashboard that can be used to summarise region wise sales distribution across the globe. It include weekly conversion rate, regional conversion rate and margin ratios, etc.Introducing our Global Regions Client Data Insights And Analytics Dashboard set of slides. The topics discussed in these slides are Regional Conversion, Weekly Conversion, Region Launched. This is an immediately available PowerPoint presentation that can be conveniently customized. Download it and convince your audience.
-
 Marketing Analytics Dashboard To Evaluate Effective Marketing Strategies For Bootstrapped Strategy SS V
The following slide showcases performance key performance indicator KPI dashboard through which marketing team can measure social media campaign performance. The KPIs highlighted are YouTube channel views, Facebook daily reach, LinkedIn clicks and likes, etc. Present the topic in a bit more detail with this Marketing Analytics Dashboard To Evaluate Effective Marketing Strategies For Bootstrapped Strategy SS V. Use it as a tool for discussion and navigation on Analytics, Marketing, Performance. This template is free to edit as deemed fit for your organization. Therefore download it now.
-
 Agile Financial Analytics Kpi Dashboard
This slide showcases financial analytics KPI dashboard. This slide aims to provide in depth insights into company financial status to add value to the company. It helps in improving financial performance through proper information about the expenses and revenue of the organization. Presenting our well structured Agile Financial Analytics Kpi Dashboard. The topics discussed in this slide are Current Ratio Mom Trend, Dimension Breakdown.This is an instantly available PowerPoint presentation that can be edited conveniently. Download it right away and captivate your audience.
-
 Agile Risk Analytics Kpi Dashboard
This slide highlights KPI dashboard for agile risk analytics. The purpose of this template is to identify internal and external risk for the business entity and employ techniques for risk mitigation. It includes components such as total risk, initial risk level, risk status, risk trends and top risks of the entity. Presenting our well structured Agile Risk Analytics Kpi Dashboard. The topics discussed in this slide are Identify Goals, Risk Assessment.This is an instantly available PowerPoint presentation that can be edited conveniently. Download it right away and captivate your audience.
-
 Dashboard For Agile Analytics In Retail Sector
This slide showcases agile analytics dashboard for retail sector sales. The purpose of this template is to provide retailers with data analytics for improving inventory management, pricing strategy and allocation of products. It helps business organization to review sales data for identifying changing market trends and patterns. Introducing our Dashboard For Agile Analytics In Retail Sector set of slides. The topics discussed in these slides are Sales Summery, Daily Sales Forecast. This is an immediately available PowerPoint presentation that can be conveniently customized. Download it and convince your audience.
-
 Website Usage Agile Analytics Dashboard
This slide highlights agile analytics dashboard for website usage. This slide aims to provide details regarding usage by various services, number of users on website, number of sales, network traffic, plan level and sales by plan. It helps in improving audience experience and optimizing sites performance. Presenting our well structured Website Usage Agile Analytics Dashboard. The topics discussed in this slide are Product Service Usage, Network Traffic.This is an instantly available PowerPoint presentation that can be edited conveniently. Download it right away and captivate your audience.
-
 Online Product Analytics Management Dashboard
This slide presents the dashboard for online product analytics for enhancing online performance management. This includes data like total sessions, total visitors, avg. requests received, views by browser, etc. Introducing our Online Product Analytics Management Dashboard set of slides. The topics discussed in these slides are Online Product, Analytics Management, Dashboard. This is an immediately available PowerPoint presentation that can be conveniently customized. Download it and convince your audience.


