Powerpoint Templates and Google slides for Dash
Save Your Time and attract your audience with our fully editable PPT Templates and Slides.
-
 Market Penetration Dashboard With Sales Metrics
This slide shows market penetration dashboard for sales team. It provides information about regions, emerging markets, planned sales, actual sales, revenue, gender wise sales, etc. Introducing our premium set of slides with Market Penetration Dashboard With Sales Metrics. Ellicudate the three stages and present information using this PPT slide. This is a completely adaptable PowerPoint template design that can be used to interpret topics like Penetration By Region,Emerging Markets,Revenue. So download instantly and tailor it with your information.
-
 Software Market Penetration KPI Dashboard
This slide shows market penetration key performance indicator KPI dashboard for software sector. It provides information about growth rate, portfolio, platform, applications, services, on premises, cloud, etc.Presenting our well structured Software Market Penetration KPI Dashboard. The topics discussed in this slide are Market Size,Global Market,Dashboard,Platform. This is an instantly available PowerPoint presentation that can be edited conveniently. Download it right away and captivate your audience.
-
 Supplier Quality Dashboard To Assess Risk In Procurement
This slide cover supplier quality dashboard to assess risk in procurement process. It involves detail such as risk matrix, tier 1, 2 and 3 specifications.Introducing our Supplier Quality Dashboard To Assess Risk In Procurement set of slides. The topics discussed in these slides are Supply Chain Risk, Supplier Quality Dashboard, Assess Risk in Procurement. This is an immediately available PowerPoint presentation that can be conveniently customized. Download it and convince your audience.
-
 Third Party Procurement Risk Management Dashboard
This slide covers the third-party procurement risk management dashboard. It involves service risk, country risk, service type, and supplier details.Presenting our well structured Third Party Procurement Risk Management Dashboard. The topics discussed in this slide are Third Party Procurement, Risk Management Dashboard, Service Type. This is an instantly available PowerPoint presentation that can be edited conveniently. Download it right away and captivate your audience.
-
 IT Risk Management Dashboard Highlighting Network Devices Server Status
The following slide highlights the information technology dashboard for risk management which includes devices, workstations status, unmonitored devices, last reboot time and problem servers. Present the topic in a bit more detail with this IT Risk Management Dashboard Highlighting Network Devices Server Status. Use it as a tool for discussion and navigation on Devices, Problem Devices, Server Status, Problem Workstations. This template is free to edit as deemed fit for your organization. Therefore download it now.
-
 Dashboard Showing Project Task Management Timeline
This slide shows the dashboard that depicts the project management timeline which covers tasks timeline such as creating project documents, assembling project team, planning, sequencing tasks on the basis of priority, identifying resources, review project quality with task status and time required to complete the tasks. Presenting our well structured Dashboard Showing Project Task Management Timeline. The topics discussed in this slide are Assemble Project Team, Create Documents, Planning. This is an instantly available PowerPoint presentation that can be edited conveniently. Download it right away and captivate your audience.
-
 QBR Dashboard Indicating Total Sales And Revenue
This slide shows quarterly business review dashboard highlighting total sales and revenue. It provides information about new customer, gross profit, customer satisfaction, profitability, etc. Presenting our well structured QBR Dashboard Indicating Total Sales And Revenue. The topics discussed in this slide are Revenue, New Customer, Gross Profit, Customer Satisfaction. This is an instantly available PowerPoint presentation that can be edited conveniently. Download it right away and captivate your audience.
-
 Key Business Metrics Dashboard Business Process Management And Optimization Playbook
The following dashboard displays the key business metrics such as new customers, profit, revenue per customer, and weekly revenue. Present the topic in a bit more detail with this Key Business Metrics Dashboard Business Process Management And Optimization Playbook. Use it as a tool for discussion and navigation on Average Revenue, Key Business, Metrics Dashboard. This template is free to edit as deemed fit for your organization. Therefore download it now.
-
 Dashboard Depicting Project Associated Risks And Issues Strategic Plan For Project Lifecycle
This slide focuses on project management dashboard which covers the project name, status date overall status, monthly schedule such as analysis, development, quality assurance, user acceptance, pre-production and support with actual and planned budget, pending decisions and actions, etc. Present the topic in a bit more detail with this Dashboard Depicting Project Associated Risks And Issues Strategic Plan For Project Lifecycle. Use it as a tool for discussion and navigation on Overall Status, Risk, Budget, Analysis. This template is free to edit as deemed fit for your organization. Therefore download it now.
-
 Project Management Dashboard To Measure Performance Strategic Plan For Project Lifecycle
This slide covers the project management dashboard which includes status of project phases such as planning, designing, development and testing that also focuses on launch date of project, overdue tasks with date, deadline, etc. and workload on employees. Deliver an outstanding presentation on the topic using this Project Management Dashboard To Measure Performance Strategic Plan For Project Lifecycle. Dispense information and present a thorough explanation of Product Launch Date, Planning, Development, Testing using the slides given. This template can be altered and personalized to fit your needs. It is also available for immediate download. So grab it now.
-
 Data Science Technology Dashboard Snapshot For Data Science Implementation
This slide depicts the dashboard for data integration in the business, and it is showing real-time details about expenses, profits, margins percentage, and new addition projects. Present the topic in a bit more detail with this Data Science Technology Dashboard Snapshot For Data Science Implementation. Use it as a tool for discussion and navigation on Analytics, Implementation, Integration. This template is free to edit as deemed fit for your organization. Therefore download it now.
-
 Dashboard Snapshot For Personalized Digital Marketing KPIS Ppt Ideas Pictures
This slide showcases dashboard that can help organization to measure the KPIs after implementing personalized marketing campaigns. Its key elements are lead breakdown, web user to lead, lead to trial, leads by region and google analtics web traffic. Present the topic in a bit more detail with this Dashboard For Personalized Digital Marketing KPIS Ppt Ideas Pictures. Use it as a tool for discussion and navigation on Lead Breakdown, Conversion Metrics, Quality Trial. This template is free to edit as deemed fit for your organization. Therefore download it now.
-
 Website Analytics Dashboard For Consumer Data Insights Ppt Summary Layout Ideas
This slide showcases dashboard for website analytics that can help organization to gather data about visitors and formulate targeted marketing campaigns. It can also help to make individual and group buyer personas Present the topic in a bit more detail with this Website Analytics Dashboard For Consumer Data Insights Ppt Summary Layout Ideas. Use it as a tool for discussion and navigation on Social Networks, Countries, Demographics. This template is free to edit as deemed fit for your organization. Therefore download it now.
-
 IOS And Android Mobile App Monitoring Dashboard IOS App Development
This slide demonstrates the iOS and mobile app monitoring dashboard including problems, errors, detection of processes, crashes.Deliver an outstanding presentation on the topic using this IOS And Android Mobile App Monitoring Dashboard IOS App Development. Dispense information and present a thorough explanation of Availability, Duration, Crashes using the slides given. This template can be altered and personalized to fit your needs. It is also available for immediate download. So grab it now.
-
 Asset Valuation Dashboard Indicating Revenue And Productivity
This slide showcases asset valuation dashboard highlighting company revenue and productivity index. It provides information about geographical evaluation, development cost, commercial cost, etc. Presenting our well structured Asset Valuation Dashboard Indicating Revenue And Productivity. The topics discussed in this slide are Projected Development Cost, Productivity Index. This is an instantly available PowerPoint presentation that can be edited conveniently. Download it right away and captivate your audience.
-
 Asset Valuation Dashboard With Cash Flow And Market Value
This slide illustrates asset valuation dashboard with key financial metrics. It provides information about cash flow, market value, intrinsic value, assumptions, market cap, discount rate, etc. Introducing our Asset Valuation Dashboard With Cash Flow And Market Value set of slides. The topics discussed in these slides are Assumptions, Cash Flow, Market Value. This is an immediately available PowerPoint presentation that can be conveniently customized. Download it and convince your audience.
-
 Asset Valuation Dashboard With ROI Metrics
This slide illustrates asset valuation dashboard with return on investment metrics. It provides information about internal rate of return, investment type, deal size, asset type, Presenting our well structured Asset Valuation Dashboard With ROI Metrics. The topics discussed in this slide are Internal Rate Of Return, By Investment Type, Count By Deal Size. This is an instantly available PowerPoint presentation that can be edited conveniently. Download it right away and captivate your audience.
-
 Scrum Project Management And Tracking Dashboard
The following slide showcases tracking dashboard for scrum project management. It includes information about weekly tracking, overall completion, start and end date, remaining days, sprints, status productivity, engaged users, etc. Introducing our Scrum Project Management And Tracking Dashboard set of slides. The topics discussed in these slides are Scrum Project Management, Tracking Dashboard. This is an immediately available PowerPoint presentation that can be conveniently customized. Download it and convince your audience.
-
 Scrum Project Task Management Dashboard
The following slide demonstrates scrum project task management dashboard. It includes information about sprint velocity, scope changes, tasks category, tasks progress, planned, finished, added, removed, bug, story, etc. Presenting our well structured Scrum Project Task Management Dashboard. The topics discussed in this slide are Scrum Project, Task Management, Dashboard. This is an instantly available PowerPoint presentation that can be edited conveniently. Download it right away and captivate your audience.
-
 International Demographic Marketing Segmentation And Distribution Dashboard
This slide represents the dashboard showing demographic segmentation of the international marketing. It shows details related to distribution of products by income, age group, job classification, gender and region. Introducing our International Demographic Marketing Segmentation And Distribution Dashboard set of slides. The topics discussed in these slides are International Demographic Marketing Segmentation, Distribution Dashboard. This is an immediately available PowerPoint presentation that can be conveniently customized. Download it and convince your audience.
-
 International Products Customer Segmentation Dashboard With Descriptions
This slide represents a dashboard showing the customer segmentation for an international product. It shows details related to total customers in each segments, segments description, characteristics and search customers by ID. Introducing our International Products Customer Segmentation Dashboard With Descriptions set of slides. The topics discussed in these slides are International Products Customer, Segmentation Dashboard With Descriptions. This is an immediately available PowerPoint presentation that can be conveniently customized. Download it and convince your audience.
-
 Inventory Kpis Dashboard For FMCG Company
This slide showcases the metrics for analyzing inventory turnover. It includes KPIs such as product sold within freshness date, out of stock rate, on time in full deliveries, etc. Presenting our well structured Inventory Kpis Dashboard For FMCG Company. The topics discussed in this slide are Average, Products, Stock Rate. This is an instantly available PowerPoint presentation that can be edited conveniently. Download it right away and captivate your audience.
-
 Kpis Dashboard For Inventory Team Management
This slide represents the dashboard for tracking the management team member, manager, and teams ability to ensure inventory accuracy over time. It includes KPIs such as inventory, average result area scores and result areas. Introducing our Kpis Dashboard For Inventory Team Management set of slides. The topics discussed in these slides are Analyze, Cost, Materials Management Team. This is an immediately available PowerPoint presentation that can be conveniently customized. Download it and convince your audience.
-
 Retail Inventory Management Kpis Dashboard
This slide represents the dashboard for retail stock management. It includes the KPIs such as average inventory value by product category, return items etc. Introducing our Retail Inventory Management Kpis Dashboard set of slides. The topics discussed in these slides are Average Inventory Value, Product Category, Stock Availability. This is an immediately available PowerPoint presentation that can be conveniently customized. Download it and convince your audience.
-
 Candidate Job Search Portal Dashboard With Vacancy Status
This slide candidate job search portal dashboard with vacancy status. It provides information about interviews schedule, application sent, profile viewed, unread message, vacancy stats, etc. Introducing our Candidate Job Search Portal Dashboard With Vacancy Status set of slides. The topics discussed in these slides are Candidate Job Search Portal Dashboard, Vacancy Status. This is an immediately available PowerPoint presentation that can be conveniently customized. Download it and convince your audience.
-
 CRM Team Dashboard Highlighting Major Web Portal Kpis
This slide showcases customer relationship management CRM team dashboard indicating web portal KPIs. It provides information about cost per acquisition CPA , signups, channel, spend, etc. Presenting our well structured CRM Team Dashboard Highlighting Major Web Portal Kpis. The topics discussed in this slide are Crm Team Dashboard Highlighting Major, Web Portal Kpis. This is an instantly available PowerPoint presentation that can be edited conveniently. Download it right away and captivate your audience.
-
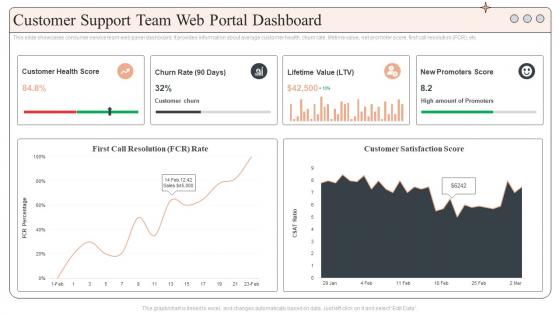 Customer Support Team Web Portal Dashboard
This slide showcases consumer service team web panel dashboard. It provides information about average customer health, churn rate, lifetime value, net promoter score, first call resolution FCR, etc Presenting our well structured Customer Support Team Web Portal Dashboard. The topics discussed in this slide are Customer Support Team, Web Portal Dashboard. This is an instantly available PowerPoint presentation that can be edited conveniently. Download it right away and captivate your audience.
-
 Ecommerce Website Admin Web Portal Dashboard
This slide shows ecommerce website panel dashboard. It provides information about sales, returns, purchases, app downloads, customers, conversions, revenue, etc. Presenting our well structured Ecommerce Website Admin Web Portal Dashboard. The topics discussed in this slide are Customers Onboard, Actual Sales, Purchases. This is an instantly available PowerPoint presentation that can be edited conveniently. Download it right away and captivate your audience.
-
 Project Management Company Web Portal Dashboard
This slide shows project management firm web panel dashboard. It provides information about active, completed, timeline, current phase, design, intranet, print, etc. Introducing our Project Management Company Web Portal Dashboard set of slides. The topics discussed in these slides are Secured Intranet, Design, Project. This is an immediately available PowerPoint presentation that can be conveniently customized. Download it and convince your audience.
-
 Real Estate Firm Web Portal Dashboard
This slide shows realtor service web panel dashboard. It provides information about properties for sale, sites for rent, total customers, cities, revenue, sites viewed, listings, reviews, etc. Presenting our well structured Real Estate Firm Web Portal Dashboard. The topics discussed in this slide are Rental Locations, Customers, Sale. This is an instantly available PowerPoint presentation that can be edited conveniently. Download it right away and captivate your audience.
-
 Social Media Admin Web Portal Dashboard
This slide showcases social media admin web panel dashboard. It provides information about members online, platforms, feeds, followers, friends, traffic, unique visits, bounce rate, etc. Introducing our Social Media Admin Web Portal Dashboard set of slides. The topics discussed in these slides are Social Media Admin, Web Portal Dashboard. This is an immediately available PowerPoint presentation that can be conveniently customized. Download it and convince your audience.
-
 Program Metrics Dashboard Snapshot With Activity Hours
The following slide highlights the Program metrics dashboard snapshot with activity hours illustrating key headings which includes weekly hours, total budget, completed task, remaining budget, actual revenue, expected revenue, schedule, activity hours, task, client proposal details, task performance and current programs. Presenting our well structured Program Metrics Dashboard With Activity Hours. The topics discussed in this slide are Program, Metrics Dashboard, Activity Hours. This is an instantly available PowerPoint presentation that can be edited conveniently. Download it right away and captivate your audience.
-
 Managing Crm Pipeline For Revenue Generation Tracking Customer Sales Funnel Dashboard
This slide covers information regarding the customer sales funnel tracking with sales volume and total market. Deliver an outstanding presentation on the topic using this Managing Crm Pipeline For Revenue Generation Tracking Customer Sales Funnel Dashboard. Dispense information and present a thorough explanation of Dashboard, Information, Regarding using the slides given. This template can be altered and personalized to fit your needs. It is also available for immediate download. So grab it now.
-
 Linked Data IT Data Quality Dashboard For Linked Data Ppt Powerpoint Presentation Styles Graphics
This slide describes the data quality dashboard for linked data by covering details of account information quality, contact details quality, financial data quality, and missing account information. Present the topic in a bit more detail with this Linked Data IT Data Quality Dashboard For Linked Data Ppt Powerpoint Presentation Styles Graphics. Use it as a tool for discussion and navigation on Account Data Quality, Contact Data Quality, Financial Data Quality. This template is free to edit as deemed fit for your organization. Therefore download it now.
-
 Dashboard Showing Information Technology Risk Management
This slide shows the dashboard that depicts the information technology risk management which focuses on the percentage of potential risks, risk analysis progress, response progress, risk rating breakdown with vulnerabilities such as encryption vulnerabilities, physical security , etc. Deliver an outstanding presentation on the topic using this Dashboard Showing Information Technology Risk Management. Dispense information and present a thorough explanation of Risk Rating Breakdown, Risk Heat Map, Action Plan Breakdown using the slides given. This template can be altered and personalized to fit your needs. It is also available for immediate download. So grab it now.
-
 Social Media Marketing Dashboard B2b And B2c Marketing Strategy Social Media Marketing
The following slide displays key metrics that can help the organization to measure effectiveness of social media marketing strategy, these can be growth in engagement, audience growth etc.Deliver an outstanding presentation on the topic using this Social Media Marketing Dashboard B2b And B2c Marketing Strategy Social Media Marketing. Dispense information and present a thorough explanation of Conversions Social, Retweets, Traffics Session using the slides given. This template can be altered and personalized to fit your needs. It is also available for immediate download. So grab it now.
-
 Overall Product Management Activities Tracking Dashboard New Product Release Management Playbook
This slide provides information regarding essential product management activities tracking dashboard in terms of project budget, workload, overdue tasks, upcoming deadlines, project launch date, etc. Deliver an outstanding presentation on the topic using this Overall Product Management Activities Tracking Dashboard New Product Release Management Playbook. Dispense information and present a thorough explanation of Development, Completed, Project Budget using the slides given. This template can be altered and personalized to fit your needs. It is also available for immediate download. So grab it now.
-
 Product Launch Activities Tracking Dashboard New Product Release Management Playbook
This slide provides information regarding product launch activities tracking dashboard in terms of project budget, projected launch date, overdue tasks, workload, risks, etc. Deliver an outstanding presentation on the topic using this Product Launch Activities Tracking Dashboard New Product Release Management Playbook. Dispense information and present a thorough explanation of Employee Over, Overdue Tasks, Projected Launch using the slides given. This template can be altered and personalized to fit your needs. It is also available for immediate download. So grab it now.
-
 Product Launch Team Performance Dashboard New Product Release Management Playbook
This slide provides information regarding product launch team performance with key result area scores for idea generation, engineering design and key result areas performance. Deliver an outstanding presentation on the topic using this Product Launch Team Performance Dashboard New Product Release Management Playbook. Dispense information and present a thorough explanation of Generation Or Innovation, Engineering And Design, Prototypes Developed using the slides given. This template can be altered and personalized to fit your needs. It is also available for immediate download. So grab it now.
-
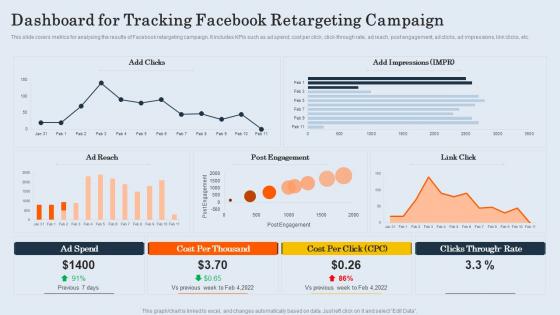 Dashboard For Tracking Facebook Retargeting Campaign Customer Retargeting And Personalization
This slide covers metrics for analysing the results of Facebook retargeting campaign. It includes KPIs such as ad spend, cost per click, clickthrough rate, ad reach, post engagement, ad clicks, ad impressions, link clicks, etc. Deliver an outstanding presentation on the topic using this Dashboard For Tracking Facebook Retargeting Campaign Customer Retargeting And Personalization. Dispense information and present a thorough explanation of Post Engagement, Per Thousand, Impressions using the slides given. This template can be altered and personalized to fit your needs. It is also available for immediate download. So grab it now.
-
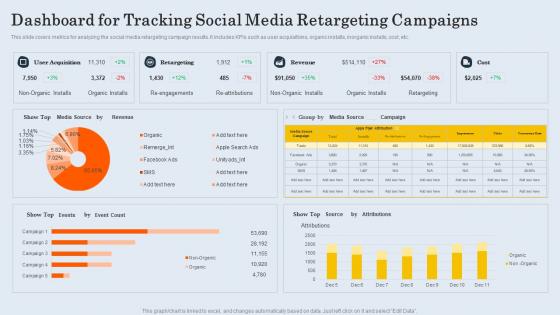 Dashboard For Tracking Social Media Retargeting Campaigns Customer Retargeting And Personalization
This slide covers metrics for analyzing the social media retargeting campaign results. It includes KPIs such as user acquisitions, organic installs, inorganic installs, cost, etc. Deliver an outstanding presentation on the topic using this Dashboard For Tracking Social Media Retargeting Campaigns Customer Retargeting And Personalization. Dispense information and present a thorough explanation of Organic Installs, Attributions, Impressions using the slides given. This template can be altered and personalized to fit your needs. It is also available for immediate download. So grab it now.
-
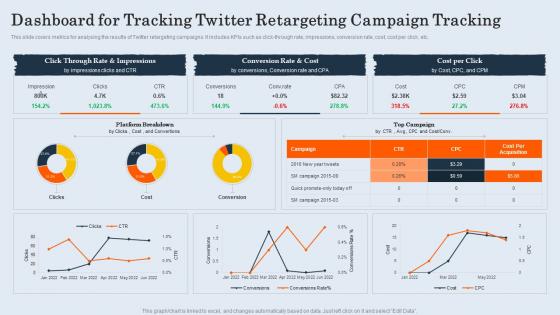 Dashboard Snapshot For Tracking Twitter Retargeting Campaign Tracking Customer Retargeting And Personalization
This slide covers metrics for analysing the results of Twitter retargeting campaigns. It includes KPIs such as clickthrough rate, impressions, conversion rate, cost, cost per click, etc. Present the topic in a bit more detail with this Dashboard Snapshot For Tracking Twitter Retargeting Campaign Tracking Customer Retargeting And Personalization. Use it as a tool for discussion and navigation on Rate Impressions, Conversion Rate, Cost Per. This template is free to edit as deemed fit for your organization. Therefore download it now.
-
 Sdlc Planning Project Management Dashboard Ppt Slides Graphics
This slide covers project evaluation dashboard including planning, design , development and testing for evaluating the project while proceeding to closure Present the topic in a bit more detail with this Sdlc Planning Project Management Dashboard Ppt Slides Graphics. Use it as a tool for discussion and navigation on Management, Dashboard, Planning. This template is free to edit as deemed fit for your organization. Therefore download it now.
-
 Todays Challenge Remove Complexity From Multi Cloud Performance Tracking Dashboard
This slide covers the Key performance indicators for tracking performance of the cloud such as violations break down, sources, rules and severity. Deliver an outstanding presentation on the topic using this Todays Challenge Remove Complexity From Multi Cloud Performance Tracking Dashboard. Dispense information and present a thorough explanation of Cloud Performance, Tracking Dashboard using the slides given. This template can be altered and personalized to fit your needs. It is also available for immediate download. So grab it now.
-
 Todays Challenge Remove Complexity Cost Management Dashboard In Cloud Management Platform
This slide covers dashboard platform for the resource organization, resource security, auditing, and cost. It also includes reporting, dashboards, budgets, optimizations, etc. Present the topic in a bit more detail with this Todays Challenge Remove Complexity Cost Management Dashboard In Cloud Management Platform. Use it as a tool for discussion and navigation on Cost Management, Dashboard, Cloud Management Platform. This template is free to edit as deemed fit for your organization. Therefore download it now.
-
 Construction Quality Assurance Dashboard With Customer Satisfaction Ratio
The following slide showcases dashboard of construction company exhibiting quality KPIs regarding safety, workmanship and customer satisfaction. Key indicators covered are site inspection success level, CSR, defect count, net promoter score, promotors, passives, defectors, total rework cost, safety meetings and average time taken to fix defects. Introducing our Construction Quality Assurance Dashboard With Customer Satisfaction Ratio set of slides. The topics discussed in these slides are Construction Quality Assurance, Dashboard, Customer Satisfaction Ratio. This is an immediately available PowerPoint presentation that can be conveniently customized. Download it and convince your audience.
-
 Dashboard Depicting Client And Employee Net Promoter Score
This slide shows dashboard depicting client and employee net promoter score NPS. It contains information about customer refer probability, recent service review and repeated use of service. Introducing our Dashboard Depicting Client And Employee Net Promoter Score set of slides. The topics discussed in these slides are Dashboard Depicting, Client And Employee, Net Promoter Score. This is an immediately available PowerPoint presentation that can be conveniently customized. Download it and convince your audience.
-
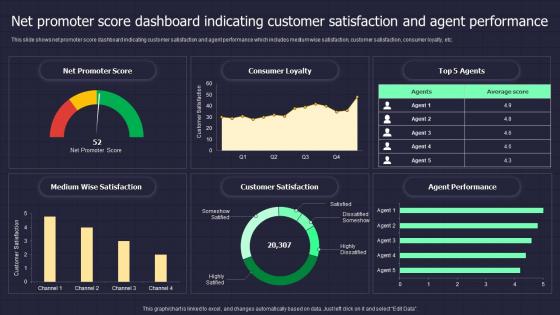 Net Promoter Score Dashboard Indicating Customer Satisfaction And Agent Performance
This slide shows net promoter score dashboard indicating customer satisfaction and agent performance which includes medium wise satisfaction, customer satisfaction, consumer loyalty, etc. Presenting our well structured Net Promoter Score Dashboard Indicating Customer Satisfaction And Agent Performance. The topics discussed in this slide are Net Promoter, Score Dashboard, Indicating Customer, Satisfaction And Agent. This is an instantly available PowerPoint presentation that can be edited conveniently. Download it right away and captivate your audience.
-
 Cost And Time Estimation Dashboard For Project Management
This slide represents the dashboard for cost and time estimation of the organizational product which gives a clear view of the health, time, tasks, cost, progress rate and completion of project status to help the management to effectively estimate its success or failure and make changes accordingly. Presenting our well structured Cost And Time Estimation Dashboard For Project Management. The topics discussed in this slide are Cost And Time, Estimation Dashboard, For Project Management. This is an instantly available PowerPoint presentation that can be edited conveniently. Download it right away and captivate your audience.
-
 Project Management Weekly Status Report Dashboard
This slide represents a dashboard representing the weekly status report of an IT project prepared by the project management team. It includes details related to ongoing activities, top issues, breakdown chart, project plana and timeline and outstanding issues of the project. Presenting our well structured Project Management Weekly Status Report Dashboard. The topics discussed in this slide are Project Management, Weekly Status, Report Dashboard. This is an instantly available PowerPoint presentation that can be edited conveniently. Download it right away and captivate your audience.
-
 Dashboard Indicating Online Store Accounts Overview Practices For Enhancing Financial Administration Ecommerce
The following slide showcases ecommerce accounts management dashboard. It provides information about income, expenses, cash collected, cash spent, tax collected, tax claim, stock sold, invoice, etc. Deliver an outstanding presentation on the topic using this Dashboard Indicating Online Store Accounts Overview Practices For Enhancing Financial Administration Ecommerce. Dispense information and present a thorough explanation of Dashboard, Accounts Overview, Expense Summary using the slides given. This template can be altered and personalized to fit your needs. It is also available for immediate download. So grab it now.
-
 Dashboard To Assess Ecommerce Financial Practices For Enhancing Financial Administration Ecommerce
This slide showcases ecommerce key performance indicators KPI dashboard with financial statement. It provides information about total sales, orders, net profit, net profit margin, average order value, channels, etc. Present the topic in a bit more detail with this Dashboard To Assess Ecommerce Financial Practices For Enhancing Financial Administration Ecommerce. Use it as a tool for discussion and navigation on Dashboard, Financial, Performance. This template is free to edit as deemed fit for your organization. Therefore download it now.
-
 Ecommerce Kpi Dashboard With P And L Statement Practices For Enhancing Financial Administration Ecommerce
This slide showcases ecommerce key performance indicators KPI dashboard with financial statement. It provides information about total sales, orders, net profit, net profit margin, average order value, channels, etc. Deliver an outstanding presentation on the topic using this Ecommerce Kpi Dashboard With P And L Statement Practices For Enhancing Financial Administration Ecommerce. Dispense information and present a thorough explanation of Ecommerce, Dashboard, Statement using the slides given. This template can be altered and personalized to fit your needs. It is also available for immediate download. So grab it now.
-
 Dashboard To Analyze Flexible Working Strategies Impact Implementing Flexible Working Policy
The following slide delineates a key performance indicator KPI dashboard through which managers can evaluate the success of a flexible working policy on workforce performance. The major KPIs are absenteeism rate, overall labor effectiveness etc. Present the topic in a bit more detail with this Dashboard To Analyze Flexible Working Strategies Impact Implementing Flexible Working Policy. Use it as a tool for discussion and navigation on Dashboard, Analyze Flexible, Working Strategies. This template is free to edit as deemed fit for your organization. Therefore download it now.
-
 Work From Home Performance Management Dashboard Implementing Flexible Working Policy
The following slide outlines a comprehensive key performance indicator KPI dashboard that can be used to showcase employees performance during work from home WFH. Information covered in this slide is related to average result area scores etc. Present the topic in a bit more detail with this Work From Home Performance Management Dashboard Implementing Flexible Working Policy. Use it as a tool for discussion and navigation on Home Performance, Management Dashboard. This template is free to edit as deemed fit for your organization. Therefore download it now.
-
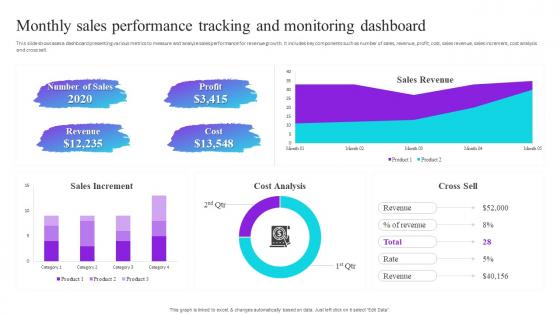 Monthly Sales Performance Tracking And Monitoring Dashboard Process Improvement Plan
This slide showcases a dashboard presenting various metrics to measure and analyze sales performance for revenue growth. It includes key components such as number of sales, revenue, profit, cost, sales revenue, sales increment, cost analysis and cross sell. Present the topic in a bit more detail with this Monthly Sales Performance Tracking And Monitoring Dashboard Process Improvement Plan. Use it as a tool for discussion and navigation on Sales Increment, Sales Performance, Monitoring Dashboard. This template is free to edit as deemed fit for your organization. Therefore download it now.
-
 Social Media Performance Tracking And Monitoring Dashboard Process Improvement Plan
The following slide showcases a dashboard to track and measure social media platforms performance. It includes key elements such as website traffic, social media referral rate, site revenue, social media site revenue, etc. Present the topic in a bit more detail with this Social Media Performance Tracking And Monitoring Dashboard Process Improvement Plan. Use it as a tool for discussion and navigation on Social Media, Performance Tracking, Monitoring Dashboard. This template is free to edit as deemed fit for your organization. Therefore download it now.
-
 Website Performance Tracking And Monitoring Dashboard Process Improvement Plan
The following slide showcases a dashboard to track and measure website performance. It includes key elements such as visits, average session duration, bounce rate, page views, goal conversion, visits by week, traffic sources, top channels by conversions, etc. Present the topic in a bit more detail with this Website Performance Tracking And Monitoring Dashboard Process Improvement Plan. Use it as a tool for discussion and navigation on Website Performance Tracking, Monitoring Dashboard. This template is free to edit as deemed fit for your organization. Therefore download it now.
-
 Dashboard To Monitor Bank Transactions And Activities Developing Anti Money Laundering And Monitoring System
This slide showcases dashboard to review bank transactions and activities. It provides information about credit, check, ATM, debit card, transaction volume, decline rate, visa, maestro, network end points, etc. Deliver an outstanding presentation on the topic using this Dashboard To Monitor Bank Transactions And Activities Developing Anti Money Laundering And Monitoring System. Dispense information and present a thorough explanation of Dashboard, Transactions, Information using the slides given. This template can be altered and personalized to fit your needs. It is also available for immediate download. So grab it now.
-
 Developing Anti Money Laundering And Monitoring System Dashboard For Monitoring Fraud And Money
This slide showcases dashboard for monitoring fraudulent and money laundering transactions. It provides information about legitimacy, total transaction, unusual transactions, bank, client, investigation, in peer review, etc. Present the topic in a bit more detail with this Developing Anti Money Laundering And Monitoring System Dashboard For Monitoring Fraud And Money. Use it as a tool for discussion and navigation on Laundering Transactions, Dashboard, Monitoring. This template is free to edit as deemed fit for your organization. Therefore download it now.


