Powerpoint Templates and Google slides for Dash
Save Your Time and attract your audience with our fully editable PPT Templates and Slides.
-
 KPI Dashboard Showcasing Real Time Status Of Role Of IoT In Enhancing Waste IoT SS
This slide exhibits the real time performance of waste collection and management vehicles providing valuable insights for operational decision making. It includes elements such as fleet status, vehicle halt area, fleet usage, job status, etc. Present the topic in a bit more detail with this KPI Dashboard Showcasing Real Time Status Of Role Of IoT In Enhancing Waste IoT SS. Use it as a tool for discussion and navigation on Vehicle Halt Area, Fleet Status, Completed Error. This template is free to edit as deemed fit for your organization. Therefore download it now.
-
 Digital Production Process Performance Management Dashboard Enabling Smart Production DT SS
This slide showcases production process performance management dashboard. It provides information about factories, robotic arms, assembly lines, active workers, availability, quality, performance, etc. Present the topic in a bit more detail with this Digital Production Process Performance Management Dashboard Enabling Smart Production DT SS Use it as a tool for discussion and navigation on Production Process, Performance Management This template is free to edit as deemed fit for your organization. Therefore download it now.
-
 KPI Dashboard To Assess Impact Of Technology Implementation Enabling Smart Production DT SS
This slide covers dashboard to assess technology integration impact on production performance. It involves KPIs such as impact on labor and manufacturing cost, performance, quality and overall equipment effectiveness. Present the topic in a bit more detail with this KPI Dashboard To Assess Impact Of Technology Implementation Enabling Smart Production DT SS Use it as a tool for discussion and navigation on Availability, Performance, Overall Equipment Effectiveness This template is free to edit as deemed fit for your organization. Therefore download it now.
-
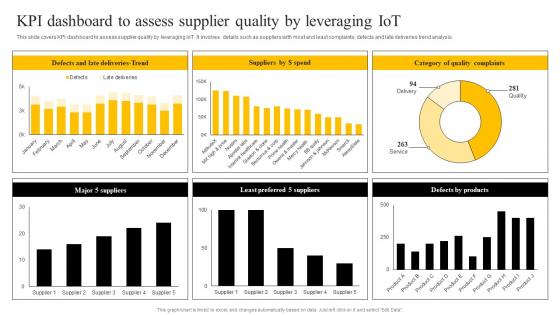 KPI Dashboard To Assess Supplier Quality By Leveraging IOT Enabling Smart Production DT SS
This slide covers KPI dashboard to assess supplier quality by leveraging IoT. It involves details such as suppliers with most and least complaints, defects and late deliveries trend analysis. Deliver an outstanding presentation on the topic using this KPI Dashboard To Assess Supplier Quality By Leveraging IOT Enabling Smart Production DT SS Dispense information and present a thorough explanation of Deliveries Trend, Quality Complaints, KPI Dashboard using the slides given. This template can be altered and personalized to fit your needs. It is also available for immediate download. So grab it now.
-
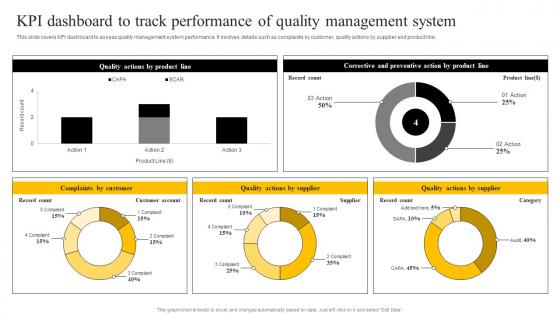 KPI Dashboard To Track Performance Of Quality Management System Enabling Smart Production DT SS
This slide covers KPI dashboard to assess quality management system performance. It involves details such as complaints by customer, quality actions by supplier and product line. Present the topic in a bit more detail with this KPI Dashboard To Track Performance Of Quality Management System Enabling Smart Production DT SS Use it as a tool for discussion and navigation on Quality Actions, Complaints By Customer, Product Line This template is free to edit as deemed fit for your organization. Therefore download it now.
-
 Overdue accounts receivable KPI dashboard
This slide shows analytical dashboard for outstanding receivables. The purpose of this slide is to provide insights regarding overdue payments, sales progress and day sales outstanding. It covers various metrics such as net sales, overdue accounts receivable, cash flow, aging report, etc.Presenting our well structured Overdue accounts receivable KPI dashboard. The topics discussed in this slide are Overdue Receivables Report, Receivable Overdue Aging, Overdue Receivable. This is an instantly available PowerPoint presentation that can be edited conveniently. Download it right away and captivate your audience.
-
 IoT Platforms For Smart Device IoT Platform Performance Monitoring Dashboard
This slide showcases the performance tracking dashboard for IoT platforms. The purpose of this slide is to highlight the performance of IoT platforms by including components such as downtime by duration, true efficiency, etc. Deliver an outstanding presentation on the topic using this IoT Platforms For Smart Device IoT Platform Performance Monitoring Dashboard. Dispense information and present a thorough explanation of IoT Platform Performance, Monitoring Dashboard, Downtime By Duration, True Efficiency using the slides given. This template can be altered and personalized to fit your needs. It is also available for immediate download. So grab it now.
-
 Performance Testing Strategies To Boost Performance Testing Progress Tracking Dashboard
This slide depicts the dashboard to test the performance of the software. The purpose of this slide is to cover the details of test case status, requirement base suite, defects status, bugs linked to requirements, test case linked requirements, etc. Deliver an outstanding presentation on the topic using this Performance Testing Strategies To Boost Performance Testing Progress Tracking Dashboard. Dispense information and present a thorough explanation of Performance Testing Progress, Tracking Dashboard, Test Case Linked Requirements, Requirement Base Suite using the slides given. This template can be altered and personalized to fit your needs. It is also available for immediate download. So grab it now.
-
 Fulfillment Center Optimization Dashboard Tracking Warehouse Capacity And Utilization Metrics
This slide represents a dashboard providing an enterprise-level view of warehouse capacity and utilization to enable process improvements. It monitors KPIs such as shelf capacity used by inventory type, storage device, honeycomb percentage, days on hand by inventory type, and by items. Deliver an outstanding presentation on the topic using this Fulfillment Center Optimization Dashboard Tracking Warehouse Capacity And Utilization Metrics Dispense information and present a thorough explanation of Inventory Type, Shelf Capacity, Storage Device using the slides given. This template can be altered and personalized to fit your needs. It is also available for immediate download. So grab it now.
-
 Fulfillment Center Optimization Warehouse Fleet And Transportation Performance Analytics Dashboard
This slide represents a warehouse fleet and transportation management dashboard to visualize and optimize logistics operations through advanced data analyses. It monitors KPIs such as fleet status, delivery status, deliveries by location, average delivery time hours0 And route Km, loading time And weight, and profit by location. Deliver an outstanding presentation on the topic using this Fulfillment Center Optimization Warehouse Fleet And Transportation Performance Analytics Dashboard Dispense information and present a thorough explanation of Course Topics, Course Duration, Course Description using the slides given. This template can be altered and personalized to fit your needs. It is also available for immediate download. So grab it now.
-
 Digital Marketing Campaign Performance Analytics Dashboard
This slide depicts analysis of marketing campaign performance analytics for measuring customer involvement with campaign. It includes parameters such as visitors, leads, total revenue, bounce rate, customer churn rate, order value, customer life time value etc. Presenting our well structured Digital Marketing Campaign Performance Analytics Dashboard. The topics discussed in this slide are Annual Recurring Revenue, Customer Lifetime Value, Completed Transactions. This is an instantly available PowerPoint presentation that can be edited conveniently. Download it right away and captivate your audience.
-
 Ad Tech Dashboard Software To Measure Marketing Strategy Performance
This slide highlights the Ad Tech dashboard software to measure the performance of business advertising strategies. The purpose of template slide is to measure the effectiveness of business advertising strategies in order to identify improvements. It includes elements such as total impressions generated, relevance score, etc. Introducing our Ad Tech Dashboard Software To Measure Marketing Strategy Performance set of slides. The topics discussed in these slides are Dashboard, Measure, Marketing. This is an immediately available PowerPoint presentation that can be conveniently customized. Download it and convince your audience.
-
 Dashboard For Front End Development Data Analysis
This slide depicts front end development dashboard which helps managers with data-driven insights and decision-making processes. It includes pointers such as total users, average clicks, monthly expenses and page views. Presenting our well structured Dashboard For Front End Development Data Analysis. The topics discussed in this slide are Front End Development, Data Analysis. This is an instantly available PowerPoint presentation that can be edited conveniently. Download it right away and captivate your audience.
-
 Chef Automation Dashboard To Track System Performance
This slide represents chef automation tool dashboard to display the key metrics and also helps to keep track of chef runs and performances. It includes key metrics such as average execution time, elapsed time, chef resources total, etc. Introducing our Chef Automation Dashboard To Track System Performance set of slides. The topics discussed in these slides are Infrastructure Changes, Resources Updated, Execution Time. This is an immediately available PowerPoint presentation that can be conveniently customized. Download it and convince your audience.
-
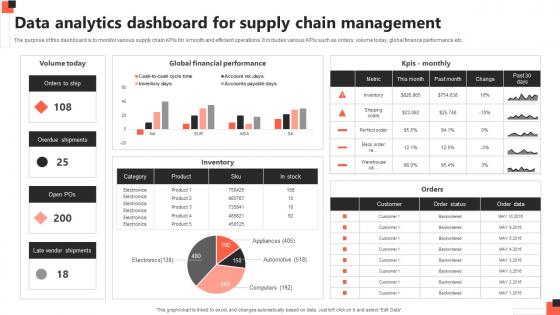 Data Analytics Dashboard For Supply Chain Management
The purpose of this dashboard is to monitor various supply chain KPIs for smooth and efficient operations. It includes various KPIs such as orders, volume today, global finance performance etc. Introducing our Data Analytics Dashboard For Supply Chain Management set of slides. The topics discussed in these slides are Volume Today, Global Financial Performance, Inventory. This is an immediately available PowerPoint presentation that can be conveniently customized. Download it and convince your audience.
-
 Cultural Kpi Dashboard Cultural Change Management For Business Growth And Development CM SS
This slide represents dashboard to measure impact of cultural changes on organization. It includes details related to KPIs such as engagement scores, communication, growth, alignment etc. Present the topic in a bit more detail with this Cultural Kpi Dashboard Cultural Change Management For Business Growth And Development CM SS. Use it as a tool for discussion and navigation on Dashboard, Management, Engagement Scores. This template is free to edit as deemed fit for your organization. Therefore download it now.
-
 Kpi Dashboard Highlighting Impact Of Cultural Change Management For Growth And Development CM SS
This slide represents dashboard to measure impact of cultural changes on employee engagement rates. It includes details related to KPIs such as average engagement scores of teams such as finance, marketing etc. Deliver an outstanding presentation on the topic using this Kpi Dashboard Highlighting Impact Of Cultural Change Management For Growth And Development CM SS. Dispense information and present a thorough explanation of Management, Engagement, Dashboard using the slides given. This template can be altered and personalized to fit your needs. It is also available for immediate download. So grab it now.
-
 KPI Dashboard To Evaluate Energy Green Advertising Campaign Launch Process MKT SS V
The following slide depicts dashboard to measure energy utilization during the year at workplace to gain operational efficiency and develop smart ways to save for future. It includes elements such as progress by segment, transport, waste management, packaging, warehousing etc. Present the topic in a bit more detail with this KPI Dashboard To Evaluate Energy Green Advertising Campaign Launch Process MKT SS V. Use it as a tool for discussion and navigation on Business Activity Type, Comparative Assessment, Sustainability Pledges. This template is free to edit as deemed fit for your organization. Therefore download it now.
-
 KPI Dashboard For Service Level Agreement Report
This slide depicts various KPIs for SLAs and provides details about company overview to identify errors for improvement to increase efficiency. It includes elements such as critical, high, etc. Introducing our KPI Dashboard For Service Level Agreement Report set of slides. The topics discussed in these slides are Overdue, Improve SLA Overview, Company This is an immediately available PowerPoint presentation that can be conveniently customized. Download it and convince your audience.
-
 Digital Marketing Dashboard Increasing Patient Volume With Healthcare Strategy SS V
The following slide outlines performance KPI dashboard through which healthcare brands can evaluate online marketing campaign performance on business. The metrics mentioned in slide are Google ads, Facebook ads, Instagram ads, conversions, sessions, cost per click CPC, etc. Present the topic in a bit more detail with this Digital Marketing Dashboard Increasing Patient Volume With Healthcare Strategy SS V. Use it as a tool for discussion and navigation on Google Ads, Facebook, Conversions. This template is free to edit as deemed fit for your organization. Therefore download it now.
-
 Healthcare Marketing Dashboard Measure Increasing Patient Volume With Healthcare Strategy SS V
The following slide outlines comprehensive dashboard through which medical care companies can evaluate patient experience and make more informed decisions. The metrics outlined in slide are lab test, patient falls, average waiting time, etc. Deliver an outstanding presentation on the topic using this Healthcare Marketing Dashboard Measure Increasing Patient Volume With Healthcare Strategy SS V. Dispense information and present a thorough explanation of Patient Satisfaction, Average Waiting Times, Patient Falls using the slides given. This template can be altered and personalized to fit your needs. It is also available for immediate download. So grab it now.
-
 Hospital KPI Dashboard Average Waiting Increasing Patient Volume With Healthcare Strategy SS V
The following slide outlines key performance indicator KPI dashboard that can be used by healthcare professionals to evaluate hospital performance. The metrics outlined in slide are total patients, average treatment costs, available staff, patients by division, etc. Present the topic in a bit more detail with this Hospital KPI Dashboard Average Waiting Increasing Patient Volume With Healthcare Strategy SS V. Use it as a tool for discussion and navigation on Patients Admitted, Treatment Costs, Total Patients. This template is free to edit as deemed fit for your organization. Therefore download it now.
-
 Dashboard For Tracking Facebook Post Performance Facebook Advertising Strategy SS V
The following slide outlines dashboard through which advertisers can manage Facebook post performance and optimize their marketing strategy. Information covered in this slide is related to key metrics such as impressions per post, engagement rate, click-through rate CTR, likes, etc. Present the topic in a bit more detail with this Dashboard For Tracking Facebook Post Performance Facebook Advertising Strategy SS V Use it as a tool for discussion and navigation on Dashboard, Tracking Facebook, Post Performance This template is free to edit as deemed fit for your organization. Therefore download it now.
-
 Facebook Ads Dashboard With Campaign Performance Facebook Advertising Strategy SS V
The following slide outlines comprehensive dashboard through which advertisers can monitor Facebook ads performance. The KPIs outlined in slide are ad spend, conversions, cost per conversion, cost per action, brand impressions, clicks, etc. Deliver an outstanding presentation on the topic using this Facebook Ads Dashboard With Campaign Performance Facebook Advertising Strategy SS V Dispense information and present a thorough explanation of Generating, Facebook, Campaign Performance using the slides given. This template can be altered and personalized to fit your needs. It is also available for immediate download. So grab it now.
-
 Kpi Dashboard To Monitor Facebook Marketing Strategy Facebook Advertising Strategy SS V
The following slide outlines key performance indicator KPI dashboard which can be used to evaluate Facebook advertisement performance. The metrics mentioned in slide are total fans, page views, total actions, post likes, audience growth, fans by language, etc. Present the topic in a bit more detail with this Kpi Dashboard To Monitor Facebook Marketing Strategy Facebook Advertising Strategy SS V Use it as a tool for discussion and navigation on KPI Dashboard, Monitor Facebook, Marketing Strategy This template is free to edit as deemed fit for your organization. Therefore download it now.
-
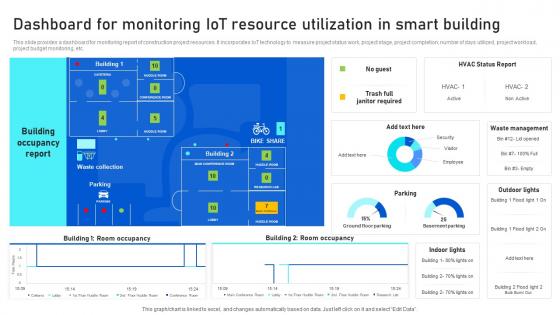 Dashboard For Monitoring IoT Resource Utilization Analyzing IoTs Smart Building IoT SS
This slide provides a dashboard for monitoring report of construction project resources. It incorporates IoT technology to measure project status work, project stage, project completion, number of days utilized, project workload, project budget monitoring, etc. Present the topic in a bit more detail with this Dashboard For Monitoring IoT Resource Utilization Analyzing IoTs Smart Building IoT SS. Use it as a tool for discussion and navigation on Monitoring, Resource, Utilization. This template is free to edit as deemed fit for your organization. Therefore download it now.
-
 Dashboard For Monitoring Smart Building Worker Analyzing IoTs Smart Building IoT SS
This slide includes a dashboard for tracking worker progress and productivity in a smart building project. It provides metrics for tracking active workers, safety score, energy utilization, oxygen level, humidity, temperature, water utilization, etc. Deliver an outstanding presentation on the topic using this Dashboard For Monitoring Smart Building Worker Analyzing IoTs Smart Building IoT SS. Dispense information and present a thorough explanation of Monitoring, Building, Worker using the slides given. This template can be altered and personalized to fit your needs. It is also available for immediate download. So grab it now.
-
 IoT Platform Dashboard For Tracking Smart Analyzing IoTs Smart Building IoT SS
This slide provides a platform dashboard of a utilizes IoT technology for tracking workplace optimization. It includes KPIs for monitoring building visitors, energy consumption report, current building temperature, coffee consumption, room occupancy, etc. Present the topic in a bit more detail with this IoT Platform Dashboard For Tracking Smart Analyzing IoTs Smart Building IoT SS. Use it as a tool for discussion and navigation on Tracking, Workplace, Registered. This template is free to edit as deemed fit for your organization. Therefore download it now.
-
 Analyzing Performance Of Closed Sales Deal Dashboard Top Sales Closing Techniques SA SS
Following slide highlights dashboard to monitor closed sales deal of company that helps to make decisions on improving performance. It includes pipeline metrics such as won deals, lost deals, days to close, conversion rates, etc. Present the topic in a bit more detail with this Analyzing Performance Of Closed Sales Deal Dashboard Top Sales Closing Techniques SA SS. Use it as a tool for discussion and navigation on Deal Value, Deal Lost Reason. This template is free to edit as deemed fit for your organization. Therefore download it now.
-
 Dashboard To Track Close Sales Activities Of Company Top Sales Closing Techniques SA SS
Following slide represents dashboard of company that helps to track closing sales activities and rate. It includes indicators such as close rate, amount closed, deal stages, activities due, activities completed, etc. Deliver an outstanding presentation on the topic using this Dashboard To Track Close Sales Activities Of Company Top Sales Closing Techniques SA SS. Dispense information and present a thorough explanation of Dashboard To Track Close, Sales Activities Of Company using the slides given. This template can be altered and personalized to fit your needs. It is also available for immediate download. So grab it now.
-
 Farm Produce Marketing Approach Dashboard Depicting Production In Global Food Market Strategy SS V
This slide provides an overview of the dashboard that exhibits the situation of the global food market. It includes production, import, exports information for wheat, maize, rice and soybean. Present the topic in a bit more detail with this Farm Produce Marketing Approach Dashboard Depicting Production In Global Food Market Strategy SS V. Use it as a tool for discussion and navigation on Dashboard Depicting Production, Global Food Market, Closing Stocks And Ratios. This template is free to edit as deemed fit for your organization. Therefore download it now.
-
 Farm Produce Marketing Approach Farm Management Dashboard Depicting Production Strategy SS V
This slide showcases the dashboard depicting data related to the production of fruits. The dashboard includes area, last production, air temperature, water content, pH value and financial statistics. Deliver an outstanding presentation on the topic using this Farm Produce Marketing Approach Farm Management Dashboard Depicting Production Strategy SS V. Dispense information and present a thorough explanation of Farm Management, Dashboard Depicting Production, Air Temperature, Financial Statistics using the slides given. This template can be altered and personalized to fit your needs. It is also available for immediate download. So grab it now.
-
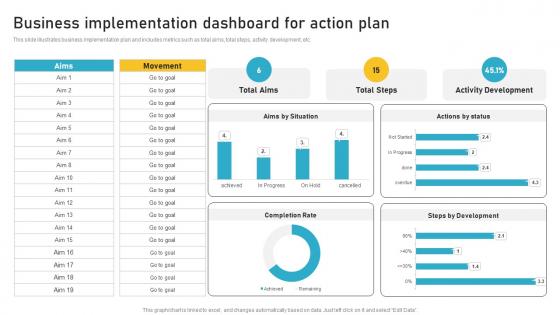 Business Implementation Dashboard For Action Plan
This slide illustrates business implementation plan and includes metrics such as total aims, total steps, activity development, etc. Presenting our well structured Business Implementation Dashboard For Action Plan. The topics discussed in this slide are Activity Development, Actions By Status, Aims By Situation. This is an instantly available PowerPoint presentation that can be edited conveniently. Download it right away and captivate your audience.
-
 Implementation Plan Dashboard For Real Time Monitoring
This slide illustrates implementation plan KPI or dashboard and includes metrics such as improving effectiveness, customer satisfaction, etc. Presenting our well structured Implementation Plan Dashboard For Real Time Monitoring. The topics discussed in this slide are Improving Effectiveness, Customer Satisfaction, Process Efficiency. This is an instantly available PowerPoint presentation that can be edited conveniently. Download it right away and captivate your audience.
-
 Customer Profile Tracking Dashboard For Sales Reporting Ensuring Excellence Through Sales Automation Strategies
This slide features a dashboard focused on tracking and reporting customer profiles in sales, aiding in comprehensive sales reporting and analysis. Present the topic in a bit more detail with this Customer Profile Tracking Dashboard For Sales Reporting Ensuring Excellence Through Sales Automation Strategies Use it as a tool for discussion and navigation on Customer Profile, Tracking Dashboard, Sales Reporting This template is free to edit as deemed fit for your organization. Therefore download it now.
-
 KPI Dashboard For Reporting Sales Qualification Ensuring Excellence Through Sales Automation Strategies
This slide showcases a dashboard designed to report and evaluate sales qualifications using relevant KPIs for effective decision making. Present the topic in a bit more detail with this KPI Dashboard For Reporting Sales Qualification Ensuring Excellence Through Sales Automation Strategies Use it as a tool for discussion and navigation on Estimated Revenue, Deals Won, Deals Lost This template is free to edit as deemed fit for your organization. Therefore download it now.
-
 Firewall As A Service Performance Tracking Dashboard Firewall Virtualization
This slide represents the dashboard to track the performance of Firewall-as-a-Service deployed by different organizations. The purpose of this slide is to showcase the overall performance of FWaaS by demonstrating statistics of monthly threat status, etc. Present the topic in a bit more detail with this Firewall As A Service Performance Tracking Dashboard Firewall Virtualization. Use it as a tool for discussion and navigation on Current Risk Status, Threat Status, Threat Report. This template is free to edit as deemed fit for your organization. Therefore download it now.
-
 Customer Relationship Management Dashboard To Enhance Enabling Smart Shopping DT SS V
This slide covers CRM software dashboard to track buyer journey and enhance user experience. It involves number of new contacts, total number of emails sent, revenue graph and task report Present the topic in a bit more detail with this Customer Relationship Management Dashboard To Enhance Enabling Smart Shopping DT SS V Use it as a tool for discussion and navigation on Quarterly Revenue Graph, Deals Funnel, Task Report This template is free to edit as deemed fit for your organization. Therefore download it now.
-
 Dashboard To Track Customer Satisfaction Rate Enabling Smart Shopping DT SS V
This slide covers KPI dashboard to track customer satisfaction rate. It involves number of queries resolved on email and chat to improve customer experience and reduce waiting time. Deliver an outstanding presentation on the topic using this Dashboard To Track Customer Satisfaction Rate Enabling Smart Shopping DT SS V Dispense information and present a thorough explanation of Response Time, Track Customer, Satisfaction Rate using the slides given. This template can be altered and personalized to fit your needs. It is also available for immediate download. So grab it now.
-
 KPI Dashboard To Track Customer Support Performance Enabling Smart Shopping DT SS V
This slide covers KPI dashboard to track customer service performance and enhance customer satisfaction rate. It involves total solved tickets, weekly chat status and number of visitors. Present the topic in a bit more detail with this KPI Dashboard To Track Customer Support Performance Enabling Smart Shopping DT SS V Use it as a tool for discussion and navigation on Self Serve Performance, Customer Support Performance This template is free to edit as deemed fit for your organization. Therefore download it now.
-
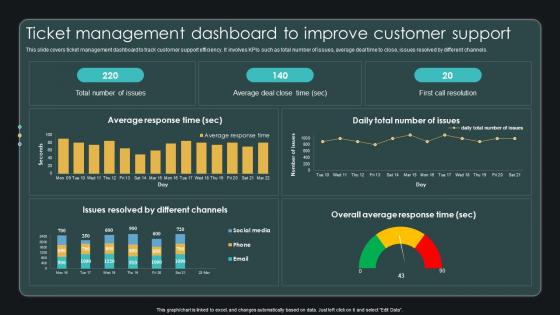 Ticket Management Dashboard To Improve Customer Support Enabling Smart Shopping DT SS V
This slide covers ticket management dashboard to track customer support efficiency. It involves KPIs such as total number of issues, average deal time to close, issues resolved by different channels. Deliver an outstanding presentation on the topic using this Ticket Management Dashboard To Improve Customer Support Enabling Smart Shopping DT SS V Dispense information and present a thorough explanation of Average Response, Different Channels, Overall Average using the slides given. This template can be altered and personalized to fit your needs. It is also available for immediate download. So grab it now.
-
 Dashboard To Track Product Training KPIs Agile Product Owner Training Manual DTE SS
The purpose of the following slide is to represent product training KPIs to analyze expenditure and time consumed. It includes participants, cost per hour, etc. Present the topic in a bit more detail with this Dashboard To Track Product Training KPIs Agile Product Owner Training Manual DTE SS. Use it as a tool for discussion and navigation on Training Evaluation Score, Knowledge Retention Rate, Actual Cost Vs Budget. This template is free to edit as deemed fit for your organization. Therefore download it now.
-
 Dashboard To Track Product Training Satisfaction Rate Agile Product Owner Training Manual DTE SS
The following slide showcases a dashboard to measure outcomes of product training satisfaction survey. It includes elements such as product backlog management, release planning, etc. Deliver an outstanding presentation on the topic using this Dashboard To Track Product Training Satisfaction Rate Agile Product Owner Training Manual DTE SS. Dispense information and present a thorough explanation of Product Backlog Management, Release Planning, Product Knowledge using the slides given. This template can be altered and personalized to fit your needs. It is also available for immediate download. So grab it now.
-
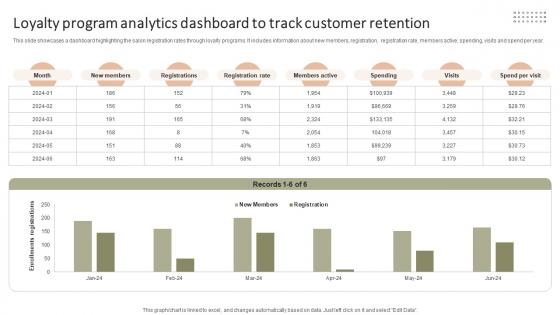 Loyalty Program Analytics Dashboard To Improving Client Experience And Sales Strategy SS V
This slide showcases a dashboard highlighting the salon registration rates through loyalty programs. It includes information about new members, registration, registration rate, members active, spending, visits and spend per year. Present the topic in a bit more detail with this Loyalty Program Analytics Dashboard To Improving Client Experience And Sales Strategy SS V. Use it as a tool for discussion and navigation on Registration Rate, Members Active, Registrations. This template is free to edit as deemed fit for your organization. Therefore download it now.
-
 Dashboard To Evaluate Digital Transformation Process Effective Corporate Digitalization Techniques
This slide showcases the KPIs that would help a business organization to evaluate improvements in the new digital transformation process. It includes strategy, data, digital vitality score, organizational alignment, etc. Deliver an outstanding presentation on the topic using this Dashboard To Evaluate Digital Transformation Process Effective Corporate Digitalization Techniques. Dispense information and present a thorough explanation of Customer Experience, Organizational Alignment, Strategy using the slides given. This template can be altered and personalized to fit your needs. It is also available for immediate download. So grab it now.
-
 Dashboard To Track Online Sales Sales Improvement Strategies For Ecommerce Website
Following slide exhibits dashboard that help organizations to measure performance of online sales. It include parameters such as number of new customers, sales revenue, profit, sales growth rate, customer acquisition cost etc. Present the topic in a bit more detail with this Dashboard To Track Online Sales Sales Improvement Strategies For Ecommerce Website. Use it as a tool for discussion and navigation on Sales Revenue, Sales Target, Sales Country. This template is free to edit as deemed fit for your organization. Therefore download it now.
-
 KPI Dashboard To Measure Online Sales Improvement Strategies For Ecommerce Website
Following slide exhibits dashboard to track and measure performance of online shopping website of company. It include indicators such as sales, gross profit, conversion rates, site traffic, number of shares and transactions etc. Present the topic in a bit more detail with this KPI Dashboard To Measure Online Sales Improvement Strategies For Ecommerce Website. Use it as a tool for discussion and navigation on Cross Profit, Conversion Rate, Order Size. This template is free to edit as deemed fit for your organization. Therefore download it now.
-
 KPI Dashboard To Track Offline Referral Marketing Plan To Increase Brand Strategy SS V
This slide shows dashboard which can be used by organizations to measure performance of traditional marketing. It includes metrics such as customer conversion rate, new customers, sales, and brand awareness. Present the topic in a bit more detail with this KPI Dashboard To Track Offline Referral Marketing Plan To Increase Brand Strategy SS V. Use it as a tool for discussion and navigation on Customer Conversion, New Customers, Brand Awareness. This template is free to edit as deemed fit for your organization. Therefore download it now.
-
 RFM Analysis Dashboard Showcasing Company Sales
This slide depicts dashboard highlighting company sales to optimize marketing strategies by visually presenting customer sales data based on recency, frequency, and monetary value. Introducing our RFM Analysis Dashboard Showcasing Company Sales set of slides. The topics discussed in these slides are RFM Analysis Dashboard, Showcasing Company Sales, Frequency, Monetary Value. This is an immediately available PowerPoint presentation that can be conveniently customized. Download it and convince your audience.
-
 EDR Dashboard Insights For Malware Detection And Prevention
This slide illustrates EDR dashboard and includes triggered techniques, malicious events, and high-risk assets. Presenting our well structured EDR Dashboard Insights For Malware Detection And Prevention. The topics discussed in this slide are EDR Dashboard Insights, Malware Detection And Prevention, Triggered Techniques, Malicious Events. This is an instantly available PowerPoint presentation that can be edited conveniently. Download it right away and captivate your audience.
-
 Malware Detection Endpoint Response Dashboard
This slide illustrates KPI or dashboard of EDR and includes malware infections, malware categories, top malware files, and malware infections by score. Introducing our Malware Detection Endpoint Response Dashboard set of slides. The topics discussed in these slides are Malware Detection, Endpoint Response Dashboard, Malware Infections, Malware Categories. This is an immediately available PowerPoint presentation that can be conveniently customized. Download it and convince your audience.
-
 Implementing Workforce Analytics Dashboard For Assessing Workforce Efficiency Post Data Analytics SS
This slide showcases dashboard illustrating workforce performance efficiency which helps in in tracking employee productivity levels in business. It provides information regarding corporate performance, employee productivity, project achievement, overtime hours, overall labor effectiveness etc. Deliver an outstanding presentation on the topic using this Implementing Workforce Analytics Dashboard For Assessing Workforce Efficiency Post Data Analytics SS. Dispense information and present a thorough explanation of Dashboard For Assessing Workforce, Post Strategy Implementation, Employee Productivity, Project Achievement using the slides given. This template can be altered and personalized to fit your needs. It is also available for immediate download. So grab it now.
-
 Implementing Workforce Analytics Dashboard To Monitor Employee Performance Post Data Analytics SS
This slide represents dashboard for tracking employee productivity post workload management which helps in assessing workforce activity schedule to optimize performance. It provides information regarding KPI metrics such as working times, projects, tracked time, productivity growth, overall employee effectiveness. Present the topic in a bit more detail with this Implementing Workforce Analytics Dashboard To Monitor Employee Performance Post Data Analytics SS. Use it as a tool for discussion and navigation on Dashboard To Monitor, Employee Performance, Post Workload Management, Tracked Time, Productivity Growth. This template is free to edit as deemed fit for your organization. Therefore download it now.
-
 Implementing Workforce Analytics Employee Engagement Dashboard Post Strategy Data Analytics SS
This slide showcases dashboard for tracking employee engagement post deployment of improvement strategies. It provides information regarding KPI metrics such as engagement, burnout risk, turnover risk, satisfaction, professional growth, alignment, autonomy and organization support. Deliver an outstanding presentation on the topic using this Implementing Workforce Analytics Employee Engagement Dashboard Post Strategy Data Analytics SS. Dispense information and present a thorough explanation of Employee Engagement Dashboard, Post Strategy Implementation, Professional Growth, Alignment using the slides given. This template can be altered and personalized to fit your needs. It is also available for immediate download. So grab it now.
-
 Monthly Sales Dashboard With Revenue B2B Outside Sales Strategy Development SA SS
This slide showcases a sales dashboard that provides the team with real time view of their performance by displaying key metrics such as total accounts, orders per month, average contract, growth rate, sales growth by market segment, etc. Present the topic in a bit more detail with this Monthly Sales Dashboard With Revenue B2B Outside Sales Strategy Development SA SS. Use it as a tool for discussion and navigation on Market Segment, Average Contract, Growth Rate. This template is free to edit as deemed fit for your organization. Therefore download it now.
-
 Social Media Network Dashboard For Marketing Management
This slide depicts an analysis of social media networks to centralize and streamline the monitoring, analysis, and execution of marketing strategies across various social platforms. It includes parameters such as customer engagement, facebook shares, twitter retweets etc. Presenting our well structured Social Media Network Dashboard For Marketing Management. The topics discussed in this slide are Dashboard, Marketing, Management. This is an instantly available PowerPoint presentation that can be edited conveniently. Download it right away and captivate your audience.
-
 Key Indicator Dashboard To Measure Okr Report Performance
This slide represents okr report performance measuring key indicator dashboard. This further includes revenue, new restaurant, new hires, avg revenue per restaurant, avg set up time etc. Presenting our well structured Key Indicator Dashboard To Measure Okr Report Performance. The topics discussed in this slide are Dashboard, Measure, Performance. This is an instantly available PowerPoint presentation that can be edited conveniently. Download it right away and captivate your audience.
-
 Dashboard To Monitor Product Availability In Store
This slide represents dashboard to monitor product availability in stores which assists to enhance sales opportunities and mitigate risk of stock outs. It includes key components such as coverage of product, product per retailer, etc. Introducing our Dashboard To Monitor Product Availability In Store set of slides. The topics discussed in these slides are Dashboard, Product, Availability. This is an immediately available PowerPoint presentation that can be conveniently customized. Download it and convince your audience.
-
 Dashboard To Ascertaining Current Cash Flow Position Corporate Finance Mastery Maximizing FIN SS
This slide provides a dedicated dashboard for monitoring the organizations cash flow position. It offers a real time view of cash flow status. Key performance metrics covered in the dashboard relate to cash in hand, profit or loss, cash flow, etc. Present the topic in a bit more detail with this Dashboard To Ascertaining Current Cash Flow Position Corporate Finance Mastery Maximizing FIN SS Use it as a tool for discussion and navigation on Beginning Cash Hand, Cash Going In, Cash Going Out This template is free to edit as deemed fit for your organization. Therefore download it now.
-
 Working Capital Finance Control Dashboard Corporate Finance Mastery Maximizing FIN SS
The following slide presents a dashboard focused on controlling working capital funds through relevant metrics. Top metrics include total accounts receivable, equity ratio, debt equity ratio, current ratio, etc. Present the topic in a bit more detail with this Working Capital Finance Control Dashboard Corporate Finance Mastery Maximizing FIN SS Use it as a tool for discussion and navigation on Total Accounts Receivable, Total Accounts Payable, Equity Ratio This template is free to edit as deemed fit for your organization. Therefore download it now.


