Powerpoint Templates and Google slides for Dash
Save Your Time and attract your audience with our fully editable PPT Templates and Slides.
-
 KPI Dashboard To Monitor Facebook Marketing Driving Web Traffic With Effective Facebook Strategy SS V
The following slide outlines key performance indicator KPI dashboard which can be used to evaluate Facebook advertisement performance. The metrics mentioned in slide are total fans, page views, total actions, post likes, audience growth, fans by language, etc. Present the topic in a bit more detail with this KPI Dashboard To Monitor Facebook Marketing Driving Web Traffic With Effective Facebook Strategy SS V. Use it as a tool for discussion and navigation on KPI Dashboard To Monitor, Facebook Marketing. This template is free to edit as deemed fit for your organization. Therefore download it now.
-
 Dashboard Analytics Measuring Supply Chain Efficiency Digital Transformation Of Retail DT SS
This slide represents a supply chain management dashboard measuring the efficiency of supply chain operations after effective digital transformation of retail operations. It includes inventory to sales, inventory turnover, carrying cost of inventory, inventory accuracy, and percentage out of stock items. Deliver an outstanding presentation on the topic using this Dashboard Analytics Measuring Supply Chain Efficiency Digital Transformation Of Retail DT SS Dispense information and present a thorough explanation of Dashboard Analytics, Carrying Cost Of Inventory, Supply Chain Efficiency using the slides given. This template can be altered and personalized to fit your needs. It is also available for immediate download. So grab it now.
-
 Dashboard Analytics Monitoring Retail Store Performance Digital Transformation Of Retail DT SS
This slide represents a retail KPI dashboard measuring the performance of retail store. It tracks KPIs such as sales revenue, customers, average transaction price, average units per customer, top five articles by sold items, total customers and visitors, collections by revenue , average price and units per transaction, etc. Present the topic in a bit more detail with this Dashboard Analytics Monitoring Retail Store Performance Digital Transformation Of Retail DT SS Use it as a tool for discussion and navigation on Sales Revenue, Customers, Transaction Price This template is free to edit as deemed fit for your organization. Therefore download it now.
-
 Maximizing ROI Through Kpi Dashboard For Tracking Social Media Campaign Results Strategy SS V
This slide covers the dashboard for analyzing social media marketing campaigns. It includes metrics such as tweets, followers, followings, listed favorites, reach, views, Facebook engagement, clicks, likes, Instagram photos, etc. Present the topic in a bit more detail with this Maximizing ROI Through Kpi Dashboard For Tracking Social Media Campaign Results Strategy SS V Use it as a tool for discussion and navigation on Better Lead Generation, Targeted Audience, Increase Customer Engagement This template is free to edit as deemed fit for your organization. Therefore download it now.
-
 Maximizing ROI Through Kpis Dashboard To Track Digital Marketing Campaign Results Strategy SS V
This slide covers the dashboard for analyzing online marketing campaigns. It includes metrics such as cost, clicks, impressions, CTR, cost per conversion, conversions, ad impressions, cost per click, conversion rate, etc. Deliver an outstanding presentation on the topic using this Maximizing ROI Through Kpis Dashboard To Track Digital Marketing Campaign Results Strategy SS V Dispense information and present a thorough explanation of Twitter, Facebook, Instagram using the slides given. This template can be altered and personalized to fit your needs. It is also available for immediate download. So grab it now.
-
 Sustainable Marketing Solutions Dashboard To Monitor Performance Of MKT SS V
This slide covers dashboard to evaluate the performance of campaigns launched under sustainable marketing. It includes elements such as on leads breakdown, collection of leads under campaigns, Google analytics and web traffic conversion rates, top social media channels under sustainable marketing. Present the topic in a bit more detail with this Sustainable Marketing Solutions Dashboard To Monitor Performance Of MKT SS V Use it as a tool for discussion and navigation on Lead Breakdown, Conversion Metrics, Social Media Channels This template is free to edit as deemed fit for your organization. Therefore download it now.
-
 Sustainable Marketing Solutions Dashboard To Track Funds Raised Under Mission Driven MKT SS V
This slide covers dashboard to track the fund raised under sense of mission marketing campaign. The purpose of this template is to provide an overview of donations received for a cause from general public, corporate houses through channels such as online, phone, events, etc. Deliver an outstanding presentation on the topic using this Sustainable Marketing Solutions Dashboard To Track Funds Raised Under Mission Driven MKT SS V Dispense information and present a thorough explanation of Cumulative, Under Mission, Marketing Campaign using the slides given. This template can be altered and personalized to fit your needs. It is also available for immediate download. So grab it now.
-
 Dashboard Illustrating Customer Strategies To Optimize Customer Journey And Enhance Engagement
This Slide Represents A Dashboard Highlighting Organizations Current Kpi Performance Following The Adoption Of A Successful Customer Engagement Strategy. It Includes Net Promoter Score, Customer Effort Score, Nps And Ces Monthly Growth And Satisfaction Score. Present The Topic In A Bit More Detail With This Dashboard Illustrating Customer Strategies To Optimize Customer Journey And Enhance Engagement. Use It As A Tool For Discussion And Navigation On Dashboard, Engagement, Performance. This Template Is Free To Edit As Deemed Fit For Your Organization. Therefore Download It Now.
-
 Dashboard To Track Customer Strategies To Optimize Customer Journey And Enhance Engagement
This slide presents the performance of various metrics related to customer engagement through a gamified loyalty program. It includes statistics on various KPIs such as total enrolments, reward points, loyalty rewards, customers and feedback. Deliver an outstanding presentation on the topic using this Dashboard To Track Customer Strategies To Optimize Customer Journey And Enhance Engagement. Dispense information and present a thorough explanation of Performance, Dashboard, Engagement using the slides given. This template can be altered and personalized to fit your needs. It is also available for immediate download. So grab it now.
-
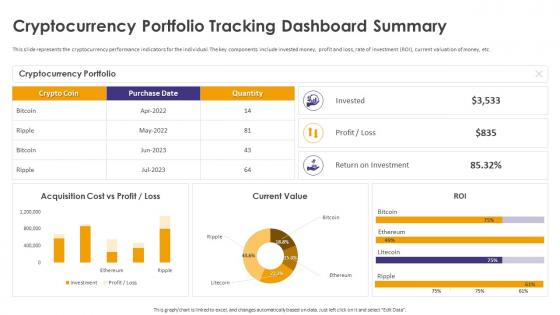 Crypto Wallets Types And Applications Cryptocurrency Portfolio Tracking Dashboard Summary
This slide represents the cryptocurrency performance indicators for the individual. The key components include invested money, profit and loss, rate of investment ROI, current valuation of money, etc. Present the topic in a bit more detail with this Crypto Wallets Types And Applications Cryptocurrency Portfolio Tracking Dashboard Summary. Use it as a tool for discussion and navigation on Cryptocurrency Performance Indicators, Invested Money, Profit And Loss, Rate Of Investment, Current Valuation Of Money. This template is free to edit as deemed fit for your organization. Therefore download it now.
-
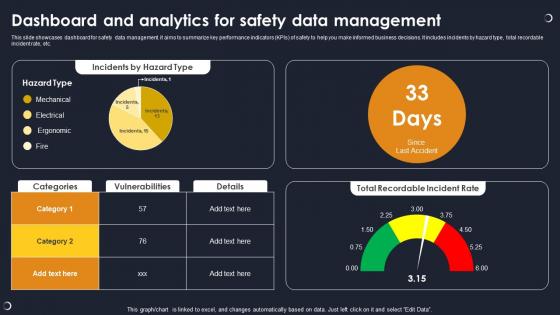 Dashboard And Analytics For Safety Data Management
This slide showcases dashboard for safety data management. it aims to summarize key performance indicators KPIs of safety to help you make informed business decisions. It includes incidents by hazard type, total recordable incident rate, etc. Presenting our well structured Dashboard And Analytics For Safety Data Management. The topics discussed in this slide are Incidents By Hazard Type, Vulnerabilities, Total Recordable Incident Rate. This is an instantly available PowerPoint presentation that can be edited conveniently. Download it right away and captivate your audience.
-
 Cyber Attack Incident Tracking Dashboard Implementing Cyber Risk Management Process
The following slide depicts the number of cyber-attacks incurred during year end to monitor security trends. It includes elements such as prevented, allowed attacks, additional threats detected, number of infected hosts and malicious files etc. Present the topic in a bit more detail with this Cyber Attack Incident Tracking Dashboard Implementing Cyber Risk Management Process. Use it as a tool for discussion and navigation on Cyber Attack Trends, Attacks Allowed By Policy. This template is free to edit as deemed fit for your organization. Therefore download it now.
-
 Data Breach Trend Analysis With KPI Dashboard Implementing Cyber Risk Management Process
The following slide depicts the data breach trends to minimize information leakage and patch affected system. It includes elements such as breach risk trend, breach by risk category, current and future goal analysis etc. Deliver an outstanding presentation on the topic using this Data Breach Trend Analysis With KPI Dashboard Implementing Cyber Risk Management Process. Dispense information and present a thorough explanation of Current And Future Goal Analysis, Breach Risk Trend using the slides given. This template can be altered and personalized to fit your needs. It is also available for immediate download. So grab it now.
-
 Information Technology Expenditure Summary Dashboard Implementing Cyber Risk Management Process
The following slide showcases the cyber security expense overview to better allocateplus budget. It includes elements such as IT cost, revenue, security incidents, services down, issue status summary, total business hours lost etc. Present the topic in a bit more detail with this Information Technology Expenditure Summary Dashboard Implementing Cyber Risk Management Process. Use it as a tool for discussion and navigation on Issue Status Summary, Costs And Revenue. This template is free to edit as deemed fit for your organization. Therefore download it now.
-
 Candidate Applicant Tracking System KPI Dashboard Adopting Digital Transformation DT SS
This slide covers candidate applicant tracking system KPI dashboard. It involves number of candidates, published vacancies, hired candidates and number of candidates in offer. Present the topic in a bit more detail with this Candidate Applicant Tracking System KPI Dashboard Adopting Digital Transformation DT SS Use it as a tool for discussion and navigation on Registered Candidates, New Candidate, New Interview This template is free to edit as deemed fit for your organization. Therefore download it now.
-
 KPI Dashboard To Analyze Impact Of Warehouse Management Adopting Digital Transformation DT SS
This slide covers KPI dashboard to assess performance of supply chain after implementing effective logistics strategies. It involves details such as delivery status, number of shipments and average delivery time. Present the topic in a bit more detail with this KPI Dashboard To Analyze Impact Of Warehouse Management Adopting Digital Transformation DT SS Use it as a tool for discussion and navigation on Profit By Country, Delivery Status, Deliveries By Country This template is free to edit as deemed fit for your organization. Therefore download it now.
-
 Key Metrics Dashboard To Track And Implementing Digital Technology In Corporate
Following slide represents dashboard that helps to analyse recruitment funnel to track employee staffing process. It includes metrics such as time to hire, time to fill, recruitment costs, age of applicants etc. Deliver an outstanding presentation on the topic using this Key Metrics Dashboard To Track And Implementing Digital Technology In Corporate. Dispense information and present a thorough explanation of Process, Analyse, Track using the slides given. This template can be altered and personalized to fit your needs. It is also available for immediate download. So grab it now.
-
 KPIs Dashboard To Track Hiring Progress Of Implementing Digital Technology In Corporate
Following slide exhibits dashboard to track hiring process that helps recruitment team to achieve goals. It includes elements such as hires per month, hires, average time to hire, offer acceptance rate etc. Present the topic in a bit more detail with this KPIs Dashboard To Track Hiring Progress Of Implementing Digital Technology In Corporate. Use it as a tool for discussion and navigation on Hiring, Company, Progress. This template is free to edit as deemed fit for your organization. Therefore download it now.
-
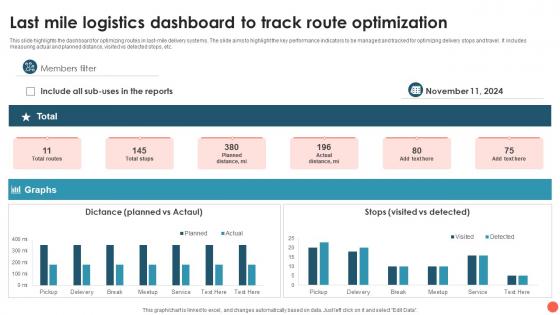 Last Mile Logistics Dashboard To Track Route Optimization Infographic Template Visual Aids
This slide highlights the dashboard for optimizing routes in last mile delivery systems. The slide aims to highlight the key performance indicators to be managed and tracked for optimizing delivery stops and travel. It includes measuring actual and planned distance, visited vs detected stops, etc. Presenting our well structured Last Mile Logistics Dashboard To Track Route Optimization Infographic Template Visual Aids. The topics discussed in this slide are Include Logistics Dashboard, Distance, Stops. This is an instantly available PowerPoint presentation that can be edited conveniently. Download it right away and captivate your audience.
-
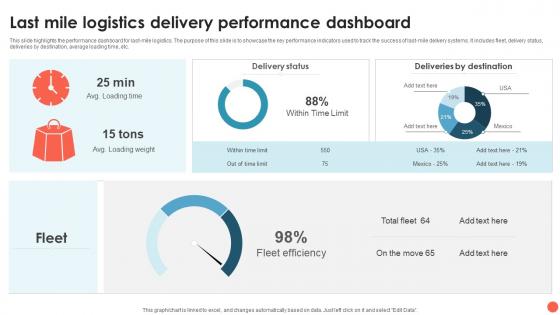 Last Mile Logistics Delivery Performance Dashboard Infographic Template Inspiration
This slide highlights the performance dashboard for last mile logistics. The purpose of this slide is to showcase the key performance indicators used to track the success of last mile delivery systems. It includes fleet, delivery status, deliveries by destination, average loading time, etc. Introducing our Last Mile Logistics Delivery Performance Dashboard Infographic Template Inspiration set of slides. The topics discussed in these slides are Delivery Status, Deliveries By Destination, Fleet Efficiency. This is an immediately available PowerPoint presentation that can be conveniently customized. Download it and convince your audience.
-
 Dashboard To Monitor Company Linkedin Marketing Channels To Improve Lead Generation MKT SS V
This slide covers report to track performance of the companys business profile on LinkedIn. The purpose of this template is to provide an overview to the user to evaluate the pages performance and optimize the profile to improve outcomes. It includes tracking based on followers, CTR, engagement rate on company updates, page impressions, reach, etc. Present the topic in a bit more detail with this Dashboard To Monitor Company Linkedin Marketing Channels To Improve Lead Generation MKT SS V. Use it as a tool for discussion and navigation on Dashboard, Performance, Engagement. This template is free to edit as deemed fit for your organization. Therefore download it now.
-
 Healthcare Analytics Dashboard Using Iot How Iomt Is Transforming Medical Industry IoT SS V
Following slide exhibits dashboard that provides health care data after deployment of internet of things IoT technology. It includes indicators such as patient satisfaction, total patients, average waiting time etc. Deliver an outstanding presentation on the topic using this Healthcare Analytics Dashboard Using Iot How Iomt Is Transforming Medical Industry IoT SS V. Dispense information and present a thorough explanation of Healthcare, Analytics, Dashboard using the slides given. This template can be altered and personalized to fit your needs. It is also available for immediate download. So grab it now.
-
 Hospital Management Dashboard Using Iot How Iomt Is Transforming Medical Industry IoT SS V
Following slide showcases dashboard that provides data for hospital management using technology and IoT devices. It includes metrics such as admitted patients, readmission rate, readmitted patients, etc. Present the topic in a bit more detail with this Hospital Management Dashboard Using Iot How Iomt Is Transforming Medical Industry IoT SS V. Use it as a tool for discussion and navigation on Management, Dashboard, Readmitted. This template is free to edit as deemed fit for your organization. Therefore download it now.
-
 Iot Device For Patient Health Monitoring Dashboard How Iomt Is Transforming Medical Industry IoT SS V
Following slide highlights dashboard that provides insights about patient health summary through IoT devices. It includes parameters such as sleep hours, step counter, heart rate etc. Present the topic in a bit more detail with this Iot Device For Patient Health Monitoring Dashboard How Iomt Is Transforming Medical Industry IoT SS V. Use it as a tool for discussion and navigation on Monitoring, Dashboard, Parameters. This template is free to edit as deemed fit for your organization. Therefore download it now.
-
 Ransomware In Digital Age Dashboard For Monitoring Ransomware Protection Metrics
This slide highlights the monitoring dashboard designed to track metrics related to ransomware protection. The purpose of this slide is to showcase the monitoring of various metrics to prevent ransomware attacks such as critical patches, phishing tests and so on. Present the topic in a bit more detail with this Ransomware In Digital Age Dashboard For Monitoring Ransomware Protection Metrics. Use it as a tool for discussion and navigation on Dashboard For Monitoring, Ransomware Protection Metrics, Critical Patches. This template is free to edit as deemed fit for your organization. Therefore download it now.
-
 Ransomware In Digital Age Ransomware Defense Validation Tracking Dashboard
This slide represents the dashboard for tracking ransomware defense validation and monitoring. The purpose of this slide is to showcase the network protection measures form ransomware attacks such as scareware, locker, mobile ransomware and so on. Deliver an outstanding presentation on the topic using this Ransomware In Digital Age Ransomware Defense Validation Tracking Dashboard. Dispense information and present a thorough explanation of Dashboard For Tracking Ransomware, Validation And Monitoring, Network Protection Measures using the slides given. This template can be altered and personalized to fit your needs. It is also available for immediate download. So grab it now.
-
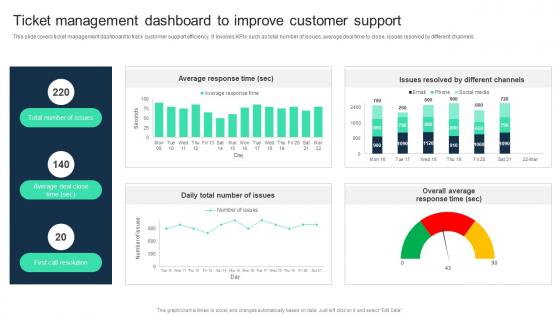 Ticket Management Dashboard To Improve Customer Support Adopting Digital Transformation DT SS
This slide covers ticket management dashboard to track customer support efficiency. It involves KPIs such as total number of issues, average deal time to close, issues resolved by different channels. Present the topic in a bit more detail with this Ticket Management Dashboard To Improve Customer Support Adopting Digital Transformation DT SS Use it as a tool for discussion and navigation on Average Response, Overall Average Response, Different Channels This template is free to edit as deemed fit for your organization. Therefore download it now.
-
 Dashboard To Track Stakeholder Satisfaction And Engagement Strategic Process To Create
Following slide shows dashboard that helps to measure customer satisfaction by using stakeholder management plan. It includes indictors such as average response time, net promoter score etc. Deliver an outstanding presentation on the topic using this Dashboard To Track Stakeholder Satisfaction And Engagement Strategic Process To Create Dispense information and present a thorough explanation of Project, Customer Effort Score, Promoter Score using the slides given. This template can be altered and personalized to fit your needs. It is also available for immediate download. So grab it now.
-
 KPI Dashboard To Track Project Management And Performance Strategic Process To Create
Following slide represents dashboard to track project overall performance. It includes indicators such as progress, time duration, risks and issues. Present the topic in a bit more detail with this KPI Dashboard To Track Project Management And Performance Strategic Process To Create Use it as a tool for discussion and navigation on Project, Progress, Planned Vs Actual Hours, Risk And Issues This template is free to edit as deemed fit for your organization. Therefore download it now.
-
 KPI Dashboard To Track Stakeholder Satisfaction Strategic Process To Create
Following slide exhibits dashboard to measure and track stakeholders satisfaction. It includes areas such as IT, helpdesk, HR, financial management etc. Deliver an outstanding presentation on the topic using this KPI Dashboard To Track Stakeholder Satisfaction Strategic Process To Create Dispense information and present a thorough explanation of Overall Satisfaction, Satisfaction Divided, Comments using the slides given. This template can be altered and personalized to fit your needs. It is also available for immediate download. So grab it now.
-
 Streamlined Online Marketing Kpi Dashboard To Analyze Digital Marketing Performance MKT SS V
This slide showcases the parameters that would help the business organization to evaluate digital marketing performance. It includes conversions, conversion rate, sessions, stickiness, engagement, bounce rate, etc. Deliver an outstanding presentation on the topic using this Streamlined Online Marketing Kpi Dashboard To Analyze Digital Marketing Performance MKT SS V Dispense information and present a thorough explanation of Facebook, Instagram, Youtube using the slides given. This template can be altered and personalized to fit your needs. It is also available for immediate download. So grab it now.
-
 Streamlined Online Marketing Tracking The Improvements With Digital Marketing Dashboard MKT SS V
This slide showcases the KPIs that would help the business organization to evaluate digital marketing improvements. It includes ad cost, clicks, impressions, click through rate, cost per conversion, ad impressions, etc. Deliver an outstanding presentation on the topic using this Streamlined Online Marketing Tracking The Improvements With Digital Marketing Dashboard MKT SS V Dispense information and present a thorough explanation of SEO Marketing, Features, Benefits Of SEO Marketing using the slides given. This template can be altered and personalized to fit your needs. It is also available for immediate download. So grab it now.
-
 Audit Key Performance Indicators Dashboard
This slide showcases the effective audit key performance indicators dashboard which helps an organization to provide cloud based platform that transforms risk management system. It include details such as satisfactory, requires some improvement, unsatisfactory, etc. Introducing our Audit Key Performance Indicators Dashboard set of slides. The topics discussed in these slides are Planned Audits Status, Audit Observation Summary, Planned Audit Risk Rating, Completed Audits Results. This is an immediately available PowerPoint presentation that can be conveniently customized. Download it and convince your audience.
-
 Dashboard With Audit Status For Reporting Committee
This slide showcases the dashboard illustrating audit status for reporting committee which helps an organization to increase business value by offering innovative customer tracking. It include details such as open, pending remediation, remediated, inactive, etc. Introducing our Dashboard With Audit Status For Reporting Committee set of slides. The topics discussed in these slides are Audit Status, Audits Scheduled, Issues Status, Overall Audit Ratings . This is an immediately available PowerPoint presentation that can be conveniently customized. Download it and convince your audience.
-
 Internal Audit Dashboard Showcasing It Performance
This slide showcases the internal audit dashboard representing information technology performance which helps an organization to identify risk extent and addresses it properly. It include details such as quality audit observations, internal audit human tasks, etc. Presenting our well structured Internal Audit Dashboard Showcasing It Performance. The topics discussed in this slide are Quality Audit Observations, ABC Company Internal Audit Plan, Internal Audit Human Tasks. This is an instantly available PowerPoint presentation that can be edited conveniently. Download it right away and captivate your audience.
-
 KPI Dashboard For Company Financial Audit
The below slide provides a financial audit dashboard for a company that help to understand the inventory and sales transactions. It mentions quick ration, cash balance, days sales outstanding, days payable outstanding, etc. Introducing our KPI Dashboard For Company Financial Audit set of slides. The topics discussed in these slides are Days Sales Outstanding, Days Inventory Outstanding, Days Payable Outstanding. This is an immediately available PowerPoint presentation that can be conveniently customized. Download it and convince your audience.
-
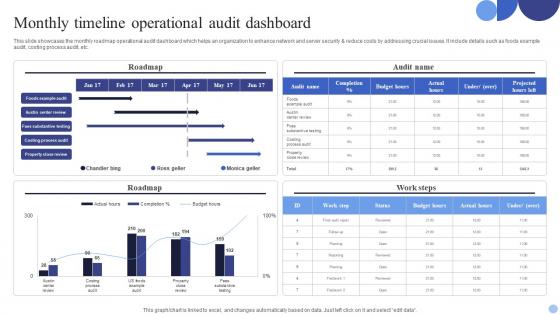 Monthly Timeline Operational Audit Dashboard
This slide showcases the monthly roadmap operational audit dashboard which helps an organization to enhance network and server security and reduce costs by addressing crucial issues. It include details such as foods example audit, costing process audit, etc. Presenting our well structured Monthly Timeline Operational Audit Dashboard. The topics discussed in this slide are Roadmap, Audit Name, Roadmap, Work Steps. This is an instantly available PowerPoint presentation that can be edited conveniently. Download it right away and captivate your audience.
-
 Search Engine Optimization Audit Dashboard
This slide showcases the effective search engine optimization audit dashboard which helps an organization to reduce operational costs by properly examining and addressing issues. It include details such as core website vitals, international search engine optimization, etc. Introducing our Search Engine Optimization Audit Dashboard set of slides. The topics discussed in these slides are Websites Health, Audit Errors, Audit Warnings, Audit Notices. This is an immediately available PowerPoint presentation that can be conveniently customized. Download it and convince your audience.
-
 KPI Dashboard To Measure Workforce Behaviour In Corporates
This slide represents corporate KPI dashboard to measure workforce behaviour. This includes avg productive hoursday, utilization level, biggest increase and decline and stats by team. Introducing our KPI Dashboard To Measure Workforce Behaviour In Corporates set of slides. The topics discussed in these slides are Biggest Shoot Down, Biggest Shoot Down, Biggest Boost. This is an immediately available PowerPoint presentation that can be conveniently customized. Download it and convince your audience.
-
 DEI Training Performance Tracking Dashboard
The purpose of this slide is to highlight how DEI training performance tracking dashboard drives continuous improvement by providing real time metrics for effective evaluation and optimization of diversity, equity, and inclusion initiatives. Presenting our well structured DEI Training Performance Tracking Dashboard. The topics discussed in this slide are Actual Training Hours, Actual Coot Vs Budget, Training Engagement Rate. This is an instantly available PowerPoint presentation that can be edited conveniently. Download it right away and captivate your audience.
-
 KPI Dashboard To Track DEI Training Outcomes
The purpose of this slide is to showcase the impact and effectiveness of diversity, equity, and inclusion training through a KPI Dashboard, enabling data driven insights for continual improvement. Introducing our KPI Dashboard To Track DEI Training Outcomes set of slides. The topics discussed in these slides are Turnover By Gender, Ethnicity Distribution, Turnover By Gender. This is an immediately available PowerPoint presentation that can be conveniently customized. Download it and convince your audience.
-
 Employee Absence Management Dashboard For HR
This slide represents dashboard that helps companies to track and monitor employee absence to identify trends and making absence policies accordingly. It includes various components such as monthly employee absent, employee fatigue board Introducing our Employee Absence Management Dashboard For HR set of slides. The topics discussed in these slides are Annual Absence, Breakdown Days, Employee Fatigue Board This is an immediately available PowerPoint presentation that can be conveniently customized. Download it and convince your audience.
-
 Information Technology Dashboard To Track Industrial Manufacturing Productivity
This slide showcases the IT dashboard to monitor industrial manufacturing industry productivity. The purpose of this slide is to help the business monitor its industrial production and output. It includes elements such as downtime analysis, return items, etc. Presenting our well structured Information Technology Dashboard To Track Industrial Manufacturing Productivity The topics discussed in this slide are Product, Information Technology, Manufacturing Productivity This is an instantly available PowerPoint presentation that can be edited conveniently. Download it right away and captivate your audience.
-
 Project Control Business Intelligence KPI Dashboard
This slide shows KPI dashboard to monitor business intelligence usage in a project management . It further includes project controlling, total progress, completed etc. Presenting our well structured Project Control Business Intelligence KPI Dashboard. The topics discussed in this slide are Project Controlling, Project Work, Budget Development. This is an instantly available PowerPoint presentation that can be edited conveniently. Download it right away and captivate your audience.
-
 Dashboard To Monitor E Commerce Marketing Campaign Plan
This slide represents the dashboard to monitor performance of ecommerce marketing campaign plan effectively. This includes various KPIs such as customer value, Advertising budget, Branded search, etc. Introducing our Dashboard To Monitor E Commerce Marketing Campaign Plan set of slides. The topics discussed in these slides are Campaign, Customers, Demographic Breakdown This is an immediately available PowerPoint presentation that can be conveniently customized. Download it and convince your audience.
-
 SEO Metrics Dashboard To Monitor Website Ranking
This slide represents the dashboard to analyze SEO metrics for e commerce businesses to monitor and enhance their website performance. It includes metrics such as google analytics, site audits, etc. Presenting our well structured SEO Metrics Dashboard To Monitor Website Ranking. The topics discussed in this slide are Website, Monitor, Ranking. This is an instantly available PowerPoint presentation that can be edited conveniently. Download it right away and captivate your audience.
-
 SEO Metrics Dashboard To Track Website Performance
This slide showcases the SEO metrics dashboard that assists businesses in tracking and monitoring their website performance effectively. It includes metrics such as engagement rate, conversion rate, reach, organic traffic, top queries, etc. Introducing our SEO Metrics Dashboard To Track Website Performance set of slides. The topics discussed in these slides are Track, Performance, Website. This is an immediately available PowerPoint presentation that can be conveniently customized. Download it and convince your audience.
-
 Untapped Market For Retail Store Performance Dashboard
This slide illustrates untapped market KPI dashboard and includes metrics such as geographical sales, conversion rate, basket value, categorical sales. Presenting our well structured Untapped Market For Retail Store Performance Dashboard. The topics discussed in this slide are Market, Retail, Performance. This is an instantly available PowerPoint presentation that can be edited conveniently. Download it right away and captivate your audience.
-
 Smart Water Management Iot Water Management Kpi Dashboard With Monthly Consumption IoT SS
The following slide showcases Internet of Things IoT water management key performance indicator KPI dashboard. The major metrics covered in slide are monthly water consumption, excessive consumption, water quality, etc. Present the topic in a bit more detail with this Smart Water Management Iot Water Management Kpi Dashboard With Monthly Consumption IoT SS Use it as a tool for discussion and navigation on Smart Water Management Iot Water Management Kpi Dashboard With Monthly Consumption IoT SS This template is free to edit as deemed fit for your organization. Therefore download it now.
-
 Smart Water Management Smart Water Management Dashboard With Consumption Level IoT SS
The following slide showcases comprehensive key performance indicator KPI dashboard through which companies can measure water consumption level. The major metrics mentioned in slide are total alerts, water supplied and purchased, global comparison, etc. Deliver an outstanding presentation on the topic using this Smart Water Management Smart Water Management Dashboard With Consumption Level IoT SS Dispense information and present a thorough explanation of Data Privacy, Physical Security, Software Update using the slides given. This template can be altered and personalized to fit your needs. It is also available for immediate download. So grab it now.
-
 CASB Performance Tracking Dashboard Next Generation CASB
This slide outlines the performance tracking dashboard for CASB deployment. The purpose of this slide is to showcase the status of various applications, IP addresses, users, machines, and web traffic. It also includes cloud discovery open alerts, risk levels, and top entities. Present the topic in a bit more detail with this CASB Performance Tracking Dashboard Next Generation CASB Use it as a tool for discussion and navigation on Cloud Discover Open Alerts, Headquarters Location This template is free to edit as deemed fit for your organization. Therefore download it now.
-
 Healthcare Analytics Dashboard Using IoT Technology Guide To Networks For IoT Healthcare IoT SS V
Following slide exhibits dashboard that provides health care data after deployment of internet of things IoT technology. It includes indicators such as patient satisfaction, total patients, average waiting time etc. Present the topic in a bit more detail with this Healthcare Analytics Dashboard Using IoT Technology Guide To Networks For IoT Healthcare IoT SS V. Use it as a tool for discussion and navigation on Healthcare Analytics, Dashboard Using Iot Technology. This template is free to edit as deemed fit for your organization. Therefore download it now.
-
 Hospital Management Dashboard Using IoT Guide To Networks For IoT Healthcare IoT SS V
Following slide showcases dashboard that provides data for hospital management using technology and IoT devices. It includes metrics such as admitted patients, readmission rate, readmitted patients, etc. Deliver an outstanding presentation on the topic using this Hospital Management Dashboard Using IoT Guide To Networks For IoT Healthcare IoT SS V. Dispense information and present a thorough explanation of Admitted Patients, Readmitted Patients, Readmission Rate using the slides given. This template can be altered and personalized to fit your needs. It is also available for immediate download. So grab it now.
-
 IoT Device For Patient Health Monitoring Dashboard Guide To Networks For IoT Healthcare IoT SS V
Following slide highlights dashboard that provides insights about patient health summary through IoT devices. It includes parameters such as sleep hours, step counter, heart rate etc. Present the topic in a bit more detail with this IoT Device For Patient Health Monitoring Dashboard Guide To Networks For IoT Healthcare IoT SS V. Use it as a tool for discussion and navigation on Patient Health Monitoring Dashboard. This template is free to edit as deemed fit for your organization. Therefore download it now.
-
 Project Change Management KPI Dashboard Navigating The Digital Project Management PM SS
This slide represents KPI dashboard to effectively track and monitor effectiveness of changes implemented in organizational projects. It includes details related to KPIs such as changes investigated, submitted, approved, declined, etc. Present the topic in a bit more detail with this Project Change Management KPI Dashboard Navigating The Digital Project Management PM SS. Use it as a tool for discussion and navigation on Changes Overview, Investigating, Submitted. This template is free to edit as deemed fit for your organization. Therefore download it now.
-
 Call Center Quality Assurance Dashboard
This slide presents KPI dashboard for assessing quality of call center operations. It aims to evaluate level of customer support for analyzing efficiency of quality assurance programs. Presenting our well structured Call Center Quality Assurance Dashboard. The topics discussed in this slide are Assurance, Quality, Result. This is an instantly available PowerPoint presentation that can be edited conveniently. Download it right away and captivate your audience.
-
 Incident Management Performance Dashboard Metrics
This slide depicts incident management service level agreement dashboard which helps to keep track of compliance data and address within specified time limit. It includes elements such as incident management, incident response, high response, critical response and incident priority. Introducing our Incident Management Performance Dashboard Metrics set of slides. The topics discussed in these slides are Performance, Management, Metrics. This is an immediately available PowerPoint presentation that can be conveniently customized. Download it and convince your audience.
-
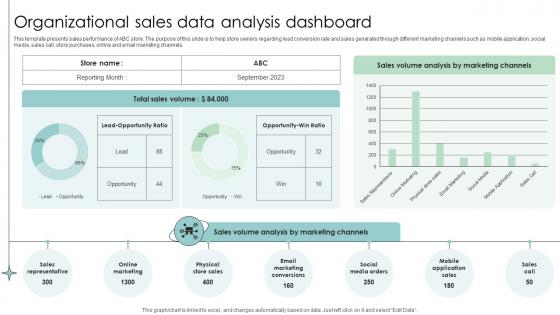 Organizational Sales Data Analysis Dashboard
This template presents sales performance of ABC store. The purpose of this slide is to help store owners regarding lead conversion rate and sales generated through different marketing channels such as mobile application, social media, sales call, store purchases, online and email marketing channels. Introducing our Organizational Sales Data Analysis Dashboard set of slides. The topics discussed in these slides are Sales, Analysis, Data. This is an immediately available PowerPoint presentation that can be conveniently customized. Download it and convince your audience.
-
 Dashboard Measuring Key Partner Analytics And Performance Nurturing Relationships
This slide analyzes a dashboard examining various partner pipeline metrics. It tracks KPIs such as, partner opportunity pipeline, leads, demo units, co-brand requests, market development funds requests and budget, new partners, open pipeline, certified partners, e-learnings. Deliver an outstanding presentation on the topic using this Dashboard Measuring Key Partner Analytics And Performance Nurturing Relationships Dispense information and present a thorough explanation of Opportunities, Certified Partners, Performance Indicators using the slides given. This template can be altered and personalized to fit your needs. It is also available for immediate download. So grab it now.
-
 Partner Performance Dashboard To Measure Revenue And Deals Nurturing Relationships
This slide examines the partner performance dashboard. It tracks key performance indicators such as revenue, pipeline forecast and actual pipeline close. Deliver an outstanding presentation on the topic using this Partner Performance Dashboard To Measure Revenue And Deals Nurturing Relationships Dispense information and present a thorough explanation of Revenue, Pipeline, Partner Performance using the slides given. This template can be altered and personalized to fit your needs. It is also available for immediate download. So grab it now.


