Powerpoint Templates and Google slides for Dash
Save Your Time and attract your audience with our fully editable PPT Templates and Slides.
-
 Financial Performance Dashboard For International Business Strategies For Exponential
This slide presents financial performance dashboard for international business monitoring and funds management. It includes metrics such as return on assets, working capital ratio, return on equity and debt equity ratio. Present the topic in a bit more detail with this Financial Performance Dashboard For International Business Strategies For Exponential. Use it as a tool for discussion and navigation on Return On Equity, Return On Assets, Working Capital Ratio. This template is free to edit as deemed fit for your organization. Therefore download it now.
-
 Sales Performance Dashboard For International Business Strategies For Exponential
This slide presents sales performance dashboard for international business, helpful in tracking target accomplishment and overall sales achieved. It includes metrics such as average revenue per unit, customer lifetime value, customer acquisition cost. Present the topic in a bit more detail with this Sales Performance Dashboard For International Business Strategies For Exponential. Use it as a tool for discussion and navigation on Average Revenue Per Unit, Customer Lifetime Value, Customer Acquisition Cost. This template is free to edit as deemed fit for your organization. Therefore download it now.
-
 Warehouse Supervision Dashboard For International Business Strategies For Exponential
This slide presents warehouse supervision dashboard for international operations, helpful in tracking shipments and storage cost. It includes metrics such as average monthly costs for warehouse, total shipments in different countries and percentage of on-time shipments. Deliver an outstanding presentation on the topic using this Warehouse Supervision Dashboard For International Business Strategies For Exponential. Dispense information and present a thorough explanation of On-Time Shipments, Total Shipments By Country, Perfect Order Rate, Warehouse Operating Costs using the slides given. This template can be altered and personalized to fit your needs. It is also available for immediate download. So grab it now.
-
 R48 High Performance Computing Tracking Dashboard
The purpose of this slide is to highlight the dashboard components of high-performance computing such as average CPU efficiency, total CPUs underused, etc. Present the topic in a bit more detail with this R48 High Performance Computing Tracking Dashboard. Use it as a tool for discussion and navigation on High Performance Computing, Total Cpus Underused, Average CPU Efficiency. This template is free to edit as deemed fit for your organization. Therefore download it now.
-
 Dashboard To Track Hse Incident Trend Analysis
The purpose of this slide is to present visual representation of Health, Safety, and Environment HSE incident, aiding in proactive risk management including elements such as total accidents, no. of accidents by gender, etc. Introducing our Dashboard To Track Hse Incident Trend Analysis set of slides. The topics discussed in these slides are Days Without Accident, Accident During Office HoursThis is an immediately available PowerPoint presentation that can be conveniently customized. Download it and convince your audience.
-
 Dashboard For Optimized Vendor Managed Inventory
The purpose of this slide is to showcase a dashboard interface providing real-time insights for managing vendor managed inventory efficiently analyzing open customer order value, late orders, etc. Presenting our well structured Dashboard For Optimized Vendor Managed Inventory. The topics discussed in this slide are Dashboard, Managed Inventory, Optimized Vendor. This is an instantly available PowerPoint presentation that can be edited conveniently. Download it right away and captivate your audience.
-
 Demand Forecasting Dashboard For Efficient Vendor Managed Inventory
The purpose of this slide is to introduce a demand forecasting dashboard designed to optimize inventory levels in vendor managed inventory systems by analyzing stock quantity, sales cost, etc. Introducing our Demand Forecasting Dashboard For Efficient Vendor Managed Inventory set of slides. The topics discussed in these slides are Forecasting, Dashboard, Managed Inventory. This is an immediately available PowerPoint presentation that can be conveniently customized. Download it and convince your audience.
-
 Analyzing Employee Benefits Program Dashboard
The purpose of this slide is to explore insights and trends through an employee benefits program dashboard, optimizing offerings for employee satisfaction and retention. Presenting our well structured Analyzing Employee Benefits Program Dashboard. The topics discussed in this slide are Analyzing, Dashboard, Satisfaction. This is an instantly available PowerPoint presentation that can be edited conveniently. Download it right away and captivate your audience.
-
 Employee Self Service Dashboard With Additional Benefits
The purpose of this slide is to empower employees with self-service dashboards offering convenient access to benefits and supplementary perks for enhanced satisfaction and engagement. Presenting our well structured Employee Self Service Dashboard With Additional Benefits. The topics discussed in this slide are Dashboard, Service, Additional Benefits. This is an instantly available PowerPoint presentation that can be edited conveniently. Download it right away and captivate your audience.
-
 Streamlined Reporting Of Employee Benefits Through Dashboard
The purpose of this slide is to showcase efficiently streamlined employee benefits reporting through intuitive dashboard tools for enhanced transparency and data-driven decision-making. Introducing our Streamlined Reporting Of Employee Benefits Through Dashboard set of slides. The topics discussed in these slides are Streamlined, Dashboard, Employee Benefits. This is an immediately available PowerPoint presentation that can be conveniently customized. Download it and convince your audience.
-
 Dashboard Platform To Represent Customer Engagement Data
The below slide provides a dashboard for customer engagement data using digital analytics that explains the visitors by device, country, etc. The various areas of evaluation are current visitors, top referring domains, etc. Introducing our Dashboard Platform To Represent Customer Engagement Data set of slides. The topics discussed in these slides are Visitors From Devices, Dashboard Platform, Customer Engagement DataThis is an immediately available PowerPoint presentation that can be conveniently customized. Download it and convince your audience.
-
 Market Activity Plan To Improve Brand Dashboard To Analyze Marketing Performance Of Business
The following slide showcases dashboard for analyzing marketing performance of the business. It includes various KPIs such as conversions, website visits, traffic sources, etc. Deliver an outstanding presentation on the topic using this Market Activity Plan To Improve Brand Dashboard To Analyze Marketing Performance Of Business. Dispense information and present a thorough explanation of Dashboard To Analyze Marketing, Performance Of Business, Website Visits, Traffic Sources using the slides given. This template can be altered and personalized to fit your needs. It is also available for immediate download. So grab it now.
-
 Market Activity Plan To Improve Brand Dashboard To Monitor Brand Awareness Marketing Campaign
The following slide represents a dashboard for tracking brand awareness marketing campaigns. It includes various KPIs such as sessions, engagement rate, sessions per user, active users, etc. Present the topic in a bit more detail with this Market Activity Plan To Improve Brand Dashboard To Monitor Brand Awareness Marketing Campaign. Use it as a tool for discussion and navigation on Dashboard To Monitor Brand Awareness, Marketing Campaign, Engagement Rate, Sessions Per User. This template is free to edit as deemed fit for your organization. Therefore download it now.
-
 Connected TV Advertising Performance Monitoring Dashboard
This slide represents dashboard to monitor connected TV advertising performance which includes various elements such as planned budget, actual spend, total view time, etc. Introducing our Connected TV Advertising Performance Monitoring Dashboard set of slides. The topics discussed in these slides are Planned Budget, Actual Spend, Private ProductThis is an immediately available PowerPoint presentation that can be conveniently customized. Download it and convince your audience.
-
 Demand Generation Dashboard For Analyzing Customer Insights Demand Creation Strategy To Increase Sales
This slide showcases demand generation dashboard for analyzing customer insights includes element such as revenue, target, leads and conversion rate. Deliver an outstanding presentation on the topic using this Demand Generation Dashboard For Analyzing Customer Insights Demand Creation Strategy To Increase Sales. Dispense information and present a thorough explanation of Demand Generation Dashboard, Analyzing Customer Insights, Target, Leads And Conversion Rate using the slides given. This template can be altered and personalized to fit your needs. It is also available for immediate download. So grab it now.
-
 Marketing Team Lead Generation Dashboard Demand Creation Strategy To Increase Sales
This slide illustrates marketing team lead generation dashboard includes elements such as conversion rate, leads, organic traffic etc. Present the topic in a bit more detail with this Marketing Team Lead Generation Dashboard Demand Creation Strategy To Increase Sales. Use it as a tool for discussion and navigation on Marketing Team, Lead Generation Dashboard, Conversion Rate. This template is free to edit as deemed fit for your organization. Therefore download it now.
-
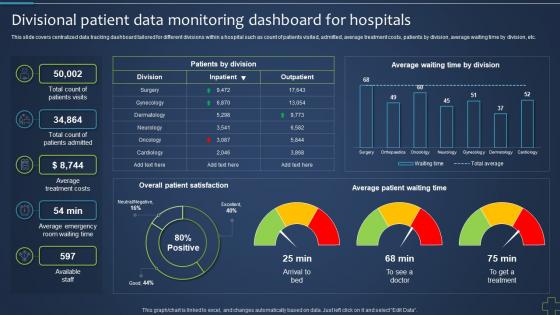 Divisional Patient Data Monitoring Dashboard For Revolutionizing Health Services With Blockchain BCT SS
This slide covers centralized data tracking dashboard tailored for different divisions within a hospital such as count of patients visited, admitted, average treatment costs, patients by division, average waiting time by division, etc. Deliver an outstanding presentation on the topic using this Divisional Patient Data Monitoring Dashboard For Revolutionizing Health Services With Blockchain BCT SS. Dispense information and present a thorough explanation of Average Waiting Time By Division, Average Patient Waiting Time, Overall Patient Satisfaction using the slides given. This template can be altered and personalized to fit your needs. It is also available for immediate download. So grab it now.
-
 Kpi Dashboard For Tracking Efficiency Of Spark Data Analytics
This slide showcases spark data analytics measuring KPI dashboard. This slide includes executors, executors memory usage, driver memory usage, total failed tasks, total completed tasks, max tasks on executor. Introducing our Kpi Dashboard For Tracking Efficiency Of Spark Data Analytics set of slides. The topics discussed in these slides are Dashboard, Efficiency, Data Analytics. This is an immediately available PowerPoint presentation that can be conveniently customized. Download it and convince your audience.
-
 Dashboard To Track Performance Of Talent Management Tool
This slide shows metrics that can be used by organizations to measure and evaluate the performance of their talent management software. It includes key performance indicators such as total application, total interview, talent fire, etc. Presenting our well structured Dashboard To Track Performance Of Talent Management Tool. The topics discussed in this slide are Dashboard, Performance, Management. This is an instantly available PowerPoint presentation that can be edited conveniently. Download it right away and captivate your audience.
-
 KPI Dashboard For Tracking HR Project Progress
The purpose of this slide is provide comprehensive analysis of HR project through various dashboard visuals. It shows visuals regarding completion status, number of hours spent on project, employees and payroll breakdown by project teams. Introducing our KPI Dashboard For Tracking HR Project Progress set of slides. The topics discussed in these slides are Completed, Hours, Team Project. This is an immediately available PowerPoint presentation that can be conveniently customized. Download it and convince your audience.
-
 Dashboard For Analyzing Lead Source Performance Of Company
This slide represents dashboard that analyzes lead source performance and guides company to select and invest in best source for lead generation. It includes various components such as leads by source, leads conversion rate, leads by industry, etc. Introducing our Dashboard For Analyzing Lead Source Performance Of Company set of slides. The topics discussed in these slides are Leads By Industry, Leads By Country, Leads Conversion Rate Trend. This is an immediately available PowerPoint presentation that can be conveniently customized. Download it and convince your audience.
-
 Sales Analytics Dashboard With Pipeline Breakdown Sales Coaching Program SA SS
This slide presents a sales analytics dashboard including KPIs such as total targets, total actual to date, sales activity by rep, quota attainment, forecasted by month, and pipeline breakdown. Deliver an outstanding presentation on the topic using this Sales Analytics Dashboard With Pipeline Breakdown Sales Coaching Program SA SS. Dispense information and present a thorough explanation of Sales Analytics Dashboard, Pipeline Breakdown, Quota Attainment, Targets using the slides given. This template can be altered and personalized to fit your needs. It is also available for immediate download. So grab it now.
-
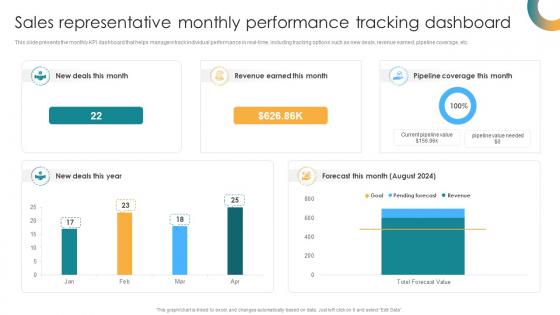 Sales Representative Monthly Performance Tracking Dashboard Sales Coaching Program SA SS
This slide presents the monthly KPI dashboard that helps managers track individual performance in real-time, including tracking options such as new deals, revenue earned, pipeline coverage, etc. Present the topic in a bit more detail with this Sales Representative Monthly Performance Tracking Dashboard Sales Coaching Program SA SS. Use it as a tool for discussion and navigation on Sales Representative, Monthly Performance, Tracking Dashboard, Pipeline Coverage. This template is free to edit as deemed fit for your organization. Therefore download it now.
-
 Dashboard To Monitor OT Cyber Security Parameters
This slide represents dashboard that assist companies to trach and monitor their OT cyber security for enhancing data protection. It includes various OT cyber security indicators such as intrusion detection system alert, prohibited traffic allowed, etc. Introducing our Dashboard To Monitor OT Cyber Security Parameters set of slides. The topics discussed in these slides are Restricted Traffic, Over Time By DestinationThis is an immediately available PowerPoint presentation that can be conveniently customized. Download it and convince your audience.
-
 Automotive Industry Technology KPI Dashboard For Fleet Vehicle Tracking TC SS
This slide exhibits a fleet management dashboard to improve driver productivity and vehicle security with a GPS tracking system including trips and mileage, live status, activity summary, mileage, and speeding. Present the topic in a bit more detail with this Automotive Industry Technology KPI Dashboard For Fleet Vehicle Tracking TC SS. Use it as a tool for discussion and navigation on Activity Summary, Real Time Status, Speeding. This template is free to edit as deemed fit for your organization. Therefore download it now.
-
 Automotive Industry Technology Supply Chain Performance Tracking Dashboard TC SS
This slide showcases supply chain performance monitoring dashboard that helps track warehouse order delivery accuracy. It includes elements such as total net sales, total costs, on time delivery rate, days receivable outstanding. Present the topic in a bit more detail with this Automotive Industry Technology Supply Chain Performance Tracking Dashboard TC SS. Use it as a tool for discussion and navigation on Total Net Sales, Total Costs, Cost Distribution, Order Accuracy Rate. This template is free to edit as deemed fit for your organization. Therefore download it now.
-
 Mobile Application Analytics Monitoring Dashboard
This slide depicts the mobile application analytics monitoring dashboard which include components such as installs, active users, sessions, media spends, etc. Introducing our Mobile Application Analytics Monitoring Dashboard set of slides. The topics discussed in these slides are Spends By Channel, Top App Events, Installs By Source. This is an immediately available PowerPoint presentation that can be conveniently customized. Download it and convince your audience.
-
 Dashboard To Evaluate Performance Of Wealth Management Wealth Management Techniques Fin SS V
This slide shows dashboard which can be used by wealth management organizations to measure the performance . It includes metrics such as assets under management, satisfaction rate, revenue, etc. Deliver an outstanding presentation on the topic using this Dashboard To Evaluate Performance Of Wealth Management Wealth Management Techniques Fin SS V Dispense information and present a thorough explanation of Assets Under Management, Client Retention Rate using the slides given. This template can be altered and personalized to fit your needs. It is also available for immediate download. So grab it now.
-
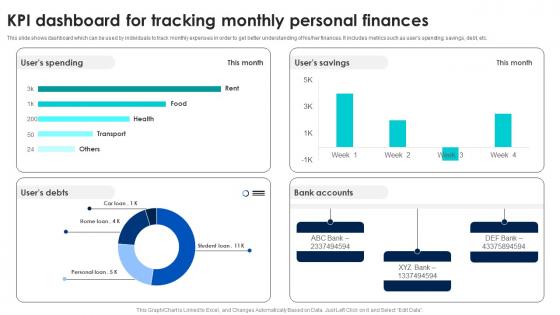 Mobile Banking Applications KPI Dashboard For Tracking Monthly Personal Finances Fin SS V
This slide shows dashboard which can be used by individuals to track monthly expenses in order to get better understanding of his or her finances. It includes metrics such as users spending, savings, debt, etc. Present the topic in a bit more detail with this Mobile Banking Applications KPI Dashboard For Tracking Monthly Personal Finances Fin SS V. Use it as a tool for discussion and navigation on Debts, Spending, Savings, Bank Accounts. This template is free to edit as deemed fit for your organization. Therefore download it now.
-
 Dashboard For Tracking Various Ag Tech Adoption To Boost Crop Productivity TC SS
This slide provides glimpse about dashboard that can help in tracking and managing different agricultural tasks. It includes parameters such as yield, weather, reminder, soil details, etc. Deliver an outstanding presentation on the topic using this Dashboard For Tracking Various Ag Tech Adoption To Boost Crop Productivity TC SS. Dispense information and present a thorough explanation of Total Crop, Total Yield, Total Revenue, Hurricane using the slides given. This template can be altered and personalized to fit your needs. It is also available for immediate download. So grab it now.
-
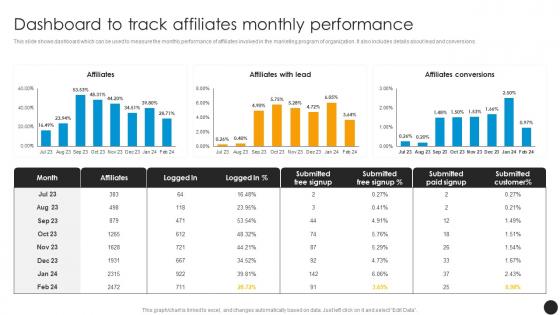 Dashboard To Track Affiliates Monthly Performance Affiliate Program To Expand Product Reach
This slide shows dashboard which can be used to measure the monthly performance of affiliates involved in the marketing program of organization. It also includes details about lead and conversions. Present the topic in a bit more detail with this Dashboard To Track Affiliates Monthly Performance Affiliate Program To Expand Product Reach. Use it as a tool for discussion and navigation on Affiliates, Affiliates Conversions, Submitted Paid Signup, Submitted. This template is free to edit as deemed fit for your organization. Therefore download it now.
-
 Dashboard To Track Effectiveness Of Affiliate Marketing Affiliate Program To Expand Product Reach
This slide shows dashboard which can be used to measure affiliate marketing program performance. It involves details such as affiliate licenses, solution licenses and program performance. Deliver an outstanding presentation on the topic using this Dashboard To Track Effectiveness Of Affiliate Marketing Affiliate Program To Expand Product Reach. Dispense information and present a thorough explanation of Affiliate Licenses, Solution Licenses, Balance, Solution Program, Performance using the slides given. This template can be altered and personalized to fit your needs. It is also available for immediate download. So grab it now.
-
 Sales Representative Dashboard To Measure Gamification Impact
This slide shows a dashboard which can be used by organizations to measure and evaluate sales gamification performance of employees after gamifying the sales tasks. It includes elements such as league, badge, missions completed, cold calls, etc. Presenting our well structured Sales Representative Dashboard To Measure Gamification Impact. The topics discussed in this slide are Diamond, Nora Sales Representative, Missions. This is an instantly available PowerPoint presentation that can be edited conveniently. Download it right away and captivate your audience.
-
 Dashboard For Tracking Green Finance Initiatives
This slide represents dashboard to track green finance activities including elements such as progress, budget allocation, etc. Introducing our Dashboard For Tracking Green Finance Initiatives set of slides. The topics discussed in these slides are Green Finance For 2026, Energy Usage By MonthsThis is an immediately available PowerPoint presentation that can be conveniently customized. Download it and convince your audience.
-
 HR Payroll Dashboard For Enhancing Labour Relations
This slide showcases the human resource payroll dashboard for improving employee relations by providing better salaries which helps an organization to increase labour retention rates. It include details such as departmental gross salary breakdown, gender based labour classification, etc. Presenting our well structured HR Payroll Dashboard For Enhancing Labour Relations The topics discussed in this slide are Payroll Tax Compliance, Departmental Gross Salary BreakdownThis is an instantly available PowerPoint presentation that can be edited conveniently. Download it right away and captivate your audience.
-
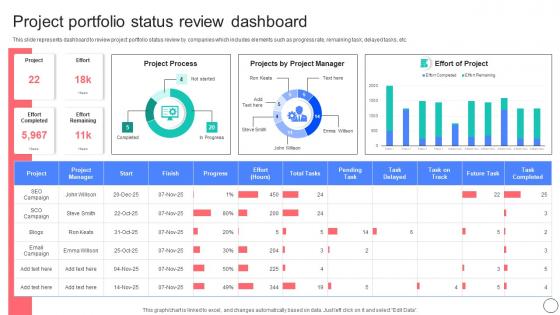 Project Portfolio Status Review Dashboard
This slide represents dashboard to review project portfolio status review by companies which includes elements such as progress rate, remaining task, delayed tasks, etc. Introducing our Project Portfolio Status Review Dashboard set of slides. The topics discussed in these slides are Project Process, Projects By Project Manager, Effort Of ProjectThis is an immediately available PowerPoint presentation that can be conveniently customized. Download it and convince your audience.
-
 Dashboard To Track Website Traffic By Adopting Responsive Website
This slide covers KPI dashboard to track website traffic by implementing responsive website design. It involves details such as total sessions, page views, website traffic on monthly basis. Introducing our Dashboard To Track Website Traffic By Adopting Responsive Website set of slides. The topics discussed in these slides are Monthly Basis,Page Views,Website Visits.This is an immediately available PowerPoint presentation that can be conveniently customized. Download it and convince your audience.
-
 Kpi Dashboard To Assess Responsive Website Performance
Introducing our premium set of slides with Kpi Dashboard To Assess Responsive Website Performance Introducing our Kpi Dashboard To Assess Responsive Website Performance set of slides. The topics discussed in these slides are Monthly Bounce Rate, Return Visitor Information.This is an immediately available PowerPoint presentation that can be conveniently customized. Download it and convince your audience.
-
 Identity And Access Management Insights Reporting Dashboard Securing Systems With Identity
This slide represents the reporting dashboard of the Identity and Access Management process. The purpose of this slide is to showcase the IAM insights reporting dashboard, and the components include syslog errors, system checks, failed task results, etc. Deliver an outstanding presentation on the topic using this Identity And Access Management Insights Reporting Dashboard Securing Systems With Identity Dispense information and present a thorough explanation of Failed Task Results, Syslog Errors, Certifications Trends using the slides given. This template can be altered and personalized to fit your needs. It is also available for immediate download. So grab it now.
-
 KPI Dashboard To Track QR Code Marketing Campaign
The purpose of this slide is to showcase how a KPI dashboard enhances QR code marketing campaigns by providing real-time insights. It aids it informed decision-making, and maximizing ROI. Introducing our KPI Dashboard To Track QR Code Marketing Campaign set of slides. The topics discussed in these slides are Total Number Conversion, Total Number Impressions, Monthly Actual Conversions. This is an immediately available PowerPoint presentation that can be conveniently customized. Download it and convince your audience.
-
 KPI Dashboard To Track QR Code Marketing Performance
The purpose of this slide is to illustrate how employing a KPI dashboard to track QR code marketing performance streamlines monitoring. It enhances decision-making for achieving campaign objectives effectively. Presenting our well structured KPI Dashboard To Track QR Code Marketing Performance. The topics discussed in this slide are Scans, Operating System, Cities. This is an instantly available PowerPoint presentation that can be edited conveniently. Download it right away and captivate your audience.
-
 Insurance Customer Analysis KPI Dashboard Navigating The Future Of Insurance Data Analytics SS
This slide outlines a dashboard graphically representing analysis of existing as well as newly acquired insurance customers. It covers metrics such as premium amount, claim amount, claims per month, claims by status, etc. Present the topic in a bit more detail with this Insurance Customer Analysis KPI Dashboard Navigating The Future Of Insurance Data Analytics SS. Use it as a tool for discussion and navigation on Premium Amount Generated, Claim Amount Generated, Customers By Age Group. This template is free to edit as deemed fit for your organization. Therefore download it now.
-
 KPI Dashboard To Analyse Insurance Claim Navigating The Future Of Insurance Data Analytics SS
This slide provides a dashboard utilising insurance claim processing using data analytics techniques. It covers details on various metrics such as number of claims, claims as per type, amount in claims, trend in claims, etc. Deliver an outstanding presentation on the topic using this KPI Dashboard To Analyse Insurance Claim Navigating The Future Of Insurance Data Analytics SS. Dispense information and present a thorough explanation of Claims According To Type, Business using the slides given. This template can be altered and personalized to fit your needs. It is also available for immediate download. So grab it now.
-
 KPI Dashboard To Predict Insurance Claims Navigating The Future Of Insurance Data Analytics SS
This slide provides a dashboard explaining prediction of claim insurances to increase users for the insurance business. It covers metrics such as total claims, claim loss, claim ratio, status, type and loss. Present the topic in a bit more detail with this KPI Dashboard To Predict Insurance Claims Navigating The Future Of Insurance Data Analytics SS. Use it as a tool for discussion and navigation on Claim Loss, Claim Ratio, Claims Incurred. This template is free to edit as deemed fit for your organization. Therefore download it now.
-
 Dashboard To Monitor Cash Flow Position Resolving Corporate Issues
This slide provides a dedicated dashboard for monitoring the organizations cash flow position. It offers a real-time view of cash flow status. Key performance metrics covered in the dashboard relate to cash in hand, profit or loss, cash flow, etc. Present the topic in a bit more detail with this Dashboard To Monitor Cash Flow Position Resolving Corporate Issues. Use it as a tool for discussion and navigation on Cash Flow, Profit, Loss. This template is free to edit as deemed fit for your organization. Therefore download it now.
-
 Organization Finance Management Dashboard Resolving Corporate Issues
This dashboard slide introduces an organizational finance management dashboard that provides a holistic view of financial performance. Key performance metrics covered in the dashboard relate to accounts receivable, accounts payable, revenue, etc. Present the topic in a bit more detail with this Organization Finance Management Dashboard Resolving Corporate Issues. Use it as a tool for discussion and navigation on Gross Profit Margin, Accounts Receivable, Debt Equity. This template is free to edit as deemed fit for your organization. Therefore download it now.
-
 Monthly Comparison Dashboard For Customer Support Decisions
This slide illustrates KPI or dashboard of monthly comparison to support data driven decision making within team including sales performance, new accounts, and monthly recurring revenue. Introducing our Monthly Comparison Dashboard For Customer Support Decisions set of slides. The topics discussed in these slides are Comparison, Dashboard, Support Decisions. This is an immediately available PowerPoint presentation that can be conveniently customized. Download it and convince your audience.
-
 Marketing Communication Channel Dashboard For Google Ads
This slide depicts key performance indicators and metrics for various marketing communication channels to facilitate data-driven decision-making and optimization strategies. Introducing our Marketing Communication Channel Dashboard For Google Ads set of slides. The topics discussed in these slides are Communication, Dashboard, Marketing. This is an immediately available PowerPoint presentation that can be conveniently customized. Download it and convince your audience.
-
 Social Media Communication Channels Kpi Dashboard
This slide depicts the key performance indicators for social media communication channels, aiding in monitoring, analyzing, and optimizing social media strategies effectively. Introducing our Social Media Communication Channels Kpi Dashboard set of slides. The topics discussed in these slides are Communication, Dashboard, Social Media. This is an immediately available PowerPoint presentation that can be conveniently customized. Download it and convince your audience.
-
 Data Center Migration Dashboard For Risk Mitigation
This slide illustrates KPI or Dashboard to identify improvement areas of data center migration including server type, server OS, migration recommendation, etc. Presenting our well structured Data Center Migration Dashboard For Risk Mitigation. The topics discussed in this slide are Migration, Dashboard, Mitigation. This is an instantly available PowerPoint presentation that can be edited conveniently. Download it right away and captivate your audience.
-
 It Infrastructure Data Center Migration Dashboard
This slide illustrates KPI or dashboard of data center cloud migration including network connection and node data, response time, and pending requests. Presenting our well structured It Infrastructure Data Center Migration Dashboard. The topics discussed in this slide are Infrastructure, Migration, Dashboard. This is an instantly available PowerPoint presentation that can be edited conveniently. Download it right away and captivate your audience.
-
 Migration Dashboard To Monitor Data Center
This slide illustrates data center migration KPI or Dashboard including data center server distribution, application deployment status, application status overview, etc Introducing our Migration Dashboard To Monitor Data Center set of slides. The topics discussed in these slides are Migration, Dashboard, Data Center. This is an immediately available PowerPoint presentation that can be conveniently customized. Download it and convince your audience.
-
 Kpi Dashboard To Monitor E Commerce Marketing Campaign
This slide represents the dashboard to monitor performance of ecommerce marketing campaign plan effectively. This includes various KPIs such as customer value, Advertising budget, Branded search, etc. Presenting our well structured Kpi Dashboard To Monitor E Commerce Marketing Campaign. The topics discussed in this slide are Dashboard, Marketing, Campaign. This is an instantly available PowerPoint presentation that can be edited conveniently. Download it right away and captivate your audience.
-
 Residential Dashboard Effective Guide For Real Estate Management System Implementation
Mentioned slide displays performance monitoring dashboard which can be used by property management businesses to improve customer service. It includes key components such as income performance overview, outstanding balances, maintenance request, schedule, and tenants. Present the topic in a bit more detail with this Residential Dashboard Effective Guide For Real Estate Management System Implementation. Use it as a tool for discussion and navigation on Management, Dashboard, Residential. This template is free to edit as deemed fit for your organization. Therefore download it now.
-
 Investment Portfolio Dashboard For It Project Effective Guide For Project Investment Analysis
This slide showcase financial project investment analysis for project. It includes elements such as project budget, planned, budget breakup, spend breakup etc. Present the topic in a bit more detail with this Investment Portfolio Dashboard For It Project Effective Guide For Project Investment Analysis. Use it as a tool for discussion and navigation on Total Project Budget, Project Financials Dashboard, Pending Invoices. This template is free to edit as deemed fit for your organization. Therefore download it now.
-
 Project Financial Investment Analysis Dashboard Effective Guide For Project Investment Analysis
This slide showcases financial investment analysis dashboard for project. It includes elements such as total investment, rate of return, group-wise investment, yearly investment etc. Deliver an outstanding presentation on the topic using this Project Financial Investment Analysis Dashboard Effective Guide For Project Investment Analysis. Dispense information and present a thorough explanation of Total Invested Amount, Group Wise Investment, Yearly Investment using the slides given. This template can be altered and personalized to fit your needs. It is also available for immediate download. So grab it now.
-
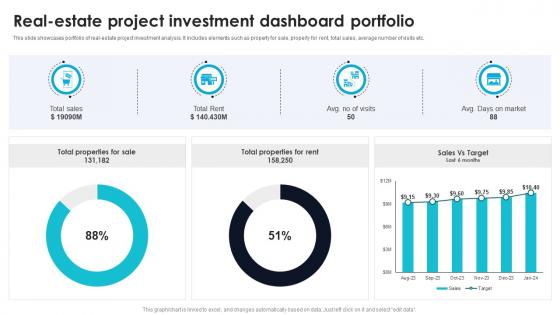 Real Estate Project Investment Dashboard Portfolio Effective Guide For Project Investment Analysis
This slide showcases portfolio of real-estate project investment analysis. It includes elements such as property for sale, property for rent, total sales, average number of visits etc. Deliver an outstanding presentation on the topic using this Real Estate Project Investment Dashboard Portfolio Effective Guide For Project Investment Analysis. Dispense information and present a thorough explanation of Sales Vs Target, Total Properties, Total Rent, Total Sales using the slides given. This template can be altered and personalized to fit your needs. It is also available for immediate download. So grab it now.
-
 Dashboard Analysis For Tracking Agricultural Tasks Sustainable Farming Methodologies For Mitigating
This slide showcases the KPIs that would help to track the improvements with adoption of new sustainable agriculture practices. It includes current tasks, crops, harvest, todays weather, summary, etc. Deliver an outstanding presentation on the topic using this Dashboard Analysis For Tracking Agricultural Tasks Sustainable Farming Methodologies For Mitigating. Dispense information and present a thorough explanation of Dashboard, Crops, Fertilization, Upcoming Week using the slides given. This template can be altered and personalized to fit your needs. It is also available for immediate download. So grab it now.
-
 Vulnerability Analyzing Dashboard For Exploratory Testing
This slide showcases the vulnerability analyzing dashboard for exploratory testing based on various parameters such as issue status, ID, etc. Present the topic in a bit more detail with this Vulnerability Analyzing Dashboard For Exploratory Testing Use it as a tool for discussion and navigation on Vulnerability Analyzing Dashboard, Exploratory Testing This template is free to edit as deemed fit for your organization. Therefore download it now.
-
 Employee Accountability Dashboard For Improving Performance
This slide illustrates KPI or Dashboard of employee accountability including onset, departure, effective time, workplace time, role in group or community, effectiveness percentage, etc. Introducing our Employee Accountability Dashboard For Improving Performance set of slides. The topics discussed in these slides are Accountability, Dashboard, Performance. This is an immediately available PowerPoint presentation that can be conveniently customized. Download it and convince your audience.


