Powerpoint Templates and Google slides for Dash
Save Your Time and attract your audience with our fully editable PPT Templates and Slides.
-
 Leadership Training Program Management Dashboard
The slide shows a dashboard for successfully organizing and managing a leadership training workshop for leaders and managers. It includes training demands, budget, approved demands, total cost, participating leaders, cost per attendee, total hours of training, etc. Presenting our well structured Leadership Training Program Management Dashboard. The topics discussed in this slide are Training Hours vs, Targeted Hours, Actual Cost vs, Training Budget. This is an instantly available PowerPoint presentation that can be edited conveniently. Download it right away and captivate your audience.
-
 Conformance Testing Performance Tracking Dashboard Snapshot Ppt Inspiration
This slide depicts the conformance testing performance tracking dashboard by covering details of test case analysis, tests linked to requirements, test case breakdown, tests per requirement, and so on. Deliver an outstanding presentation on the topic using this Conformance Testing Performance Tracking Dashboard Ppt Inspiration. Dispense information and present a thorough explanation of Conformance Testing, Performance Tracking, Dashboard using the slides given. This template can be altered and personalized to fit your needs. It is also available for immediate download. So grab it now.
-
 Dashboard To Track Project Essential Activities Project Team Engagement Activities
This slide provides information about dashboard to track project essential activities by tracking project schedule, budget, resources, etc. Present the topic in a bit more detail with this Dashboard To Track Project Essential Activities Project Team Engagement Activities. Use it as a tool for discussion and navigation on Dashboard, Information, Essential. This template is free to edit as deemed fit for your organization. Therefore download it now.
-
 Dashboard To Track Inventory Management Status Continuous Process Improvement In Supply Chain
This slide focuses on the dashboard to track inventory management status which covers annual stock conversion into sales, inventory turnover, inventory carrying cost and accuracy. Deliver an outstanding presentation on the topic using this Dashboard To Track Inventory Management Status Continuous Process Improvement In Supply Chain. Dispense information and present a thorough explanation of Management, Inventory Accuracy, Dashboard using the slides given. This template can be altered and personalized to fit your needs. It is also available for immediate download. So grab it now.
-
 Supply Chain Activity Tracking Dashboard Continuous Process Improvement In Supply Chain
This slide shows the dashboard that depicts supply chain management which includes retailer and warehouse capacity, delivery status from supplier to warehouse, time to reach there, etc Present the topic in a bit more detail with this Supply Chain Activity Tracking Dashboard Continuous Process Improvement In Supply Chain. Use it as a tool for discussion and navigation on Dashboard, Management, Warehouse. This template is free to edit as deemed fit for your organization. Therefore download it now.
-
 B2b Prospects Performance Measurement Dashboard B2b Sales Representatives Guidelines Playbook
This slide provides information regarding B2B performance tracking dashboard to measure leads, MQL, SQL, customers, revenue goals, total media spend. Deliver an outstanding presentation on the topic using this B2b Prospects Performance Measurement Dashboard B2b Sales Representatives Guidelines Playbook. Dispense information and present a thorough explanation of Performance, Measurement, Dashboard using the slides given. This template can be altered and personalized to fit your needs. It is also available for immediate download. So grab it now.
-
 B2b Sales Representatives Guidelines Playbook B2b Sales Representatives Performance Tracking Dashboard
This slide provides information regarding B2B sales representatives performance tracking dashboard to measure leads by region, revenue breakdown, top performers by leads, revenues, etc. Present the topic in a bit more detail with this B2b Sales Representatives Guidelines Playbook B2b Sales Representatives Performance Tracking Dashboard. Use it as a tool for discussion and navigation on Representatives, Performance, Dashboard. This template is free to edit as deemed fit for your organization. Therefore download it now.
-
 Sales Management Activities Tracking Dashboard B2b Sales Representatives Guidelines Playbook
This slide provides information regarding sales management activities tracking dashboard to measure closed business, sales pipeline, sales activity by sales rep, month over month growth, forecast by month, etc. Present the topic in a bit more detail with this Sales Management Activities Tracking Dashboard B2b Sales Representatives Guidelines Playbook. Use it as a tool for discussion and navigation on Management, Dashboard, Information. This template is free to edit as deemed fit for your organization. Therefore download it now.
-
 Monthly Sales Report Dashboard Snapshot With Churn Rate
The following slide highlights the monthly sales report dashboard snapshot with churn rate. It showcases details for current month sales, total revenue, current month profit, current month cost, sales revenue, current month expense, revenue churn rate and accumulated revenue. Presenting our well structured Monthly Sales Report Dashboard With Churn Rate. The topics discussed in this slide are Current Month Sales, Total Revenue, Current Month Expense. This is an instantly available PowerPoint presentation that can be edited conveniently. Download it right away and captivate your audience.
-
 F317 Project Management Dashboard To Track Essential Activities Project Team Engagement Activities
This slide provides information about dashboard to track project essential activities by tracking project schedule, budget, risks, etc. Present the topic in a bit more detail with this F317 Project Management Dashboard To Track Essential Activities Project Team Engagement Activities. Use it as a tool for discussion and navigation on Management, Dashboard, Information. This template is free to edit as deemed fit for your organization. Therefore download it now.
-
 Dashboard To Track Social Media Ads Campaign Results Social Media Marketing Strategic
This slide showcases dashboard that can help organization to track performance of social media advertising campaigns. Its key components are cost per conversion, CTR, link clicks, impressions, conversion rate, click through rate and cost per click. Deliver an outstanding presentation on the topic using this Dashboard To Track Social Media Ads Campaign Results Social Media Marketing Strategic. Dispense information and present a thorough explanation of Dashboard, Social Media, Campaign Results using the slides given. This template can be altered and personalized to fit your needs. It is also available for immediate download. So grab it now.
-
 Dashboard To Track Social Media Marketing Strategic
This slide showcases dashboard that can help organization to track the metrics of social media marketing campaign. Its key components are followers, post reach, page impressions, visitors, avg engagement and lifetime views. Present the topic in a bit more detail with this Dashboard To Track Social Media Marketing Strategic. Use it as a tool for discussion and navigation on Dashboard, Social Media Marketing, Campaign Metrics. This template is free to edit as deemed fit for your organization. Therefore download it now.
-
 Aftersales Services Dashboard For Customer Satisfaction And Retention
This slide defines the after sales services dashboard for measuring the customer satisfaction and retention. It includes information related to revenues, requests and cost. Presenting our well structured Aftersales Services Dashboard For Customer Satisfaction And Retention. The topics discussed in this slide are Services, Dashboard, Satisfaction. This is an instantly available PowerPoint presentation that can be edited conveniently. Download it right away and captivate your audience.
-
 Saas Security Analysis With Kpi Dashboard
The following slide highlights the assessment of Software as a security to meet safety standards. It includes key elements such as critical incidents, risk analysis, number of open tasks etc. Introducing our Saas Security Analysis With Kpi Dashboard set of slides. The topics discussed in these slides are Analysis, Dashboard, Assessment. This is an immediately available PowerPoint presentation that can be conveniently customized. Download it and convince your audience.
-
 Talent Acquisition And Transformation Analysis Dashboard
This Slide Defines The Analysis Dashboard For Talent Acquisition And Transformation It Includes Information Related To The Employee Cost, Revenue, Turnover Rate And Survey Results. Presenting our well structured Talent Acquisition And Transformation Analysis Dashboard. The topics discussed in this slide are Acquisition, Transformation, Analysis. This is an instantly available PowerPoint presentation that can be edited conveniently. Download it right away and captivate your audience.
-
 Determine Team Performance Tracking Dashboard Assessment Of Staff Productivity Across Workplace
This slide provides information about team performance management dashboard by tracking customer concern resolution rate, top people involved, etc. Present the topic in a bit more detail with this Determine Team Performance Tracking Dashboard Assessment Of Staff Productivity Across Workplace. Use it as a tool for discussion and navigation on Performance, Dashboard, Information. This template is free to edit as deemed fit for your organization. Therefore download it now.
-
 Dashboard Depicting Sales And Customer Analytics Retail Merchandising Plan
This slide focuses on dashboard that depicts sales and customer analytics which covers sales revenue, average transaction rate, out of stock items, sales by division, monthly visitors, etc. Deliver an outstanding presentation on the topic using this Dashboard Depicting Sales And Customer Analytics Retail Merchandising Plan. Dispense information and present a thorough explanation of Total Customers, Transaction Price, Sales Revenue using the slides given. This template can be altered and personalized to fit your needs. It is also available for immediate download. So grab it now.
-
 Retail Analytics Dashboard To Measure Merchandise Planning Effectiveness Retail Merchandising Plan
This slide shows the retail analytics dashboard to measure merchandise planning effectiveness which includes conversion rate, sell through rate, return on investment, website traffic, abandonment rate, etc. Deliver an outstanding presentation on the topic using this Retail Analytics Dashboard To Measure Merchandise Planning Effectiveness Retail Merchandising Plan. Dispense information and present a thorough explanation of Sell Through Rate, Conversation Rate, Return On Investment using the slides given. This template can be altered and personalized to fit your needs. It is also available for immediate download. So grab it now.
-
 Project Management Dashboard To Track Essential Activities Managing Project Effectively Playbook
This slide provides information about dashboard to track project essential activities by tracking project schedule, budget, risks, etc. Deliver an outstanding presentation on the topic using this Project Management Dashboard To Track Essential Activities Managing Project Effectively Playbook. Dispense information and present a thorough explanation of Management, Dashboard, Essential using the slides given. This template can be altered and personalized to fit your needs. It is also available for immediate download. So grab it now.
-
 Insurance Claim Process Tracking Dashboard
This slide showcases the insurance claim process tracking dashboard. It includes elements such as claim amount, payout and denied claims and status analysis. Introducing our Insurance Claim Process Tracking Dashboard set of slides. The topics discussed in these slides are Insurance Claim Process, Tracking Dashboard. This is an immediately available PowerPoint presentation that can be conveniently customized. Download it and convince your audience.
-
 Dashboard For IT Governance Implementation Ppt Powerpoint Presentation Inspiration Rules
This slide depicts the dashboard for IT governance implementation, including return on investment of the IT department, spend vs. budget, IT cost breakdown, and IT costs vs. income. Deliver an outstanding presentation on the topic using this Dashboard For IT Governance Implementation Ppt Powerpoint Presentation Inspiration Rules. Dispense information and present a thorough explanation of IT Cost Breakdown, Spend Vs Budget, IT Costs Vs Income using the slides given. This template can be altered and personalized to fit your needs. It is also available for immediate download. So grab it now.
-
 Customer Project Cost Dashboard Snapshot With Manager Task Workload
This graph or chart is linked to excel, and changes automatically based on data. Just left click on it and select Edit Data. Introducing our Customer Project Cost Dashboard Snapshot With Manager Task Workload set of slides. The topics discussed in these slides are Project Manager Workload, Customer Project Revenue, Task Delivery Status. This is an immediately available PowerPoint presentation that can be conveniently customized. Download it and convince your audience.
-
 IT Project Costs Dashboard Snapshot With Return On Investment
This graph or chart is linked to excel, and changes automatically based on data. Just left click on it and select Edit Data. Presenting our well structured IT Project Costs Dashboard Snapshot With Return On Investment. The topics discussed in this slide are IT Department Return, IT Cost Break, IT Costs vs. This is an instantly available PowerPoint presentation that can be edited conveniently. Download it right away and captivate your audience.
-
 Project Budget Cost Dashboard Snapshot For Financial Year
This graph or chart is linked to excel, and changes automatically based on data. Just left click on it and select Edit Data. Presenting our well structured Project Budget Cost Dashboard Snapshot For Financial Year. The topics discussed in this slide are Project Budget, Projected Budget, Employee Satisfaction. This is an instantly available PowerPoint presentation that can be edited conveniently. Download it right away and captivate your audience.
-
 Project Costs Dashboard With Allocated And Used Budget
This graph or chart is linked to excel, and changes automatically based on data. Just left click on it and select Edit Data. Introducing our Project Costs Dashboard With Allocated And Used Budget set of slides. The topics discussed in these slides are Allocated Budget, Across Portfolios, Estimated Cost. This is an immediately available PowerPoint presentation that can be conveniently customized. Download it and convince your audience.
-
 Project Costs Dashboard Snapshot With Employee Workload
This graph or chart is linked to excel, and changes automatically based on data. Just left click on it and select Edit Data. Presenting our well structured Project Costs Dashboard Snapshot With Employee Workload. The topics discussed in this slide are Upcoming Deadlines, Overdue Tasks, Project Budget. This is an instantly available PowerPoint presentation that can be edited conveniently. Download it right away and captivate your audience.
-
 Project Costs Dashboard With Yearly Billing
This graph or chart is linked to excel, and changes automatically based on data. Just left click on it and select Edit Data. Introducing our Project Costs Dashboard With Yearly Billing set of slides. The topics discussed in these slides are Top Five Budget, Project Billing Year, Type And Stage. This is an immediately available PowerPoint presentation that can be conveniently customized. Download it and convince your audience.
-
 Project Costs Saving And Avoidance Dashboard Snapshot
This graph or chart is linked to excel, and changes automatically based on data. Just left click on it and select Edit Data. Presenting our well structured Project Costs Saving And Avoidance Dashboard Snapshot. The topics discussed in this slide are Procurement ROI, Cost Purchase Order, Cost Savings. This is an instantly available PowerPoint presentation that can be edited conveniently. Download it right away and captivate your audience.
-
 Project Costs Spend Under Management Dashboard
This graph or chart is linked to excel, and changes automatically based on data. Just left click on it and select Edit Data. Introducing our Project Costs Spend Under Management Dashboard set of slides. The topics discussed in these slides are Top Suppliers, New Contracts, Top Buyers. This is an immediately available PowerPoint presentation that can be conveniently customized. Download it and convince your audience.
-
 Project Forecast Cost Analysis Dashboard Snapshot
This graph or chart is linked to excel, and changes automatically based on data. Just left click on it and select Edit Data. Presenting our well structured Project Forecast Cost Analysis Dashboard snapshot. The topics discussed in this slide are Projects Forecast, Cost Analysis, Forecast Cost. This is an instantly available PowerPoint presentation that can be edited conveniently. Download it right away and captivate your audience.
-
 Project Quality Assurance Strategy Evaluation Dashboard
This slide covers project quality assurance strategy evaluation dashboard. It involves all details such as total number of evaluation, average score of teams, perfect score, score of top performers. Presenting our well structured Project Quality Assurance Strategy Evaluation Dashboard. The topics discussed in this slide are Quality Evaluations, Average Score Teams, Perfect Scores. This is an instantly available PowerPoint presentation that can be edited conveniently. Download it right away and captivate your audience.
-
 Machinery Spare Parts Inventory Dashboard Status Report
This slide depicts the dashboard for stock in the automobile company warehouse. It includes available quantity, reorder, in delivery, stock value, average net profit, value of sold and received inventory. Presenting our well structured Machinery Spare Parts Inventory Dashboard Status Report. The topics discussed in this slide are Machinery Spare Parts, Inventory Dashboard. This is an instantly available PowerPoint presentation that can be edited conveniently. Download it right away and captivate your audience.
-
 Information Technology Security Dashboard With Incident And Threat Management
This slide shows the dashboard of cyber security with incidents and threat management. It includes overall progress, risk identified , number of critical incidents, initiative , incident and threat management etc. Introducing our Information Technology Security Dashboard With Incident And Threat Management set of slides. The topics discussed in these slides are Threat Management, Incident Management, Critical Risks Identified. This is an immediately available PowerPoint presentation that can be conveniently customized. Download it and convince your audience.
-
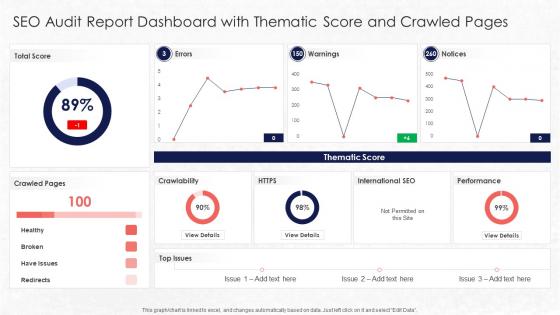 SEO Audit Report Dashboard With Thematic Score Evaluate The Current State Of Clients Website Traffic
Present the topic in a bit more detail with this SEO Audit Report Dashboard With Thematic Score Evaluate The Current State Of Clients Website Traffic. Use it as a tool for discussion and navigation on Thematic Score, Crawled Pages, Crawlability. This template is free to edit as deemed fit for your organization. Therefore download it now.
-
 Dashboard Procurement Analysis Purchasing Analytics Tools And Techniques
This slide covers the procurement analysis dashboard including KPIs including total invoices, discount savings, etc. Present the topic in a bit more detail with this Dashboard Procurement Analysis Purchasing Analytics Tools And Techniques. Use it as a tool for discussion and navigation on Dashboard Procurement Analysis. This template is free to edit as deemed fit for your organization. Therefore download it now.
-
 Procurement Spend Analysis Dashboard Procurement Analysis Ppt Infographics
This slide covers the procurement analysis dashboard including KPIs including total invoices, discount savings, etc. Deliver an outstanding presentation on the topic using this Procurement Spend Analysis Dashboard Procurement Analysis Ppt Infographics. Dispense information and present a thorough explanation of Dashboard Procurement Analysis using the slides given. This template can be altered and personalized to fit your needs. It is also available for immediate download. So grab it now.
-
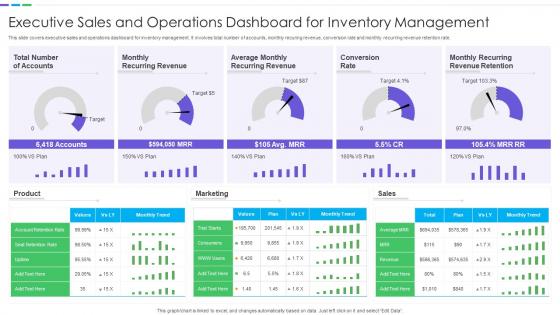 Executive Sales And Operations Dashboard Snapshot For Inventory Management
This slide covers executive sales and operations dashboard snapshot for inventory management. It involves total number of accounts, monthly recuring revenue, conversion rate and monthly recurring revenue retention rate. Introducing our Executive Sales And Operations Dashboard For Inventory Management set of slides. The topics discussed in these slides are Monthly Recurring Revenue, Conversion Rate, Recurring Revenue Retention. This is an immediately available PowerPoint presentation that can be conveniently customized. Download it and convince your audience.
-
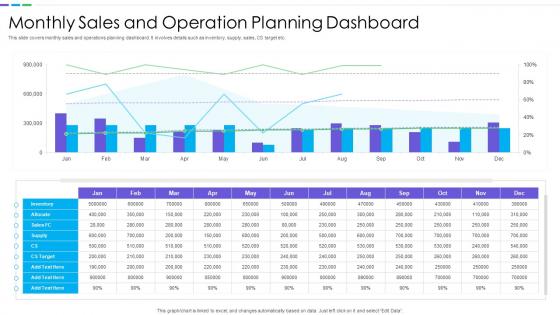 Monthly Sales And Operation Planning Dashboard
This slide covers monthly sales and operations planning dashboard. It involves details such as inventory, supply, sales, CS target etc. Presenting our well structured Monthly Sales And Operation Planning Dashboard. The topics discussed in this slide are Monthly Sales, Operation Planning, Dashboard. This is an instantly available PowerPoint presentation that can be edited conveniently. Download it right away and captivate your audience.
-
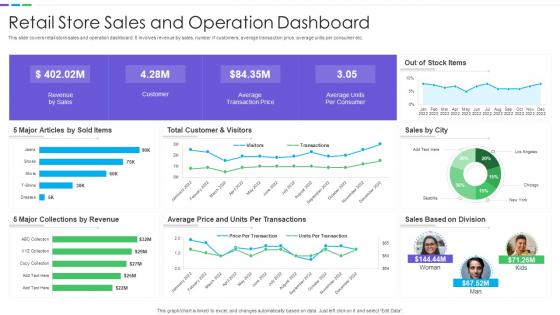 Retail Store Sales And Operation Dashboard
This slide covers retail store sales and operation dashboard. It involves revenue by sales, number if customers, average transaction price, average units per consumer etc. Introducing our Retail Store Sales And Operation Dashboard set of slides. The topics discussed in these slides are Retail Store Sales, Operation Dashboard. This is an immediately available PowerPoint presentation that can be conveniently customized. Download it and convince your audience.
-
 Sales And Operation Dashboard For Performance Management
This slide covers sales and operation dashboard for performance management. It involves details such as number of new buyers, sales revenue, average revenue per unit etc. Presenting our well structured Sales And Operation Dashboard For Performance Management. The topics discussed in this slide are Customer Lifetime Value, Customer Acquisition Cost, Average Revenue Per Unit. This is an instantly available PowerPoint presentation that can be edited conveniently. Download it right away and captivate your audience.
-
 Sales And Operation Dashboard To Analyze Performance
This slide covers sales and operation dashboard to analyze performance. It involves sales, revenue, profit, sale size and monthly productivity. Introducing our Sales And Operation Dashboard To Analyze Performance set of slides. The topics discussed in these slides are Sales, Revenue, Profit. This is an immediately available PowerPoint presentation that can be conveniently customized. Download it and convince your audience.
-
 Sales And Operations Dashboard Snapshot For Distribution Company
This slide covers sales and operations dashboard for distribution company. It involves details such as total sales by location, gross margin, monthly sales trends, average revenue and sales by major customers. Presenting our well structured Sales And Operations Dashboard Snapshot For Distribution Company. The topics discussed in this slide are Monthly Sales Trend, Actual Vs Budget, Gross Margin. This is an instantly available PowerPoint presentation that can be edited conveniently. Download it right away and captivate your audience.
-
 Sales And Operations Dashboard For Ecommerce Business
This slide covers sales and operations dashboard for ecommerce business. It involves details such as total sales generated, number of brands, total revenue generated, number of units sold and gender and age range breakdown. Introducing our Sales And Operations Dashboard For Ecommerce Business set of slides. The topics discussed in these slides are Sales And Operations, Dashboard, Ecommerce Business. This is an immediately available PowerPoint presentation that can be conveniently customized. Download it and convince your audience.
-
 Sales And Operations Dashboard To Drive Effective Productivity
This slide covers sales and operations dashboard to drive effective productivity. It involves details such as number of account assigned, working accounts, engaged accounts and total account activity. Presenting our well structured Sales And Operations Dashboard To Drive Effective Productivity. The topics discussed in this slide are Working Accounts, Account Activity, Meeting Booking. This is an instantly available PowerPoint presentation that can be edited conveniently. Download it right away and captivate your audience.
-
 Sales And Operations KPI Dashboard To Increase Efficiency
This slide covers sales and operations KPI dashboard to increase efficiency. It involves performance, increase in profit, target, monthly profit and quarterly revenue trend. Introducing our Sales And Operations KPI Dashboard To Increase Efficiency set of slides. The topics discussed in these slides are Increase In Profit, Quartely Revenue Trend, Account In Arrear. This is an immediately available PowerPoint presentation that can be conveniently customized. Download it and convince your audience.
-
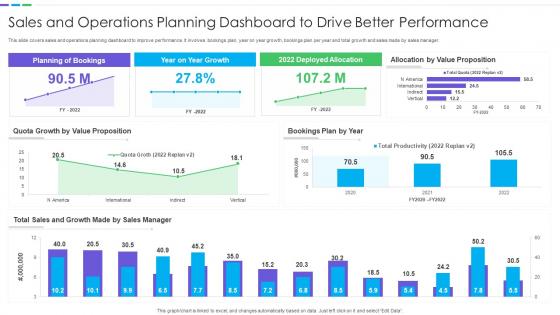 Sales And Operations Planning Dashboard To Drive Better Performance
This slide covers sales and operations planning dashboard to improve performance. It involves bookings plan, year on year growth, bookings plan per year and total growth and sales made by sales manager. Presenting our well structured Sales And Operations Planning Dashboard To Drive Better Performance. The topics discussed in this slide are Value Proposition, Sales And Growth, Sales Manager. This is an instantly available PowerPoint presentation that can be edited conveniently. Download it right away and captivate your audience.
-
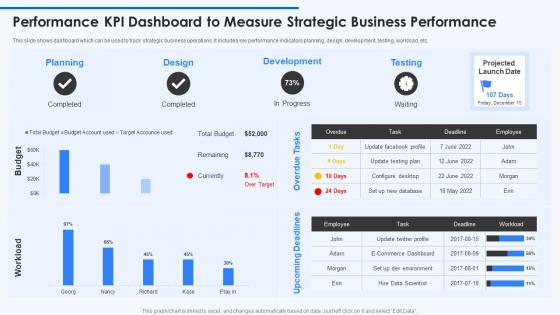 Performance KPI Dashboard To Measure Strategic Business Performance
This slide shows dashboard which can be used to track strategic business operations. It includes key performance indicators planning, design, development, testing, workload, etc. Presenting our well structured Performance KPI Dashboard To Measure Strategic Business Performance. The topics discussed in this slide are Planning, Development, Testing. This is an instantly available PowerPoint presentation that can be edited conveniently. Download it right away and captivate your audience.
-
 KPI Dashboard Snapshot To Measure 360 Degree Financial Strategy
This slide represents key performance indicator dashboard snapshot to analyse 360 degree financial strategy. It includes pie chart on revenue by product, summary and trends. Introducing our KPI Dashboard To Measure 360 Degree Financial Strategy set of slides. The topics discussed in these slides are Revenue Trend, Customer Information, Maintenance. This is an immediately available PowerPoint presentation that can be conveniently customized. Download it and convince your audience.
-
 Dashboard Highlighting Trends Of Artificial Intelligence In Global Market
Presenting our well structured Dashboard Highlighting Trends Of Artificial Intelligence In Global Market. The topics discussed in this slide are Global Market Value, Market Share, Supply Chain. This is an instantly available PowerPoint presentation that can be edited conveniently. Download it right away and captivate your audience.
-
 Customer Acquisition And Retention Dashboard With Loyal Customer Rate And CLV
This slide contains the complete dashboard of customer retention and acquisition matrix details. It includes current and previous months comparison of various types of KPIs used for strong customer base like customer churn, revenue churn, net retention and MRR growth. Introducing our Customer Acquisition And Retention Dashboard With Loyal Customer Rate And CLV set of slides. The topics discussed in these slides are Monthly Customer Churn Rate, Mrr Growth Rate, Monthly Revenue Churn Rate. This is an immediately available PowerPoint presentation that can be conveniently customized. Download it and convince your audience.
-
 Dashboard Depicting Metrics To Measure Effective Plan To Improve Consumer Brand Engagement
This slide shows dashboard that depicts metrics to measure customer experience that covers net revenue, customer retention, abandonment, unique visitors, etc. Present the topic in a bit more detail with this Dashboard Depicting Metrics To Measure Effective Plan To Improve Consumer Brand Engagement. Use it as a tool for discussion and navigation on Customer, Experience, Dashboard. This template is free to edit as deemed fit for your organization. Therefore download it now.
-
 Effective Plan To Improve Consumer Brand Engagement Customer Engagement Analytical Dashboard
This slide shows customer engagement analytical dashboard that covers total sales, total transaction, email received, links clicked, unique customer sales, sales comparison, customers name, product list, etc. Deliver an outstanding presentation on the topic using this Effective Plan To Improve Consumer Brand Engagement Customer Engagement Analytical Dashboard. Dispense information and present a thorough explanation of Engagement, Analytical, Dashboard using the slides given. This template can be altered and personalized to fit your needs. It is also available for immediate download. So grab it now.
-
 KPI Dashboard To Evaluate Competitive Sales Strategy Performance
The following slide showcases a performance KPI dashboard which can be used by marketer to examine competitive sales strategy. The metrics highlighted in the slide are total number of sales, sales revenue in different months, cost breakdown, incremental sales, accumulated revenue etc. Presenting our well structured KPI Dashboard To Evaluate Competitive Sales Strategy Performance. The topics discussed in this slide are Number Of Sales, Revenue, Profit, Cost. This is an instantly available PowerPoint presentation that can be edited conveniently. Download it right away and captivate your audience.
-
 Cost Evaluation For Procurement Process KPI Dashboard
This slide covers cost evaluation dashboard for procurement process. It involves details such as cost of purchase order, reduction, average cost saving and avoidance. Presenting our well structured Cost Evaluation For Procurement Process KPI Dashboard. The topics discussed in this slide are Cost Reduction, Five Major Suppliers, Procurement ROI. This is an instantly available PowerPoint presentation that can be edited conveniently. Download it right away and captivate your audience.
-
 Suppliers Evaluation For Procurement KPI Dashboard
This slide covers dashboard of suppliers evaluation for procurement process. It involves details such as major suppliers by partner status, rate of contract compliance, average procurement cycle on daily basis. Introducing our Suppliers Evaluation For Procurement KPI Dashboard set of slides. The topics discussed in these slides are Suppliers, Contracted, Order Placement, Total Spending. This is an immediately available PowerPoint presentation that can be conveniently customized. Download it and convince your audience.
-
 Tracking Customer Data Insights Dashboard Implementing Augmented Intelligence
This slide provides information regarding customer data insights dashboard in terms of average churn risk, segments, high earner, highly engaged customers, etc. Deliver an outstanding presentation on the topic using this Tracking Customer Data Insights Dashboard Implementing Augmented Intelligence. Dispense information and present a thorough explanation of Tracking, Customer Data, Insights Dashboard using the slides given. This template can be altered and personalized to fit your needs. It is also available for immediate download. So grab it now.
-
 Tracking Essential Virtual Agents Activities Dashboard Implementing Augmented Intelligence
This slide provides information regarding virtual agents essential activities dashboard in terms of daily number of new conversation, unique users weekly conversations by channel, etc. Present the topic in a bit more detail with this Tracking Essential Virtual Agents Activities Dashboard Implementing Augmented Intelligence. Use it as a tool for discussion and navigation on Tracking Essential, Virtual Agents, Activities Dashboard. This template is free to edit as deemed fit for your organization. Therefore download it now
-
 Content Marketing Dashboard Snapshot For Effective Tracking
Purpose of the following slide is to show key metrics that can help the organization to track their content marketing efforts, these metrics are ad cost, visits, cost per click etc. Present the topic in a bit more detail with this Content Marketing Dashboard Snapshot For Effective Tracking. Use it as a tool for discussion and navigation on Gauge Widget, Effective Tracking, Marketing Dashboard. This template is free to edit as deemed fit for your organization. Therefore download it now.
-
 Dashboard Snapshot For Inbound Marketing Efforts
The following slide displays key metrics that can help the organization to measure effectiveness of inbound marketing strategy, these can be cost per conversion, clicks, impressions, etc. Deliver an outstanding presentation on the topic using this Dashboard Snapshot For Inbound Marketing Efforts. Dispense information and present a thorough explanation of Conversions, Cost Per Conversion, Thousand Impression using the slides given. This template can be altered and personalized to fit your needs. It is also available for immediate download. So grab it now.
-
 PPC Campaign Performance Measuring Dashboard
Mentioned slide displays KPI dashboard that can be used to track the performance of PPC campaign. Metrics covered are AD cost, clicks, impressions, CTR and cost per conversion. Present the topic in a bit more detail with this PPC Campaign Performance Measuring Dashboard. Use it as a tool for discussion and navigation on Conversion Rate, Thousand Impression, Click Though Rate. This template is free to edit as deemed fit for your organization. Therefore download it now.


