Powerpoint Templates and Google slides for Dash
Save Your Time and attract your audience with our fully editable PPT Templates and Slides.
-
 Smart Devices Monitoring And Tracking Dashboard Elevating Living Spaces With Smart
This slide represents the dashboard to track the performance of the smart home. The purpose of this slide is to showcase the implementation of smart home, including monitoring, security and privacy, connectivity, productivity, and so on. Present the topic in a bit more detail with this Smart Devices Monitoring And Tracking Dashboard Elevating Living Spaces With Smart. Use it as a tool for discussion and navigation on Monitoring, Security And Privacy, Smart Devices Monitoring, Tracking Dashboard. This template is free to edit as deemed fit for your organization. Therefore download it now.
-
 Data Breach Response Plan Security Breach Events Tracking Dashboard
This slide represents the dashboard to track data breach attacks. The purpose of this slide is to provide a graphical representation of cyber attacks that occurred in a specific period. It also depicts the overview of different types of attacks. Present the topic in a bit more detail with this Data Breach Response Plan Security Breach Events Tracking Dashboard. Use it as a tool for discussion and navigation on Security Breach Events, Tracking Dashboard, Track Data Breach Attacks, Inspection Of Network. This template is free to edit as deemed fit for your organization. Therefore download it now.
-
 Implementing Big Data Analytics Effective Supplier Performance Assessment Dashboard CRP DK SS
This slide showcases dashboard for analyzing supplier performance with KPIs such as defect rate, on time supplies, average procurement cycle, delivery time etc. Deliver an outstanding presentation on the topic using this Implementing Big Data Analytics Effective Supplier Performance Assessment Dashboard CRP DK SS. Dispense information and present a thorough explanation of Analyzing Supplier Performance, Average Procurement Cycle, Assessment Dashboard using the slides given. This template can be altered and personalized to fit your needs. It is also available for immediate download. So grab it now.
-
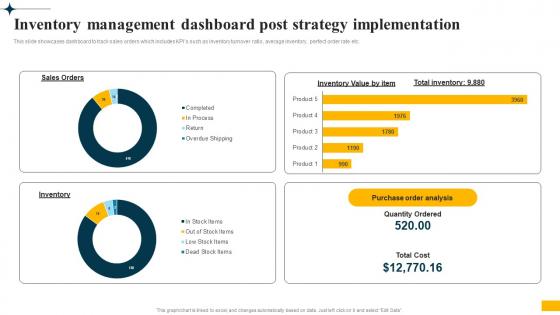 Implementing Big Data Analytics Inventory Management Dashboard Post Strategy Implementation CRP DK SS
This slide showcases dashboard to track sales orders which includes KPIs such as inventory turnover ratio, average inventory, perfect order rate etc. Deliver an outstanding presentation on the topic using this Implementing Big Data Analytics Inventory Management Dashboard Post Strategy Implementation CRP DK SS. Dispense information and present a thorough explanation of Inventory Management Dashboard, Post Strategy Implementation, Dashboard To Track Sales using the slides given. This template can be altered and personalized to fit your needs. It is also available for immediate download. So grab it now.
-
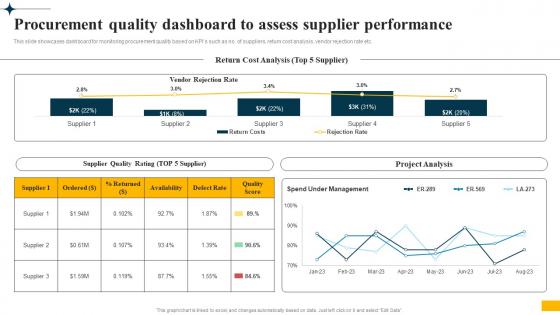 Implementing Big Data Analytics Procurement Quality Dashboard To Assess Supplier Performance CRP DK SS
This slide showcases dashboard for monitoring procurement quality based on KPIs such as no. of suppliers, return cost analysis, vendor rejection rate etc. Present the topic in a bit more detail with this Implementing Big Data Analytics Procurement Quality Dashboard To Assess Supplier Performance CRP DK SS. Use it as a tool for discussion and navigation on Procurement Quality Dashboard, Assess Supplier Performance, Vendor Rejection Rate. This template is free to edit as deemed fit for your organization. Therefore download it now.
-
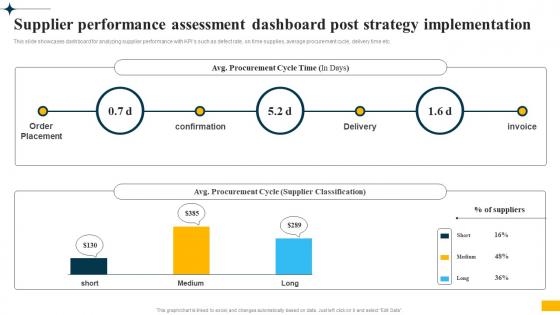 Implementing Big Data Analytics Supplier Performance Assessment Dashboard Post Strategy CRP DK SS
This slide showcases dashboard for analyzing supplier performance with KPIs such as defect rate, on time supplies, average procurement cycle, delivery time etc. Deliver an outstanding presentation on the topic using this Implementing Big Data Analytics Supplier Performance Assessment Dashboard Post Strategy CRP DK SS. Dispense information and present a thorough explanation of Supplier Performance Assessment, Dashboard Post, Strategy Implementation, Average Procurement Cycle using the slides given. This template can be altered and personalized to fit your needs. It is also available for immediate download. So grab it now.
-
 Dashboard For Tracking Lead Advanced Lead Generation Tactics Strategy SS V
This slide covers the KPI dashboard for analyzing metrics such as cost per lead, cost per conversion, average time conversion, conversion rate, monthly new leads, and qualified leads per month. Deliver an outstanding presentation on the topic using this Dashboard For Tracking Lead Advanced Lead Generation Tactics Strategy SS V. Dispense information and present a thorough explanation of Conversion, Average, Conversion using the slides given. This template can be altered and personalized to fit your needs. It is also available for immediate download. So grab it now.
-
 Dashboard For Tracking Leads Generated Advanced Lead Generation Tactics Strategy SS V
This slide covers the KPI dashboard for tracking metrics such as leads, ACV wins, customer acquisition cost, click through rate, and cost per conversion. It also includes leads per various campaigns such as social media, paid marketing, email marketing, etc. Present the topic in a bit more detail with this Dashboard For Tracking Leads Generated Advanced Lead Generation Tactics Strategy SS V. Use it as a tool for discussion and navigation on Conversion, Cost, Acquisition. This template is free to edit as deemed fit for your organization. Therefore download it now.
-
 Dashboard For Tracking Sessions And Advanced Lead Generation Tactics Strategy SS V
This slide covers the KPI dashboard for analyzing metrics such as offline sources, direct traffic, organic search, email marketing, paid search, referral, social media, email open, etc. Deliver an outstanding presentation on the topic using this Dashboard For Tracking Sessions And Advanced Lead Generation Tactics Strategy SS V. Dispense information and present a thorough explanation of Source, Generation, Tracking using the slides given. This template can be altered and personalized to fit your needs. It is also available for immediate download. So grab it now.
-
 Sase Model Secure Access Service Edge Performance Tracking Dashboard
This slide demonstrates the performance tracking dashboard for secure access service edge. The purpose of this slide is to showcase the overall performance of the SASE model, including connections, critical network alarms, critical security alerts, application volume, risky applications, and unblocked security threats. Present the topic in a bit more detail with this Sase Model Secure Access Service Edge Performance Tracking Dashboard. Use it as a tool for discussion and navigation on Critical Network Alarms, Risky Applications. This template is free to edit as deemed fit for your organization. Therefore download it now.
-
 Dashboard Monitor Performance Sustainable Marketing Principles To Improve Lead Generation MKT SS V
This slide covers dashboard to evaluate the performance of campaigns launched under sustainable marketing. It includes elements such as on leads breakdown, collection of leads under campaigns, Google analytics and web traffic conversion rates, top social media channels under sustainable marketing. Present the topic in a bit more detail with this Dashboard Monitor Performance Sustainable Marketing Principles To Improve Lead Generation MKT SS V. Use it as a tool for discussion and navigation on Key Conversion Metric, Lead Breakdown, Social Media Channels. This template is free to edit as deemed fit for your organization. Therefore download it now.
-
 Dashboard To Track Funds Raised Sustainable Marketing Principles To Improve Lead Generation MKT SS V
This slide covers dashboard to track the fund raised under sense of mission marketing campaign. The purpose of this template is to provide an overview of donations received for a cause from general public, corporate houses through channels such as online, phone, events,etc. Deliver an outstanding presentation on the topic using this Dashboard To Track Funds Raised Sustainable Marketing Principles To Improve Lead Generation MKT SS V. Dispense information and present a thorough explanation of Cumulative, Raised Each Month, Corporate using the slides given. This template can be altered and personalized to fit your needs. It is also available for immediate download. So grab it now.
-
 KPI Dashboard Highlighting Leveraging Integrated Marketing Communication Tools MKT SS V
The following slide depicts key performance indicators to evaluate public relations efforts and increase brand visibility. It includes elements such as press releases, blog entries, social media updates, news releases etc. Deliver an outstanding presentation on the topic using this . Dispense information and present a thorough explanation of Blog Entries Posted, Press Releases Syndicated, Total News Releases using the slides given. This template can be altered and personalized to fit your needs. It is also available for immediate download. So grab it now.
-
 KPI Dashboard To Analyze Personal Leveraging Integrated Marketing Communication Tools MKT SS V
The following slide highlights personal selling efforts of region wise sales representatives to attract new and retain previous customers. It includes elements such as total team sales, weekly, monthly and annual individual outcomes etc. Increase audience engagement and knowledge by dispensing information using KPI Dashboard To Analyze Personal Leveraging Integrated Marketing Communication Tools MKT SS V. This template helps you present information on four stages. You can also present information on Team Sales, Leaderboard This Year, Monthly Sales using this PPT design. This layout is completely editable so personaize it now to meet your audiences expectations.
-
 KPI Dashboard To Review Leveraging Integrated Marketing Communication Tools MKT SS V
The following slide depicts key performance indicators to evaluate effectiveness of campaign performance. It includes elements such as total revenue, marketing spend, leads, cost per acquisition, profits, return on investments etc. Present the topic in a bit more detail with this KPI Dashboard To Review Leveraging Integrated Marketing Communication Tools MKT SS V. Use it as a tool for discussion and navigation on Total Revenue, Marketing Spend, Cost Per Acquisition. This template is free to edit as deemed fit for your organization. Therefore download it now.
-
 Dashboard Depicting Production In Global Food Market Farm Services Marketing Strategy SS V
This slide provides an overview of the dashboard that exhibits the situation of the global food market. It includes production, import, exports information for wheat, maize, rice and soybean. Deliver an outstanding presentation on the topic using this Dashboard Depicting Production In Global Food Market Farm Services Marketing Strategy SS V. Dispense information and present a thorough explanation of Dashboard Depicting Production, Global Food Market using the slides given. This template can be altered and personalized to fit your needs. It is also available for immediate download. So grab it now.
-
 Farm Management Dashboard Depicting Production Farm Services Marketing Strategy SS V
This slide showcases the dashboard depicting data related to the production of fruits. The dashboard includes area, last production, air temperature, water content, pH value and financial statistics. Present the topic in a bit more detail with this Farm Management Dashboard Depicting Production Farm Services Marketing Strategy SS V. Use it as a tool for discussion and navigation on Financial Statistics, Production Details. This template is free to edit as deemed fit for your organization. Therefore download it now.
-
 Healthcare Marketing Digital Marketing Dashboard To Evaluate Healthcare Strategy SS V
The following slide outlines performance KPI dashboard through which healthcare brands can evaluate online marketing campaign performance on business. The metrics mentioned in slide are Google ads, Facebook ads, Instagram ads, conversions, sessions, cost per click CPC, etc. Deliver an outstanding presentation on the topic using this Healthcare Marketing Digital Marketing Dashboard To Evaluate Healthcare Strategy SS V Dispense information and present a thorough explanation of Google Ads, Facebook, Instagram using the slides given. This template can be altered and personalized to fit your needs. It is also available for immediate download. So grab it now.
-
 Healthcare Marketing Healthcare Marketing Dashboard To Measure Patient Satisfaction Strategy SS V
The following slide outlines comprehensive dashboard through which medical care companies can evaluate patient experience and make more informed decisions. The metrics outlined in slide are lab test, patient falls, average waiting time, etc. Present the topic in a bit more detail with this Healthcare Marketing Healthcare Marketing Dashboard To Measure Patient Satisfaction Strategy SS V Use it as a tool for discussion and navigation on Lab Test Turnaround, Average Waiting Times, Patient Satisfaction This template is free to edit as deemed fit for your organization. Therefore download it now.
-
 Healthcare Marketing Hospital Kpi Dashboard With Average Waiting Time Strategy SS V
The following slide outlines key performance indicator KPI dashboard that can be used by healthcare professionals to evaluate hospital performance. The metrics outlined in slide are total patients, average treatment costs, available staff, patients by division, etc. Deliver an outstanding presentation on the topic using this Healthcare Marketing Hospital Kpi Dashboard With Average Waiting Time Strategy SS V Dispense information and present a thorough explanation of Patient By Division, Waiting Time By Division, Inpatients Trend using the slides given. This template can be altered and personalized to fit your needs. It is also available for immediate download. So grab it now.
-
 Digital Marketing Dashboard To Evaluate Strategic Plan To Promote Strategy SS V
The following slide outlines performance KPI dashboard through which healthcare brands can evaluate online marketing campaign performance on business. The metrics mentioned in slide are Google ads, Facebook ads, Instagram ads, conversions, sessions, cost per click CPC, etc. Present the topic in a bit more detail with this Digital Marketing Dashboard To Evaluate Strategic Plan To Promote Strategy SS V. Use it as a tool for discussion and navigation on Healthcare, Company, Performance. This template is free to edit as deemed fit for your organization. Therefore download it now.
-
 Healthcare Marketing Dashboard To Measure Strategic Plan To Promote Strategy SS V
The following slide outlines comprehensive dashboard through which medical care companies can evaluate patient experience and make more informed decisions. The metrics outlined in slide are lab test, patient falls, average waiting time, etc. Present the topic in a bit more detail with this Healthcare Marketing Dashboard To Measure Strategic Plan To Promote Strategy SS V. Use it as a tool for discussion and navigation on Average, Satisfaction, Measure. This template is free to edit as deemed fit for your organization. Therefore download it now.
-
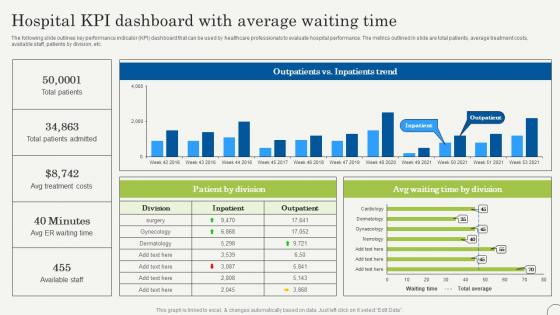 Hospital KPI Dashboard With Average Waiting Time Strategic Plan To Promote Strategy SS V
The following slide outlines key performance indicator KPI dashboard that can be used by healthcare professionals to evaluate hospital performance. The metrics outlined in slide are total patients, average treatment costs, available staff, patients by division, etc. Deliver an outstanding presentation on the topic using this Hospital KPI Dashboard With Average Waiting Time Strategic Plan To Promote Strategy SS V. Dispense information and present a thorough explanation of Treatment, Waiting, Available using the slides given. This template can be altered and personalized to fit your needs. It is also available for immediate download. So grab it now.
-
 Dashboard To Evaluate Targeted Social Database Marketing Practices To Increase MKT SS V
The purpose of this slide is to outline a comprehensive dashboard through which marketers can analyze effectiveness of targeted social media campaign performance. The key performance indicators KPIs are social media followers, LinkedIn key metrics, page likes, page impressions, etc. Deliver an outstanding presentation on the topic using this Dashboard To Evaluate Targeted Social Database Marketing Practices To Increase MKT SS V. Dispense information and present a thorough explanation of Impressions, Subscribers, Targeted using the slides given. This template can be altered and personalized to fit your needs. It is also available for immediate download. So grab it now.
-
 KPI Dashboard To Analyze Overall Database Marketing Practices To Increase MKT SS V
The purpose of this slide is to highlight dashboard through which marketers can evaluate success of targeted marketing strategies on company performance. It covers major metrics such as branded search, customer value, advertising budget, website conversion rate, etc. Deliver an outstanding presentation on the topic using this KPI Dashboard To Analyze Overall Database Marketing Practices To Increase MKT SS V. Dispense information and present a thorough explanation of Advertising, Utilization, Performance using the slides given. This template can be altered and personalized to fit your needs. It is also available for immediate download. So grab it now.
-
 KPI Dashboard To Analyze Targeted Database Marketing Practices To Increase MKT SS V
The purpose of this slide is to highlight key performance indicator KPI dashboard which can be used by marketers to evaluate targeted email marketing campaign performance. The metrics are requests, opens, clicks, opens by country, opens vs clicks by month, etc. Present the topic in a bit more detail with this KPI Dashboard To Analyze Targeted Database Marketing Practices To Increase MKT SS V. Use it as a tool for discussion and navigation on Requests, Percentage, Reports. This template is free to edit as deemed fit for your organization. Therefore download it now.
-
 Beverage Distribution Market Statistical Dashboard
This slide showcases beverage distribution industry statistical dashboard which helps managers to offer consumers a vast selection of products at competitive prices. It includes pointers such as market drivers, product type, distribution channels and opportunities. Presenting our well structured Beverage Distribution Market Statistical Dashboard. The topics discussed in this slide are Opportunities, Market, Revenue. This is an instantly available PowerPoint presentation that can be edited conveniently. Download it right away and captivate your audience.
-
 Procure To Pay Procurement Analysis Dashboard
This slide showcases P2P procurement analysis dashboard which helps in highlighting inefficiencies and speeding up decision making. It includes elements such as total invoice, discount savings, country, region, discount percent and analysis. Introducing our Procure To Pay Procurement Analysis Dashboard set of slides. The topics discussed in these slides are Invoice, Discount, Savings. This is an immediately available PowerPoint presentation that can be conveniently customized. Download it and convince your audience.
-
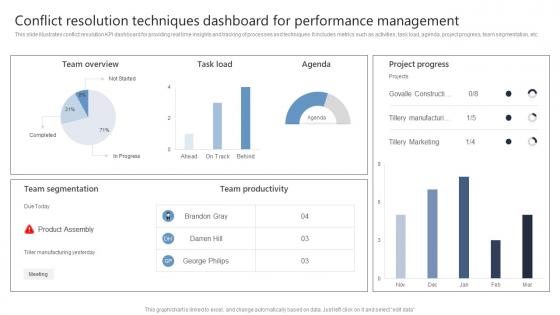 Conflict Resolution Techniques Dashboard For Performance Management
This slide illustrates conflict resolution KPI dashboard for providing real time insights and tracking of processes and techniques. It includes metrics such as activities, task load, agenda, project progress, team segmentation, etc. Introducing our Conflict Resolution Techniques Dashboard For Performance Management set of slides. The topics discussed in these slides are Team Overview, Task Load, Agenda. This is an immediately available PowerPoint presentation that can be conveniently customized. Download it and convince your audience.
-
 Financial Dashboard Tracking Cashflow Through IoT
This slide highlights dashboard for assessing financial transactions through IOT. The main purpose of this template is to monitor cash in-flow and out-flow. This includes total amount, amount paid, equity finance, etc. Introducing our Financial Dashboard Tracking Cashflow Through IoT set of slides. The topics discussed in these slides are Profit And Loss Summary. This is an immediately available PowerPoint presentation that can be conveniently customized. Download it and convince your audience.
-
 IoT In Finance Dashboard For Tracking Assets
This slide showcases real-time status of assets in finance. The main purpose of this template is to highlight outstanding amounts and flow cash in one year. This includes liquid ratio, circulation capital ratio, outstanding sales,etc. Presenting our well structured IoT In Finance Dashboard For Tracking Assets. The topics discussed in this slide are Cash Turnover, Operational Capital. This is an instantly available PowerPoint presentation that can be edited conveniently. Download it right away and captivate your audience.
-
 Tracking Performance Administration Software Dashboard
This slide showcases the dashboard for measuring management performance on software. Its purpose is to understand the employees performance based on various factors. It includes average age, gender ratio, employee count, etc. Presenting our well structured Tracking Performance Administration Software Dashboard. The topics discussed in this slide are Tracking Performance Administration, Software Dashboard. This is an instantly available PowerPoint presentation that can be edited conveniently. Download it right away and captivate your audience.
-
 Real Estate Management KPI Dashboard
This slide represents KPI dashboard for real estate business. The purpose of this slide is to track activities to showcase comprehensive overview of data. It includes various KPIs such as total properties for sale, total sales, total properties for rent, average days on market etc. Introducing our Real Estate Management KPI Dashboard set of slides. The topics discussed in these slides are Real Estate Management. This is an immediately available PowerPoint presentation that can be conveniently customized. Download it and convince your audience.
-
 Multi Channel Marketing Dashboard For Maximizing Sales
This slide illustrates sales channel KPIdashboard and includes metrics such as achievements, visits, unique users, selections, views, etc. Introducing our Multi Channel Marketing Dashboard For Maximizing Sales set of slides. The topics discussed in these slides are Multi Channel Marketing Dashboard, Maximizing Sales. This is an immediately available PowerPoint presentation that can be conveniently customized. Download it and convince your audience.
-
 Sales Performance Dashboard For Managing Indirect Channels
This slide illustrates sales channel KPI dashboard and includes metrics such as sales trends, categorize sales by countries and products, etc. Introducing our Sales Performance Dashboard For Managing Indirect Channels set of slides. The topics discussed in these slides are Sales Performance Dashboard, Managing Indirect Channels. This is an immediately available PowerPoint presentation that can be conveniently customized. Download it and convince your audience.
-
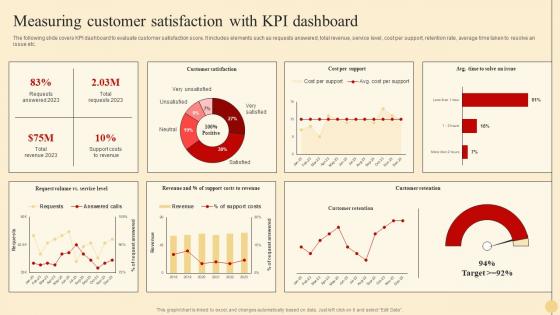 Measuring Customer Kpi Dashboard Strategic Approach To Optimize Customer Support Services
The following slide covers KPI dashboard to evaluate customer satisfaction score. It includes elements such as requests answered, total revenue, service level, cost per support, retention rate, average time taken to resolve an issue etc. Deliver an outstanding presentation on the topic using this Measuring Customer Kpi Dashboard Strategic Approach To Optimize Customer Support Services. Dispense information and present a thorough explanation of Measuring, Satisfaction, Dashboard using the slides given. This template can be altered and personalized to fit your needs. It is also available for immediate download. So grab it now.
-
 Smart Automation System In Agriculture Dashboard
This slide showcase dashboard of smart automation system in agriculture which improve productivity and enables greater number of resources through remote sensing. It includes pointers such as humidity, moisture, temperature, soil health, whether forecast and moisture data. Presenting our well structured Smart Automation System In Agriculture Dashboard. The topics discussed in this slide are Humidity, Moisture. This is an instantly available PowerPoint presentation that can be edited conveniently. Download it right away and captivate your audience.
-
 Market Penetration For Business Dashboard Representing Actual Market Share Strategy SS V
This slide provides an overview of the dashboard depicting the market share of the company. It also includes brand sales, pricing analysis, market share trend line, etc. Present the topic in a bit more detail with this Market Penetration For Business Dashboard Representing Actual Market Share Strategy SS V. Use it as a tool for discussion and navigation on Market Share Trend, Brand Sales By Region. This template is free to edit as deemed fit for your organization. Therefore download it now.
-
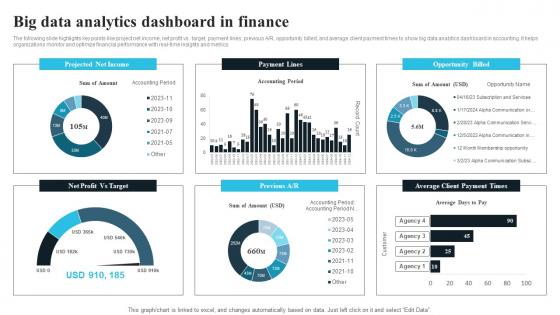 Big Data Analytics Dashboard In Finance
The following slide highlights key points like project net income, net profit vs. target, payment lines, previous AR, opportunity billed, and average client payment times to show big data analytics dashboard in accounting. It helps organizations monitor and optimize financial performance with real-time insights and metrics. Introducing our Big Data Analytics Dashboard In Finance set of slides. The topics discussed in these slides are Projected Net Income, Opportunity Billed. This is an immediately available PowerPoint presentation that can be conveniently customized. Download it and convince your audience.
-
 Consumer Purchasing Behaviour Research Dashboard
This slide depicts monthly research dashboard to analyze consumer behavior towards product. The purpose of this slide is to determine consumer decision towards selecting different products. It includes monthly device users, top 5 rated products, top search products and session per user. Introducing our Consumer Purchasing Behaviour Research Dashboard set of slides. The topics discussed in these slides are Monthly Device Users, Session Per User. This is an immediately available PowerPoint presentation that can be conveniently customized. Download it and convince your audience.
-
 Dashboard To Track Online Sales Performance Implementing Marketing Strategies
Following slide exhibits dashboard that help organizations to measure performance of online sales. It include parameters such as number of new customers, sales revenue, profit, sales growth rate, customer acquisition cost etc Deliver an outstanding presentation on the topic using this Dashboard To Track Online Sales Performance Implementing Marketing Strategies. Dispense information and present a thorough explanation of Revenue, Average, Performance using the slides given. This template can be altered and personalized to fit your needs. It is also available for immediate download. So grab it now.
-
 KPI Dashboard To Measure Online Website Implementing Marketing Strategies
Following slide exhibits dashboard to track and measure performance of online shopping website of company. It include indicators such as sales, gross profit, conversion rates, site traffic, number of shares and transactions etc. Present the topic in a bit more detail with this KPI Dashboard To Measure Online Website Implementing Marketing Strategies. Use it as a tool for discussion and navigation on Transactions, Conversion, Performance. This template is free to edit as deemed fit for your organization. Therefore download it now.
-
 Cyber Attack Incident Tracking Dashboard Cyber Risk Assessment
The following slide depicts the number of cyber-attacks incurred during year end to monitor security trends. It includes elements such as prevented, allowed attacks, additional threats detected, number of infected hosts and malicious files etc. Present the topic in a bit more detail with this Cyber Attack Incident Tracking Dashboard Cyber Risk Assessment Use it as a tool for discussion and navigation on Cyber Attack Incident, Tracking Dashboard This template is free to edit as deemed fit for your organization. Therefore download it now.
-
 Data Breach Trend Analysis With KPI Dashboard Cyber Risk Assessment
The following slide depicts the data breach trends to minimize information leakage and patch affected system. It includes elements such as breach risk trend, breach by risk category, current and future goal analysis etc. Present the topic in a bit more detail with this Data Breach Trend Analysis With KPI Dashboard Cyber Risk Assessment Use it as a tool for discussion and navigation on Breach Risk, Business Unit, Risk Category This template is free to edit as deemed fit for your organization. Therefore download it now.
-
 Information Technology Expenditure Summary Dashboard Cyber Risk Assessment
The following slide showcases the cyber security expense overview to better allocate budget. It includes elements such as IT cost, revenue, security incidents, services down, issue status summary, total business hours lost etc. Deliver an outstanding presentation on the topic using this Information Technology Expenditure Summary Dashboard Cyber Risk Assessment Dispense information and present a thorough explanation of Security Incidents, Costs And Revenue, Issue Status Summary using the slides given. This template can be altered and personalized to fit your needs. It is also available for immediate download. So grab it now.
-
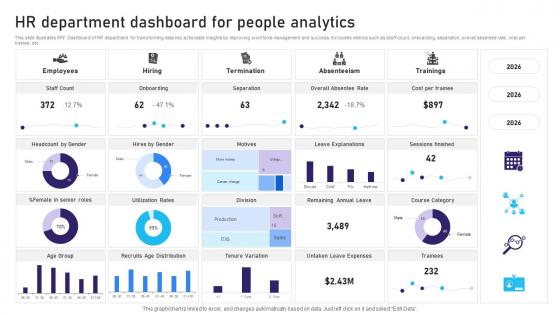 HR Department Dashboard For People Analytics
This slide illustrates KPI Dashboard of HR department for transforming data into actionable insights by improving workforce management and success. It includes metrics such as staff count, onboarding, separation, overall absentee rate, cost per trainee, etc. Introducing our HR Department Dashboard For People Analytics set of slides. The topics discussed in these slides are Employees, Hiring, Termination. This is an immediately available PowerPoint presentation that can be conveniently customized. Download it and convince your audience.
-
 Talent Acquisition Dashboard By HR Department
This slide demonstrates HR department KPIdashboard for enhancing efficiency of talent acquisition efforts. It includes metrics such as time to hire, time to fill position, offer acceptance rate, candidate withdrawal rate, total hiring expenditures, etc. Presenting our well structured Talent Acquisition Dashboard By HR Department. The topics discussed in this slide are Hiring Expenditures, Hiring Platforms. This is an instantly available PowerPoint presentation that can be edited conveniently. Download it right away and captivate your audience.
-
 Laboratory Management Dashboard For Real Time Experiments Monitoring
This slide illustrates KPI dashboard for laboratory management by enhancing overall productivity, compliance operations to access relevant information. It includes metrics such as collected, executed, approved, sample collected, sample executed, sample approved, etc. Presenting our well structured Laboratory Management Dashboard For Real Time Experiments Monitoring. The topics discussed in this slide are Collected, Executed, Approved. This is an instantly available PowerPoint presentation that can be edited conveniently. Download it right away and captivate your audience.
-
 Online Clothing Business Dashboard For Real Time Monitoring
This slide illustrates KPI dashboard of online clothing business for providing visual, centralized overview of critical data and performance metrics. It includes metrics such as divisional production, output and performance optimization, quality assessment report, etc. Introducing our Online Clothing Business Dashboard For Real Time Monitoring set of slides. The topics discussed in these slides are Divisional Production, Design Specific Production. This is an immediately available PowerPoint presentation that can be conveniently customized. Download it and convince your audience.
-
 Production Volume Manufacturing KPIs Dashboard
This slide showcases the manufacturing KPI dashboard. Its purpose is to help understand the effectiveness, performance of the production. This slide includes performance, revenue, cost, etc. Introducing our Production Volume Manufacturing KPIs Dashboard set of slides. The topics discussed in these slides are Effective, Performance. This is an immediately available PowerPoint presentation that can be conveniently customized. Download it and convince your audience.
-
 Dashboard To Track Retail Store Performance Post Automation
This slide highlights the dashboard for tracking the performance of a retail automation dashboard. The purpose of this slide is to help monitor business performance through elements such as revenue generated, retail clients, etc. Presenting our well structured Dashboard To Track Retail Store Performance Post Automation. The topics discussed in this slide are Revenue Generated, Retail Clients, Annual Customers. This is an instantly available PowerPoint presentation that can be edited conveniently. Download it right away and captivate your audience.
-
 Customer Journey Optimization Dashboard Illustrating Customer Engagement Performance Metric
This slide presents a framework model that outlines the customer journey and strategy to effectively engage audience. It includes aspects such as stages, goals, responses, metrics and opportunities. Deliver an outstanding presentation on the topic using this Customer Journey Optimization Dashboard Illustrating Customer Engagement Performance Metric Dispense information and present a thorough explanation of Pricing,Service,Quality using the slides given. This template can be altered and personalized to fit your needs. It is also available for immediate download. So grab it now.
-
 Customer Journey Optimization Dashboard To Track Customer Loyalty Program Performance
This slide showcases a dashboard highlighting the customer engagement through social sites. It includes KPIs such as total website traffics, site revenue, fans count and followers. Present the topic in a bit more detail with this Customer Journey Optimization Dashboard To Track Customer Loyalty Program Performance Use it as a tool for discussion and navigation on Customers,Customer Feedback,Returning Customers This template is free to edit as deemed fit for your organization. Therefore download it now.
-
 Customer Journey Optimization Social Media Engagement Tracking Dashboard
This slide presents the analysis of survey results on the kind of consumer engagement anticipated from the company on various social platforms. It includes survey results, key findings. Present the topic in a bit more detail with this Customer Journey Optimization Social Media Engagement Tracking Dashboard Use it as a tool for discussion and navigation on Fans Count,Website Traffic,Site Revenue This template is free to edit as deemed fit for your organization. Therefore download it now.
-
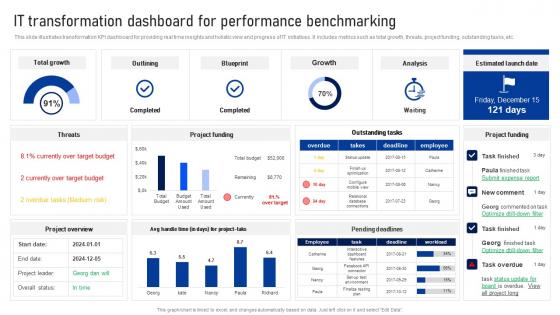 IT Transformation Dashboard For Performance Benchmarking
This slide illustrates transformation KPI dashboard for providing real time insights and holistic view and progress of IT initiatives. It includes metrics such as total growth, threats, project funding, outstanding tasks, etc. Introducing our IT Transformation Dashboard For Performance Benchmarking set of slides. The topics discussed in these slides are Target, Budget, Performance. This is an immediately available PowerPoint presentation that can be conveniently customized. Download it and convince your audience.
-
 Marketing Outreach Dashboard For Ensuring Data Centralization
This slide illustrates KPI dashboard for allowing real time monitoring, analysis and decision making related to marketing outreach efforts. It includes metrics such as conversion rate, prospects, fresh prospects, call categorization and top prospects. Presenting our well structured Marketing Outreach Dashboard For Ensuring Data Centralization. The topics discussed in this slide are Dashboard, Ensuring, Data. This is an instantly available PowerPoint presentation that can be edited conveniently. Download it right away and captivate your audience.
-
 Navigating The Banking Industry Dashboard Showcasing Executive Financial Expenses Of Banks
This slide showcases different KPIs related to banking. This template focuses on giving executives a holistic overview of enterprise and ts performance. It includes information related to expense trend, profits by branch, revenue, etc. Deliver an outstanding presentation on the topic using this Navigating The Banking Industry Dashboard Showcasing Executive Financial Expenses Of Banks. Dispense information and present a thorough explanation of Dashboard, Executive Financial Expenses, Branches By Revenue using the slides given. This template can be altered and personalized to fit your needs. It is also available for immediate download. So grab it now.
-
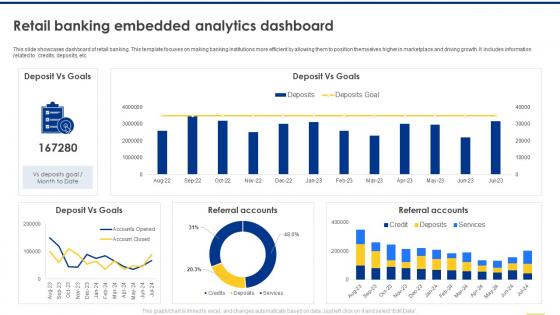 Navigating The Banking Industry Retail Banking Embedded Analytics Dashboard
This slide showcases dashboard of retail banking. This template focuses on making banking institutions more efficient by allowing them to position themselves higher in marketplace and driving growth. It includes information related to credits, deposits, etc. Present the topic in a bit more detail with this Navigating The Banking Industry Retail Banking Embedded Analytics Dashboard. Use it as a tool for discussion and navigation on Dashboard Of Retail Banking, Making Banking Institutions, Driving Growth, Analytics Dashboard. This template is free to edit as deemed fit for your organization. Therefore download it now.
-
 Infrastructure As Code Adoption Strategy Amazon Cloud Watch Monitoring Dashboard
This slide represents the security in Infrastructure as Code Amazon Cloud Watch dashboard. The purpose of this slide is to monitor the AWS with Amazon Cloud Watch such as service summary, defaults, recent alarms, customer metrics, etc. Present the topic in a bit more detail with this Infrastructure As Code Adoption Strategy Amazon Cloud Watch Monitoring Dashboard. Use it as a tool for discussion and navigation on Amazon Cloud Watch, Monitoring Dashboard, Security In Infrastructure, Customer Metrics. This template is free to edit as deemed fit for your organization. Therefore download it now.
-
 Infrastructure As Code Security Tracking Dashboard Infrastructure As Code Adoption Strategy
This slide represents the security in Infrastructure as Code tracking dashboard. The key components include container image, misconfigured workload, risk assets, failed codes by credentials, transit, valuable public interface, etc. Deliver an outstanding presentation on the topic using this Infrastructure As Code Security Tracking Dashboard Infrastructure As Code Adoption Strategy. Dispense information and present a thorough explanation of Security In Infrastructure, Code Tracking Dashboard, Misconfigured Workload, Risk Assets, Valuable Public Interface using the slides given. This template can be altered and personalized to fit your needs. It is also available for immediate download. So grab it now.


