Powerpoint Templates and Google slides for Dash
Save Your Time and attract your audience with our fully editable PPT Templates and Slides.
-
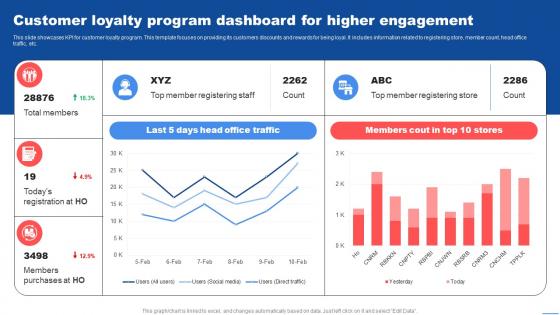 Customer Loyalty Program Dashboard Customer Marketing Strategies To Encourage
This slide showcases KPI for customer loyalty program. This template focuses on providing its customers discounts and rewards for being loyal. It includes information related to registering store, member count, head office traffic, etc.Deliver an outstanding presentation on the topic using this Customer Loyalty Program Dashboard Customer Marketing Strategies To Encourage. Dispense information and present a thorough explanation of Member Registering, Total Members, Member Registering using the slides given. This template can be altered and personalized to fit your needs. It is also available for immediate download. So grab it now.
-
 Influencer Social Media Marketing Dashboard Customer Marketing Strategies To Encourage
This slide showcases dashboard for social media company. This template focuses on tracking success of various influencer campaigns in form of revenue generated. It includes information related to website traffic, post performance, etc.Present the topic in a bit more detail with this Influencer Social Media Marketing Dashboard Customer Marketing Strategies To Encourage. Use it as a tool for discussion and navigation on Engagement Rate, Post Performance, Comments. This template is free to edit as deemed fit for your organization. Therefore download it now.
-
 Referral Marketing Program Metrics Dashboard Customer Marketing Strategies To Encourage
This slide showcases newsletter referral program dashboard. This template focuses on choosing right type of program for giving rewards in monetary non monetary form. It covers aspects related to revenue, number of site clicks, new customers, etc.Present the topic in a bit more detail with this Referral Marketing Program Metrics Dashboard Customer Marketing Strategies To Encourage. Use it as a tool for discussion and navigation on Pending Promoters, Pending Rewards, Monthly Recurring Revenue. This template is free to edit as deemed fit for your organization. Therefore download it now.
-
 Information Theory Cybernetics Implant Performance Tracking Dashboard
This slide shows the Cybernetics implant performance tracking dashboard. The purpose of this slide is to represent the Information related to the status of Cybernetics implant graphically. Deliver an outstanding presentation on the topic using this Information Theory Cybernetics Implant Performance Tracking Dashboard. Dispense information and present a thorough explanation of Cybernetics Implant Performance, Tracking Dashboard, Cybernetics Implant Graphically using the slides given. This template can be altered and personalized to fit your needs. It is also available for immediate download. So grab it now.
-
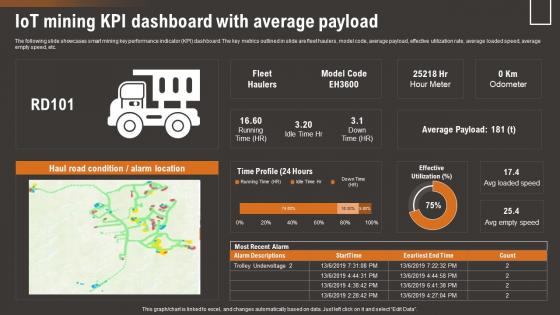 IoT Mining Kpi Dashboard With Average How IoT Technology Is Transforming IoT SS
The following slide showcases smart mining key performance indicator KPI dashboard. The key metrics outlined in slide are fleet haulers, model code, average payload, effective utilization rate, average loaded speed, average empty speed, etc.Present the topic in a bit more detail with this IoT Mining Kpi Dashboard With Average How IoT Technology Is Transforming IoT SS. Use it as a tool for discussion and navigation on Iot Mining Kpi Dashboard, Average Payload. This template is free to edit as deemed fit for your organization. Therefore download it now.
-
 Getting Products Promoted Referral Marketing Campaign Performance Tracking Dashboard
This slide covers the KPI dashboard for brands to evaluate the performance of referral marketing campaigns. It includes metrics such as referral participation rate, referred customers, referral conversion rate, total revenue generated, etc. Deliver an outstanding presentation on the topic using this Getting Products Promoted Referral Marketing Campaign Performance Tracking Dashboard Dispense information and present a thorough explanation of Referral Participation, Referral Customers, Referral Conversion Rate using the slides given. This template can be altered and personalized to fit your needs. It is also available for immediate download. So grab it now.
-
 Smart Grid Implementation Smart Home Dashboard For Appliance Monitoring
This slide represents the smart home dashboard for monitoring total electricity consumption by rooms and appliances such as lights, microwave heating, room cooling temperature, home security, television and computers. Present the topic in a bit more detail with this Smart Grid Implementation Smart Home Dashboard For Appliance Monitoring. Use it as a tool for discussion and navigation on Smart Home Dashboard, Appliance Monitoring, Room Cooling Temperature, Home Security. This template is free to edit as deemed fit for your organization. Therefore download it now.
-
 Digital Transformation In Wealth Management Insights Dashboard
This slide showcases insight insight giving dashboard of wealth management. The main purpose of this slide is giving an overview of finance and asset allocation. This includes liquid asset ratio, cash on hand, working capital ratio, etc.Presenting our well structured Digital Transformation In Wealth Management Insights Dashboard. The topics discussed in this slide are Liquid Asset Ratio, Outstanding Sales, Days Inventory Outstanding . This is an instantly available PowerPoint presentation that can be edited conveniently. Download it right away and captivate your audience.
-
 Digital Transformation In Wealth Management Tracking Dashboard
This slide showcases dashboard tracking wealth management. The main purpose of this template is managing management tasks efficiently. This includes task such as asset management, finance plans, corporate plans, and referral clients.Introducing our Digital Transformation In Wealth Management Tracking Dashboard set of slides. The topics discussed in these slides are Asset Management, Corporate Plan, Referral Client. This is an immediately available PowerPoint presentation that can be conveniently customized. Download it and convince your audience.
-
 E Commerce Dashboard For Business KPIs Overview
This slide shows an E commerce KPI dashboard. This template aims to highlight the important metrics that need to be monitored and tracked to ensure efficient E commerce management. It includes total sales, total products sold, total orders, average order value, CLV, refund amount, return customer care, etc.Introducing our E Commerce Dashboard For Business KPIs Overview set of slides. The topics discussed in these slides are Total Customers, Return Customer Rate, Refunded Amount. This is an immediately available PowerPoint presentation that can be conveniently customized. Download it and convince your audience.
-
 E Commerce KPI Dashboard For Facebook Ad Campaign
This slide shows an E commerce KPI dashboard for facebook campaign. This template aims to highlight the important metrics managed during the facebook ecommerce campaign. It includes facebook ads run, revenue, ads completed, cancellations,order, etc.Presenting our well structured E Commerce KPI Dashboard For Facebook Ad Campaign. The topics discussed in this slide are E Commerce Kpi Dashboard, Facebook Ad Campaign. This is an instantly available PowerPoint presentation that can be edited conveniently. Download it right away and captivate your audience.
-
 E Commerce KPI Dashboard For Past Month Sales
This slide shows an E commerce KPI dashboard. This template aims to highlight the important metrics that need to be monitored and tracked to ensure efficient E commerce management. It includes sales, client base, star products, cart reviews, customer overview, etcIntroducing our E Commerce KPI Dashboard For Past Month Sales set of slides. The topics discussed in these slides are Comparison Period, Month Date Base, Customer Overview. This is an immediately available PowerPoint presentation that can be conveniently customized. Download it and convince your audience.
-
 Performance Dashboard Tracking E Commerce KPIs
This slide shows an E commerce KPI dashboard. This template aims to highlight the important metrics that need to be monitored and tracked to ensure efficient E commerce management. It includes revenues, gross profit, lead conversion rate, site visits, order volume, etc.Introducing our Performance Dashboard Tracking E Commerce KPIs set of slides. The topics discussed in these slides are Average Session, Bounce Rate, Growth Rate. This is an immediately available PowerPoint presentation that can be conveniently customized. Download it and convince your audience.
-
 Supply Chain Management Dashboard To Measure Impact Of Supply Chain Management
This slide provides an overview of the dashboard depicting KPIs to measure supply chain impact. Major KPIs covered are cash-to-cash, inventory days of supply, supply chain costs, inventory turns and on time deliveries Present the topic in a bit more detail with this Supply Chain Management Dashboard To Measure Impact Of Supply Chain Management. Use it as a tool for discussion and navigation on Inventory, Deliveries, Annual. This template is free to edit as deemed fit for your organization. Therefore download it now.
-
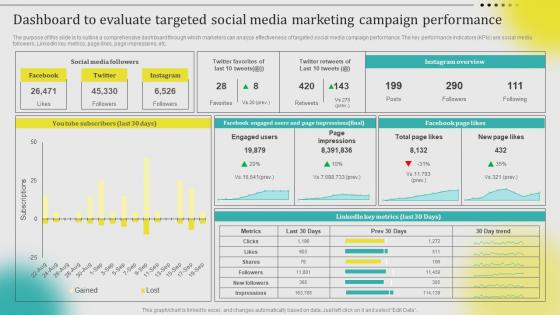 Dashboard To Evaluate Targeted Social Media Marketing Campaign Leveraging Customer Data MKT SS V
The purpose of this slide is to outline a comprehensive dashboard through which marketers can analyze effectiveness of targeted social media campaign performance. The key performance indicators KPIs are social media followers, LinkedIn key metrics, page likes, page impressions, etc. Present the topic in a bit more detail with this Dashboard To Evaluate Targeted Social Media Marketing Campaign Leveraging Customer Data MKT SS V. Use it as a tool for discussion and navigation on Instagram Overview, Facebook Page Likes. This template is free to edit as deemed fit for your organization. Therefore download it now.
-
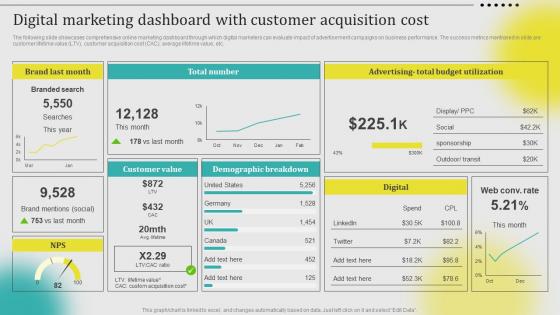 Digital Marketing Dashboard With Customer Acquisition Cost Leveraging Customer Data MKT SS V
The following slide showcases comprehensive online marketing dashboard through which digital marketers can evaluate impact of advertisement campaigns on business performance. The success metrics mentioned in slide are customer lifetime value LTV, customer acquisition cost CAC, average lifetime value, etc. Present the topic in a bit more detail with this Digital Marketing Dashboard With Customer Acquisition Cost Leveraging Customer Data MKT SS V. Use it as a tool for discussion and navigation on Customer Value, Demographic Breakdown. This template is free to edit as deemed fit for your organization. Therefore download it now.
-
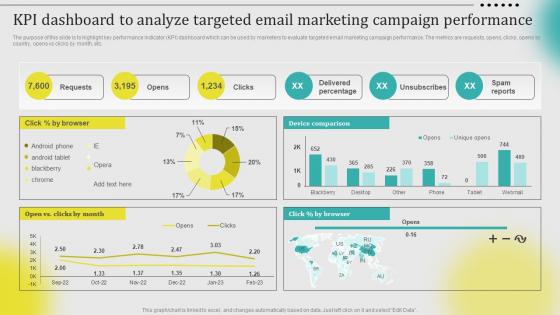 KPI Dashboard To Analyze Targeted Email Marketing Campaign Leveraging Customer Data MKT SS V
The purpose of this slide is to highlight key performance indicator KPI dashboard which can be used by marketers to evaluate targeted email marketing campaign performance. The metrics are requests, opens, clicks, opens by country, opens vs clicks by month, etc. Present the topic in a bit more detail with this KPI Dashboard To Analyze Targeted Email Marketing Campaign Leveraging Customer Data MKT SS V. Use it as a tool for discussion and navigation on Device Comparison, Browser. This template is free to edit as deemed fit for your organization. Therefore download it now.
-
 Analysis Dashboard For Incident Safety Management Process
This slide showcases the analytics dashboard for safety management to monitor and resolve hazardous incidents in organization. This includes various components like risk assessment, evacuation time, etc. Introducing our Analysis Dashboard For Incident Safety Management Process set of slides. The topics discussed in these slides are Days Since An Incident, Incidents This Year, Risk Assement This is an immediately available PowerPoint presentation that can be conveniently customized. Download it and convince your audience.
-
 Cloud Access Security Broker CASB V2 CASB Performance Tracking Dashboard
This slide outlines the performance tracking dashboard for CASB deployment. The purpose of this slide is to showcase the status of various applications, IP addresses, users, machines, and web traffic. It also includes cloud discovery open alerts, risk levels, and top entities. Deliver an outstanding presentation on the topic using this Cloud Access Security Broker CASB V2 CASB Performance Tracking Dashboard. Dispense information and present a thorough explanation of Performance Tracking Dashboard, Machines And Web Traffic, Cloud Discover Open Alerts using the slides given. This template can be altered and personalized to fit your needs. It is also available for immediate download. So grab it now.
-
 Warehouse Management Dashboard To Track Product Quantity Levels
The following slide represents the dashboard for warehouse management to provide information about the amount of stock the business holds at present. It also includes elements like inventory days of supply, inventory carrying cost, inventory turnover ratio etc. Presenting our well structured Warehouse Management Dashboard To Track Product Quantity Levels The topics discussed in this slide are Inventory Carrying Cost, Inventory Turnover Ratio, Inventory To Sales Ratio This is an instantly available PowerPoint presentation that can be edited conveniently. Download it right away and captivate your audience.
-
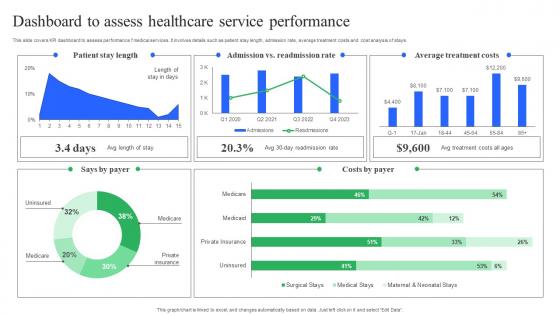 Dashboard To Assess Healthcare Service Performance Enhancing Medical Facilities
This slide covers KPI dashboard to assess performance f medical services. It involves details such as patient stay length, admission rate, average treatment costs and cost analysis of stays. Deliver an outstanding presentation on the topic using this Dashboard To Assess Healthcare Service Performance Enhancing Medical Facilities Dispense information and present a thorough explanation of Patient Stay Length, Average Treatment Costs, Readmission Rate using the slides given. This template can be altered and personalized to fit your needs. It is also available for immediate download. So grab it now.
-
 Lorawan Lorawan Network Monitoring Dashboard
This slide depicts a graphical representation for network performance of a LoRaWAN network. The dashboard shows the uploading and downloading speed of LoRaWAN, firewall events, intrusion events and much more. Present the topic in a bit more detail with this Lorawan Lorawan Network Monitoring Dashboard. Use it as a tool for discussion and navigation on Monitoring, Dashboard, Service. This template is free to edit as deemed fit for your organization. Therefore download it now.
-
 Lorawan Lorawan Network Performance Tracking Dashboard
This slide depicts a graphical representation of the performance of a LoRaWAN network. The dashboard shows the number of devices that are connected, vulnerability level of network and much more. Deliver an outstanding presentation on the topic using this Lorawan Lorawan Network Performance Tracking Dashboard. Dispense information and present a thorough explanation of Performance, Dashboard, Representation using the slides given. This template can be altered and personalized to fit your needs. It is also available for immediate download. So grab it now.
-
 Transnational Strategy Dashboard For Tracking Post Expansion Revenue By Product Type Strategy SS V
This slide covers the dashboard for analyzing fast food business sales by location. It includes KPIs such as the companys revenue by location, by type, top 5 expenses by account, top 5 expenses by department, cost of revenue year to date, etc. Deliver an outstanding presentation on the topic using this Transnational Strategy Dashboard For Tracking Post Expansion Revenue By Product Type Strategy SS V Dispense information and present a thorough explanation of Companys Revenue, Tracking Post Expansion, Product Type using the slides given. This template can be altered and personalized to fit your needs. It is also available for immediate download. So grab it now.
-
 Transnational Strategy Dashboard For Tracking Post Expansion Sales By Region Strategy SS V
This slide covers the dashboard for analyzing fast food business sales by region. It includes KPIs such as sales, sales target, target achievement, gross profit, gross profit margin, sales by channels, sales growth, etc. Present the topic in a bit more detail with this Transnational Strategy Dashboard For Tracking Post Expansion Sales By Region Strategy SS V Use it as a tool for discussion and navigation on Sales, Product, Actual Sales Vs Target This template is free to edit as deemed fit for your organization. Therefore download it now.
-
 Campaign Cost Analysis With KPI Dashboard Sustainable Supply Chain MKT SS V
The following slide showcases green marketing campaign costs assessment to evaluate overall expenses and allocate funds adequately for future. It includes elements such as conversions, clicks, click through rate CTR, Ad group, cost per conversion, expense by location etc. Present the topic in a bit more detail with this Campaign Cost Analysis With KPI Dashboard Sustainable Supply Chain MKT SS V Use it as a tool for discussion and navigation on Conversions By Ad Group, Expense By Location, Dashboard This template is free to edit as deemed fit for your organization. Therefore download it now.
-
 Evaluating Impact Of Green Marketing With KPI Dashboard Sustainable Supply Chain MKT SS V
The following slide depicts dashboard to evaluate consequences of sustainable marketing on sales performance and plan future actions. It includes key performance indicators such as orders, net profit margin, sales by location, channel, packaging costs, sales price etc. Deliver an outstanding presentation on the topic using this Evaluating Impact Of Green Marketing With KPI Dashboard Sustainable Supply Chain MKT SS V Dispense information and present a thorough explanation of Evaluating Impact, Green Marketing, Dashboard using the slides given. This template can be altered and personalized to fit your needs. It is also available for immediate download. So grab it now.
-
 KPI Dashboard To Evaluate Energy Consumption Sustainable Supply Chain MKT SS V
The following slide depicts dashboard to measure energy utilization during the year at workplace to gain operational efficiency and develop smart ways to save for future. It includes elements such as progress by segment, transport, waste management, packaging, warehousing etc. Present the topic in a bit more detail with this KPI Dashboard To Evaluate Energy Consumption Sustainable Supply Chain MKT SS V Use it as a tool for discussion and navigation on Kpi Dashboard, Evaluate Energy Consumption This template is free to edit as deemed fit for your organization. Therefore download it now.
-
 Operations Research Cybernetics Implant Performance Tracking Dashboard
This slide shows the Cybernetics implant performance tracking dashboard. The purpose of this slide is to represent the Information related to the status of Cybernetics implant graphically. Deliver an outstanding presentation on the topic using this Operations Research Cybernetics Implant Performance Tracking Dashboard. Dispense information and present a thorough explanation of Performance, Activity, Implant using the slides given. This template can be altered and personalized to fit your needs. It is also available for immediate download. So grab it now.
-
 Progressive Dashboard For Cloud And Digital Transformation
This slide represents KPI dashboard for cloud and digital transformation for optimizing internal resources and delivering value to customers. It includes metrics such as reflect, rephrase, convey, barriers count, etc. Presenting our well structured Progressive Dashboard For Cloud And Digital Transformation. The topics discussed in this slide are Adoption Rate Index, Challenges Suited.This is an instantly available PowerPoint presentation that can be edited conveniently. Download it right away and captivate your audience.
-
 Tracking Agricultural Automation Kpi Dashboard
This slide depicts metrics for farming transformation and provides details about various KPIs to track activity on field. It includes elements such as wind speed, rainfall indicator, etc. Presenting our well structured Tracking Agricultural Automation Kpi Dashboard. The topics discussed in this slide are Soil Moisture Level, Growing Degree Days.This is an instantly available PowerPoint presentation that can be edited conveniently. Download it right away and captivate your audience.
-
 Business Sales Forecasting Kpi Dashboard
This slide shows KPI dashboard to forecast sales of the business which measures and tracks revenue and deals earned monthly. It further includes details such as revenue this month, deals by month this year etc. Introducing our Business Sales Forecasting Kpi Dashboard set of slides. The topics discussed in these slides are Revenue Earned This Month, Revenue This Month. This is an immediately available PowerPoint presentation that can be conveniently customized. Download it and convince your audience.
-
 Kpi Dashboard To Monitor Security Compliance Risk
This slide shows security compliance checklists KPI dashboard to track and analyze risk related to security and to mitigate it efficiently. It further includes details such as top offenders, violation trends etc. Presenting our well structured Kpi Dashboard To Monitor Security Compliance Risk. The topics discussed in this slide are Violation Trends, Selected Period.This is an instantly available PowerPoint presentation that can be edited conveniently. Download it right away and captivate your audience.
-
 KPI Dashboard For Tracking Social Media Creating A Successful Marketing Strategy SS V
This slide covers the dashboard for analyzing social media marketing campaigns. It includes metrics such as tweets, followers, followings, listed favorites, reach, views, Facebook engagement, clicks, likes, Instagram photos, etc. Deliver an outstanding presentation on the topic using this KPI Dashboard For Tracking Social Media Creating A Successful Marketing Strategy SS V. Dispense information and present a thorough explanation of KPI Dashboard, Tracking Social Media, Campaign Results using the slides given. This template can be altered and personalized to fit your needs. It is also available for immediate download. So grab it now.
-
 KPIs Dashboard To Track Digital Marketing Creating A Successful Marketing Strategy SS V
This slide covers the dashboard for analyzing online marketing campaigns. It includes metrics such as cost, clicks, impressions, CTR, cost per conversion, conversions, ad impressions, cost per click, conversion rate, etc. Present the topic in a bit more detail with this KPIs Dashboard To Track Digital Marketing Creating A Successful Marketing Strategy SS V. Use it as a tool for discussion and navigation on Kpis Dashboard, Track Digital, Marketing Campaign Results. This template is free to edit as deemed fit for your organization. Therefore download it now.
-
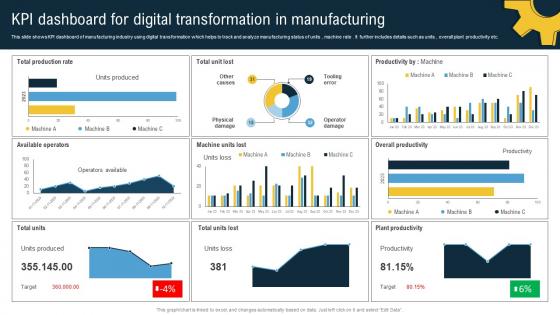 KPI Dashboard For Digital Transformation In Manufacturing
This slide shows KPI dashboard of manufacturing industry using digital transformation which helps to track and analyze manufacturing status of units, machine rate . It further includes details such as units, overall plant productivity etc. Introducing our KPI Dashboard For Digital Transformation In Manufacturing set of slides. The topics discussed in these slides are KPI Dashboard, Digital Transformation, Plant Productivity. This is an immediately available PowerPoint presentation that can be conveniently customized. Download it and convince your audience.
-
 Internal Forensic Audit Committee Dashboard
This slide showcases the forensic audit committee dashboard. Its objective is to check for internal problems or frauds and the analysing of inernal forensic committee. This slide includes quarterly idea, financial year plan, user activities, etc. Introducing our Internal Forensic Audit Committee Dashboard set of slides. The topics discussed in these slides are Internal Forensic Audit, Committee Dashboard, Inernal Forensic Committee. This is an immediately available PowerPoint presentation that can be conveniently customized. Download it and convince your audience.
-
 Dashboard Tracking Process Design In Operations Management
This slide showcases dashboard for tracking process design in operation management. The main purpose of this slide is to showcase records related to products. This includes new orders, monthly orders, pending orders etc.Presenting our well structured Dashboard Tracking Process Design In Operations Management. The topics discussed in this slide are Orders Pending, Orders Returned, Monthly Order. This is an instantly available PowerPoint presentation that can be edited conveniently. Download it right away and captivate your audience.
-
 Operations Management Dashboard Process Design
This slide showcases operation management dashboard. The main purpose of this template is tracking operation management such as no. of ticket, tickets raised this month, new employees, assignments, etc.Introducing our Operations Management Dashboard Process Design set of slides. The topics discussed in these slides are Operations Management, Dashboard Process Design. This is an immediately available PowerPoint presentation that can be conveniently customized. Download it and convince your audience.
-
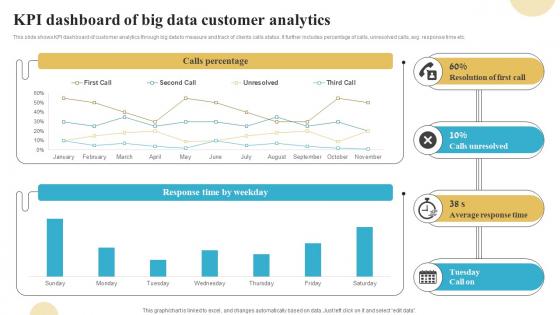 Kpi Dashboard Of Big Data Customer Analytics
This slide shows KPI dashboard of customer analytics through big data to measure and track of clients calls status. It further includes percentage of calls, unresolved calls, avg. response time etc. Presenting our well structured Kpi Dashboard Of Big Data Customer Analytics. The topics discussed in this slide are Calls Percentage, Resolution Of First Call, Calls Unresolved. This is an instantly available PowerPoint presentation that can be edited conveniently. Download it right away and captivate your audience.
-
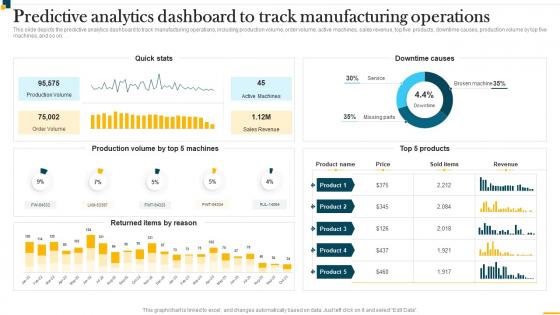 IT In Manufacturing Industry V2 Predictive Analytics Dashboard To Track Manufacturing Operations
This slide depicts the predictive analytics dashboard to track manufacturing operations, including production volume, order volume, active machines, sales revenue, top five products, downtime causes, production volume by top five machines, and so on. Present the topic in a bit more detail with this IT In Manufacturing Industry V2 Predictive Analytics Dashboard To Track Manufacturing Operations. Use it as a tool for discussion and navigation on Predictive Analytics Dashboard, Track Manufacturing Operations, Production Volume. This template is free to edit as deemed fit for your organization. Therefore download it now.
-
 Vulnerabilities Tracking Dashboard For Secops V2 Ppt Icon Graphics Template
This slide represents the vulnerabilities tracking dashboard for SecOps. The purpose of this slide is to demonstrate the tracking of vulnerabilities of an organizations assets, services with the most vulnerabilities, mean time to remediate, and the average age of vulnerabilities. Deliver an outstanding presentation on the topic using this Vulnerabilities Tracking Dashboard For Secops V2 Ppt Icon Graphics Template. Dispense information and present a thorough explanation of Vulnerabilities Tracking, Dashboard For Secops, Age Of Vulnerabilities, Mean Time To Remediate using the slides given. This template can be altered and personalized to fit your needs. It is also available for immediate download. So grab it now.
-
 Confidential Computing System Technology Performance Tracking Dashboard
This slide represents the performance tracking dashboard for confidential computing. The purpose of this slide is to represent the overall performance of the confidential computing cloud environment visually. The main components include overall health, operations, progress, time, cost and workloads. Deliver an outstanding presentation on the topic using this Confidential Computing System Technology Performance Tracking Dashboard. Dispense information and present a thorough explanation of Performance, Dashboard, Confidential using the slides given. This template can be altered and personalized to fit your needs. It is also available for immediate download. So grab it now.
-
 Digital Marketing Dashboard To Evaluate Healthcare Introduction To Healthcare Marketing Strategy SS V
The following slide outlines performance KPI dashboard through which healthcare brands can evaluate online marketing campaign performance on business. The metrics mentioned in slide are Google ads, Facebook ads, Instagram ads, conversions, sessions, cost per click CPC, etc. Deliver an outstanding presentation on the topic using this Digital Marketing Dashboard To Evaluate Healthcare Introduction To Healthcare Marketing Strategy SS V. Dispense information and present a thorough explanation of Google Ads, Facebook using the slides given. This template can be altered and personalized to fit your needs. It is also available for immediate download. So grab it now.
-
 Healthcare Marketing Dashboard To Measure Patient Introduction To Healthcare Marketing Strategy SS V
The following slide outlines comprehensive dashboard through which medical care companies can evaluate patient experience and make more informed decisions. The metrics outlined in slide are lab test, patient falls, average waiting time, etc. Present the topic in a bit more detail with this Healthcare Marketing Dashboard To Measure Patient Introduction To Healthcare Marketing Strategy SS V. Use it as a tool for discussion and navigation on Patient Satisfaction, Patient Falls. This template is free to edit as deemed fit for your organization. Therefore download it now.
-
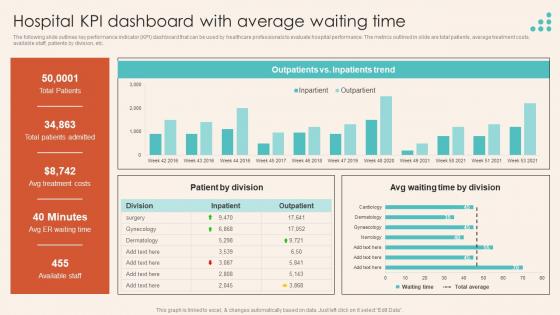 Hospital KPI Dashboard With Average Waiting Time Introduction To Healthcare Marketing Strategy SS V
The following slide outlines key performance indicator KPI dashboard that can be used by healthcare professionals to evaluate hospital performance. The metrics outlined in slide are total patients, average treatment costs, available staff, patients by division, etc. Present the topic in a bit more detail with this Hospital KPI Dashboard With Average Waiting Time Introduction To Healthcare Marketing Strategy SS V. Use it as a tool for discussion and navigation on Patient By Division. This template is free to edit as deemed fit for your organization. Therefore download it now.
-
 Key Indicator Dashboard To Measure Budget Report Projection
This slide represents ways to measure budget report projection with key indicator dashboard. This includes budget, spent, left to spend, budget by projects, budget vs spend etc. Presenting our well structured Key Indicator Dashboard To Measure Budget Report Projection. The topics discussed in this slide are Budget, Spent, Left To Spend. This is an instantly available PowerPoint presentation that can be edited conveniently. Download it right away and captivate your audience.
-
 Key Indicator Dashboard For Crisis Management For Employees And Customers
This slide showcases crisis management for employees and customers key indicator dashboard. This slide includes articles published, total interaction, overtime change in public interest and overtime change in media interest. Presenting our well structured Key Indicator Dashboard For Crisis Management For Employees And Customers. The topics discussed in this slide are Media Interest, Public Interest. This is an instantly available PowerPoint presentation that can be edited conveniently. Download it right away and captivate your audience.
-
 Metaverse Tech Performance Data Insight Dashboard
This slide represents the dashboard showing the metaverse tech performance data insights to monitor customer satisfaction rate. This includes satisfaction rate of users, active users, types of metaverse projects, metaverse sales overview, etc. Introducing our Satisfaction Rate, Virtual Spot, Metaverse Sales Overview set of slides. The topics discussed in these slides are Satisfaction Rate, Virtual Spot, Metaverse Sales Overview. This is an immediately available PowerPoint presentation that can be conveniently customized. Download it and convince your audience.
-
 Enabling High Quality Customer Relationship Management Dashboard To Enhance User Experience DT SS
This slide covers CRM software dashboard to track buyer journey and enhance user experience. It involves number of new contacts, total number of emails sent, revenue graph and task report.Deliver an outstanding presentation on the topic using this Enabling High Quality Customer Relationship Management Dashboard To Enhance User Experience DT SS Dispense information and present a thorough explanation of Quarterly Revenue Graph, Task Report, Deals Funnel using the slides given. This template can be altered and personalized to fit your needs. It is also available for immediate download. So grab it now.
-
 Enabling High Quality Dashboard To Track Customer Satisfaction Rate DT SS
This slide covers KPI dashboard to track customer satisfaction rate. It involves number of queries resolved on email and chat to improve customer experience and reduce waiting time. Present the topic in a bit more detail with this Enabling High Quality Dashboard To Track Customer Satisfaction Rate DT SS Use it as a tool for discussion and navigation on Email, CSAT Today, First Response Time This template is free to edit as deemed fit for your organization. Therefore download it now.
-
 Enabling High Quality Kpi Dashboard To Track Customer Support Performance DT SS
This slide covers KPI dashboard to track customer service performance and enhance customer satisfaction rate. It involves total solved tickets, weekly chat status and number of visitors. Present the topic in a bit more detail with this Enabling High Quality Kpi Dashboard To Track Customer Support Performance DT SS Use it as a tool for discussion and navigation on Visitors, Documentation Tags, Customer Satisfaction Rate This template is free to edit as deemed fit for your organization. Therefore download it now.
-
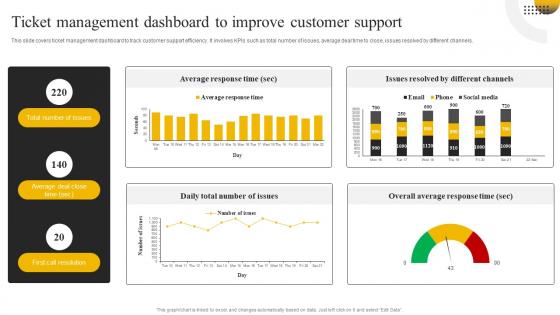 Enabling High Quality Ticket Management Dashboard To Improve Customer Support DT SS
This slide covers ticket management dashboard to track customer support efficiency. It involves KPIs such as total number of issues, average deal time to close, issues resolved by different channels. Deliver an outstanding presentation on the topic using this Enabling High Quality Ticket Management Dashboard To Improve Customer Support DT SS Dispense information and present a thorough explanation of Number Of Issues, First Call Resolution using the slides given. This template can be altered and personalized to fit your needs. It is also available for immediate download. So grab it now.
-
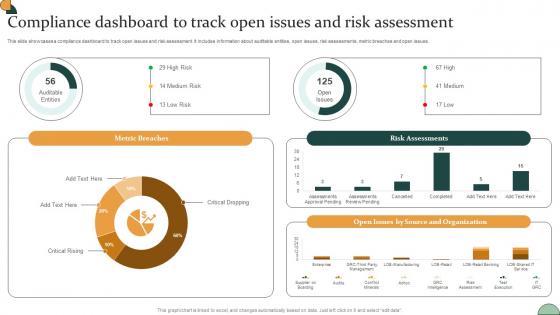 Corporate Compliance Strategy Compliance Dashboard To Track Open Issues And Risk Strategy SS V
This slide showcases a compliance dashboard to track open issues and risk assessment. It includes information about auditable entities, open issues, risk assessments, metric breaches and open issues. Present the topic in a bit more detail with this Corporate Compliance Strategy Compliance Dashboard To Track Open Issues And Risk Strategy SS V Use it as a tool for discussion and navigation on Metric Breaches, Risk Assessments, Source And Organization This template is free to edit as deemed fit for your organization. Therefore download it now.
-
 Corporate Compliance Strategy Dashboard Monitoring The Performance Of Various Strategy SS V
This slide presents a dashboard monitoring the performance of various compliance measures. It tracks KPIs such as compliance and risk posture, risk trends, regulatory compliance and high risk assets. Present the topic in a bit more detail with this Corporate Compliance Strategy Dashboard Monitoring The Performance Of Various Strategy SS V Use it as a tool for discussion and navigation on Corporate Compliance Strategy Curriculum For Employee Workplace Health And Safety Strategy SS V This template is free to edit as deemed fit for your organization. Therefore download it now.
-
 Creating An Interactive Marketing KPI Dashboard For Tracking Social Media User Engagement MKT SS V
This slide shows KPI dashboard for assessing performance of social media platforms. It provides information about followers, likes, clicks, shares, impressions, engaged users, new followers, etc. Present the topic in a bit more detail with this Creating An Interactive Marketing KPI Dashboard For Tracking Social Media User Engagement MKT SS V. Use it as a tool for discussion and navigation on Social Media Followers, Social Media Platforms Engagement. This template is free to edit as deemed fit for your organization. Therefore download it now.
-
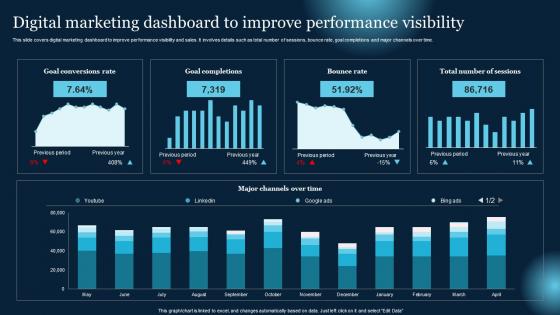 Digital Marketing Dashboard To Improve Performance Visibility Effective B2B Lead
This slide covers digital marketing dashboard to improve performance visibility and sales. It involves details such as total number of sessions, bounce rate, goal completions and major channels over time. Present the topic in a bit more detail with this Digital Marketing Dashboard To Improve Performance Visibility Effective B2B Lead Use it as a tool for discussion and navigation on Goal Conversions Rate, Goal Completions, Bounce Rate This template is free to edit as deemed fit for your organization. Therefore download it now.
-
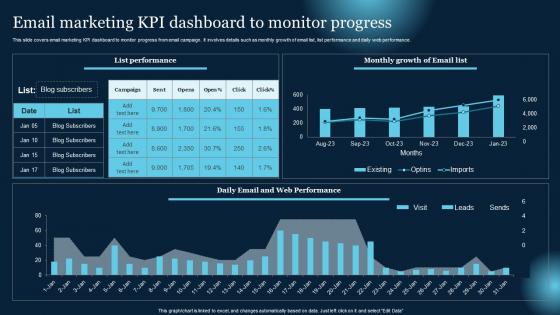 Email Marketing KPI Dashboard To Monitor Progress Effective B2B Lead
This slide covers email marketing KPI dashboard to monitor progress from email campaign. It involves details such as monthly growth of email list, list performance and daily web performance. Present the topic in a bit more detail with this Email Marketing KPI Dashboard To Monitor Progress Effective B2B Lead Use it as a tool for discussion and navigation on List Performance, Growth Of Email List, Email Marketing This template is free to edit as deemed fit for your organization. Therefore download it now.
-
 KPI Dashboard To Assess Performance Of Marketing Strategies Effective B2B Lead
This slide covers KPI dashboard to analyze performance of strategies for effective b2b lead generation. It involves details such as sales lead funnel, traffic sources and leads generated on monthly basis. Present the topic in a bit more detail with this KPI Dashboard To Assess Performance Of Marketing Strategies Effective B2B Lead Use it as a tool for discussion and navigation on Sales Lead Funnel, Assess Performance, Marketing Strategies This template is free to edit as deemed fit for your organization. Therefore download it now.
-
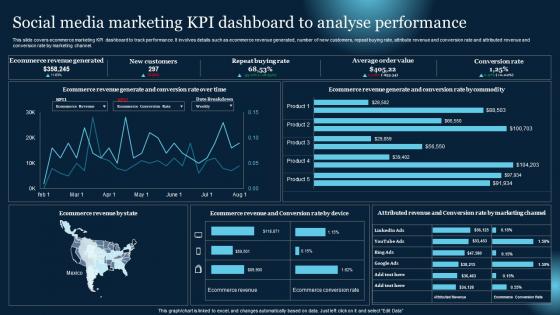 Social Media Marketing KPI Dashboard To Analyse Performance Effective B2B Lead
This slide covers ecommerce marketing KPI dashboard to track performance. It involves details such as ecommerce revenue generated, number of new customers, repeat buying rate, attribute revenue and conversion rate and attributed revenue and conversion rate by marketing channel. Deliver an outstanding presentation on the topic using this Social Media Marketing KPI Dashboard To Analyse Performance Effective B2B Lead Dispense information and present a thorough explanation of Ecommerce Revenue Generated, New Customers, Repeat Buying Rate using the slides given. This template can be altered and personalized to fit your needs. It is also available for immediate download. So grab it now.


