Powerpoint Templates and Google slides for Conducting Statistical Analysis
Save Your Time and attract your audience with our fully editable PPT Templates and Slides.
-
 Statistical Analysis For Data Driven Key Statistical Terms For Conducting Samples
The purpose of this slide is to outline the statistical measures involved in sampling data for analytical processes. These terms are population standard deviation, statistical power, expected effect size, significance level, etc. Deliver an outstanding presentation on the topic using this Statistical Analysis For Data Driven Key Statistical Terms For Conducting Samples. Dispense information and present a thorough explanation of Population Standard Deviation, Predetermined Threshold, Probability Of Rejecting A Null Hypothesis using the slides given. This template can be altered and personalized to fit your needs. It is also available for immediate download. So grab it now.
-
 Statistical Analysis For Data Driven Timeline To Conduct Statistical Data Analysis
This slide shows the timeline for performing statistical data analysis. The key steps include writing hypothesis and plan research design, collect data from a sample, summarize data with descriptive statistics, test hypotheses, result interpretation, etc. Introducing Statistical Analysis For Data Driven Timeline To Conduct Statistical Data Analysis to increase your presentation threshold. Encompassed with five stages, this template is a great option to educate and entice your audience. Dispence information on Statistical Data Analysis, Test Hypotheses, Result Interpretation, Plan Research Design, using this template. Grab it now to reap its full benefits.
-
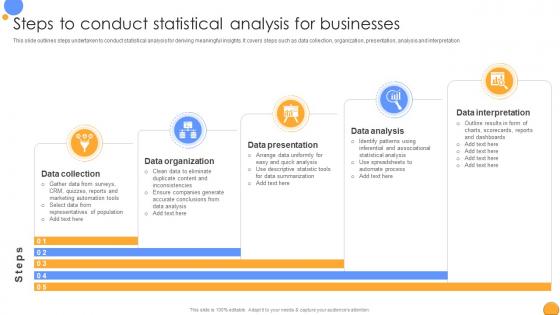
 Steps To Conduct Statistical Analysis Mastering Data Analytics A Comprehensive Data Analytics SS
This slide outlines steps undertaken to conduct statistical analysis for deriving meaningful insights. It covers steps such as data collection, organization, presentation, analysis and interpretation. Increase audience engagement and knowledge by dispensing information using Steps To Conduct Statistical Analysis Mastering Data Analytics A Comprehensive Data Analytics SS. This template helps you present information on five stages. You can also present information on Data Organization, Data Presentation, Data Analysis using this PPT design. This layout is completely editable so personaize it now to meet your audiences expectations.
-
 Statistical Analysis Techniques Timeline To Conduct Statistical Data Analysis
This slide shows the timeline for performing statistical data analysis. The key steps include writing hypothesis and plan research design, collect data from a sample, summarize data with descriptive statistics, test hypotheses, result interpretation, etc. Introducing Statistical Analysis Techniques Timeline To Conduct Statistical Data Analysis to increase your presentation threshold. Encompassed with Five stages, this template is a great option to educate and entice your audience. Dispence information on Plan Research Design, Test Hypotheses, Result Interpretation, using this template. Grab it now to reap its full benefits.
-
 Conducting Statistical Analysis In Powerpoint And Google Slides Cpb
Presenting Conducting Statistical Analysis In Powerpoint And Google Slides Cpb slide which is completely adaptable. The graphics in this PowerPoint slide showcase four stages that will help you succinctly convey the information. In addition, you can alternate the color, font size, font type, and shapes of this PPT layout according to your content. This PPT presentation can be accessed with Google Slides and is available in both standard screen and widescreen aspect ratios. It is also a useful set to elucidate topics like Conducting Statistical Analysis. This well structured design can be downloaded in different formats like PDF, JPG, and PNG. So, without any delay, click on the download button now.
-
 Statistics Highlighting Business Key Information Methods To Conduct Competitor Analysis MKT SS V
The following slide highlights statistics presenting business vital information to gain basic understanding of business. It showcases information such as business worth, employees, countries, active customers, market share, revenue, operating profit, profit, industry and target audience.Introducing Statistics Highlighting Business Key Information Methods To Conduct Competitor Analysis MKT SS V to increase your presentation threshold. Encompassed with twelve stages, this template is a great option to educate and entice your audience. Dispence information on Activity Overview, Audience Growth, Analysis Dashboard, using this template. Grab it now to reap its full benefits.
-
 Statistical manager icon conducting customer analysis using cognitive expertise
Presenting this set of slides with name Statistical Manager Icon Conducting Customer Analysis Using Cognitive Expertise. The topics discussed in these slides is Statistical Manager Icon Conducting Customer Analysis Using Cognitive Expertise. This is a completely editable PowerPoint presentation and is available for immediate download. Download now and impress your audience.
-
 Statistical analysis of work performance to conduct future training programs
Introducing our premium set of slides with Statistical Analysis Of Work Performance To Conduct Future Training Programs. Ellicudate the four stages and present information using this PPT slide. This is a completely adaptable PowerPoint template design that can be used to interpret topics like Statistical Analysis Of Work Performance To Conduct Future Training Programs. So download instantly and tailor it with your information.


