Powerpoint Templates and Google slides for Charts And Dashboards
Save Your Time and attract your audience with our fully editable PPT Templates and Slides.
-
 Financial comparison business chart analytics and dashboard
Presenting this set of slides with name - Financial Comparison Business Chart Analytics And Dashboard. This is a one stage process. The stages in this process are Financial Comparison, Financial Analysis, Financial Statement.
-
 Vendor kpi dashboard showing role holder alerts and specialization chart
Presenting Vendor KPI Dashboard Showing Role Holder Alerts And Specialization Chart Pictures PPT slide. This presentation design has been professionally designed, is fully editable in PowerPoint and is compatible with Google slides as well. The font type, font size, colors of the diagrams, background color are customizable and the company logo can be added too. High quality graphs, charts, tables and icons ensure that there is no deteriorating in quality on enlarging their size. Fast download at click of a button.
-
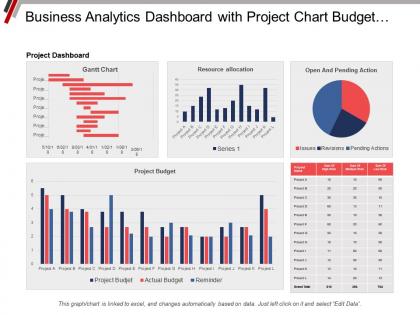
 Business analytics dashboard snapshot with project chart budget resource allocation and pending actions
This is a five stage process. The stages in this process are Business Analytics, BA, Organizations Data.
-
 Project Efficiency Dashboard Icon With Graphs And Charts
Presenting our set of slides with Project Efficiency Dashboard Icon With Graphs And Charts. This exhibits information on three stages of the process. This is an easy to edit and innovatively designed PowerPoint template. So download immediately and highlight information on Project Efficiency Dashboard Icon With Graphs And Charts.
-
 Security Dashboard With Various Charts And Graphs
Present the topic in a bit more detail with this Security Dashboard With Various Charts And Graphs. Use it as a tool for discussion and navigation on Security, Dashboard, Charts And Graphs. This template is free to edit as deemed fit for your organization. Therefore download it now.
-
 Progress sales chart and donut dashboard
Presenting this set of slides with name Progress Sales Chart And Donut Dashboard. The topics discussed in these slides are Progress Dashboard, Chart And Graph, Finance, Marketing. This is a completely editable PowerPoint presentation and is available for immediate download. Download now and impress your audience.
-
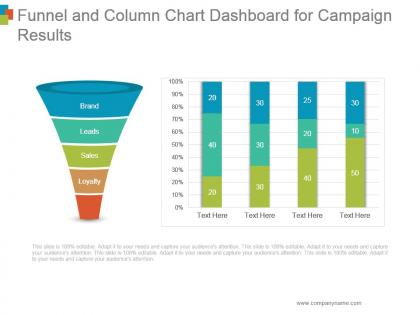
 Funnel and column chart dashboard for campaign results ppt background images
Presenting funnel and column chart dashboard for campaign results ppt background images. This is a funnel and column chart dashboard for campaign results ppt background images. This is a two stage process. The stages in this process are brand, leads, sales, loyalty.
-
 Business projection chart and dashboard ppt samples download
Presenting financial projection graph PPT samples Download which is 100% editable. The inserted features in this PPT are easy with modifications and all the features used in this PowerPoint presentation are compatible with Google Slides, multiple format and software options. This PPT is easy to download in a very short span of time. In case of any assistance, the presenter may refer to presentation designs services being provided along with this PowerPoint presentation. This PPT slide can be saved as JPG or in pdf format.
-
 Project status kpi dashboard showing project plan and burndown chart
Presenting status KPI dashboard showing project plan and burndown chart PowerPoint slides. This layout is Compatible with Google slides. Easy to put in company logo, trademark or name; accommodate words to support the key points. Images do no blur out even when they are projected on large screen.PPT template can be utilized by sales and marketing teams and business managers. Instantly downloadable slide and supports formats like JPEG and PDF. Adjust colors, text and fonts as per your business requirements.
-
 Quality dashboard showing amount of work and the percentage charts
SlideTeam presents to you its quality dashboard showing amount of work and the percentage charts.You can also alter the font size, font color and font style of the text so used in the slides. The business template can be saved in format of PDF or JPG as per your requirements. So download this slideshow and make most of it.
-
 Dashboard icons with graphs and bar charts
Presenting this set of slides with name Dashboard Icons With Graphs And Bar Charts. The topics discussed in these slide is Dashboard Icons With Graphs And Bar Charts. This is a completely editable PowerPoint presentation and is available for immediate download. Download now and impress your audience.
-
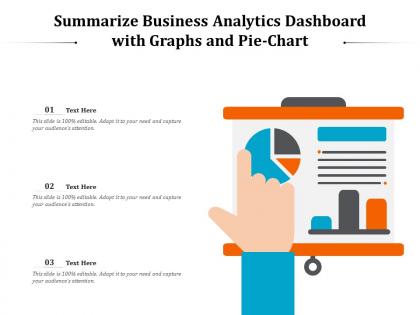
 Summarize business analytics dashboard with graphs and pie chart
Presenting this set of slides with name Summarize Business Analytics Dashboard With Graphs And Pie Chart. The topics discussed in these slides is Summarize Business Analytics Dashboard With Graphs And Pie Chart. This is a completely editable PowerPoint presentation and is available for immediate download. Download now and impress your audience.
-
 Audit dashboard snapshot with histogram and pie chart
Presenting this set of slides with name Audit Dashboard With Histogram And Pie Chart. The topics discussed in these slide is Audit Dashboard Snapshot With Histogram And Pie Chart. This is a completely editable PowerPoint presentation and is available for immediate download. Download now and impress your audience.
-
 Priority chart and project dashboard with high medium low levels
Introducing our premium set of slides with Priority Chart And Project Dashboard With High Medium Low Levels. Ellicudate the three stages and present information using this PPT slide. This is a completely adaptable PowerPoint template design that can be used to interpret topics like Low, Medium, High. So download instantly and tailor it with your information.
-
 Sales performance dashboard showing bar graph and pie chart on screen
Presenting our set of slides with name Sales Performance Dashboard Showing Bar Graph And Pie Chart On Screen. This exhibits information on one stages of the process. This is an easy-to-edit and innovatively designed PowerPoint template. So download immediately and highlight information on Sales Performance Dashboard Showing Bar Graph And Pie Chart On Screen.
-
 Project portfolio management dashboard and chart
In this slide we have showcased combine project assessment with the help of bar and pie chart, it includes- project progress, effort by project and task assessment. Introducing our Project Portfolio Management Dashboard And Chart set of slides. The topics discussed in these slides are Project Portfolio Management Dashboard And Chart. This is an immediately available PowerPoint presentation that can be conveniently customized. Download it and convince your audience.


