Powerpoint Templates and Google slides for Charting
Save Your Time and attract your audience with our fully editable PPT Templates and Slides.
-
 6 piece colored pie chart with numbers
Presenting this set of slides with name - 6 Piece Colored Pie Chart With Numbers. This is a six stage process. The stages in this process are 6 Piece Pie Chart, 6 Parts Pie Chart, 6 Segment Pie Chart.
-
 6 piece multicolored pie chart with icons and boxes
Presenting this set of slides with name - 6 Piece Multicolored Pie Chart With Icons And Boxes. This is a six stage process. The stages in this process are 6 Piece Pie Chart, 6 Parts Pie Chart, 6 Segment Pie Chart.
-
 6 piece pie chart with boxes and numbers
Presenting this set of slides with name - 6 Piece Pie Chart With Boxes And Numbers. This is a six stage process. The stages in this process are 6 Piece Pie Chart, 6 Parts Pie Chart, 6 Segment Pie Chart.
-
 6 piece pie chart with magnifying glass and boxes
Presenting this set of slides with name - 6 Piece Pie Chart With Magnifying Glass And Boxes. This is a six stage process. The stages in this process are 6 Piece Pie Chart, 6 Parts Pie Chart, 6 Segment Pie Chart.
-
 7 piece colored pie chart with numbers
Presenting this set of slides with name - 7 Piece Colored Pie Chart With Numbers. This is a seven stage process. The stages in this process are 6 Piece Pie Chart, 6 Parts Pie Chart, 6 Segment Pie Chart.
-
 7 piece multicolored pie chart with icons and boxes
Presenting this set of slides with name - 7 Piece Multicolored Pie Chart With Icons And Boxes. This is a seven stage process. The stages in this process are 6 Piece Pie Chart, 6 Parts Pie Chart, 6 Segment Pie Chart.
-
 7 piece pie chart with boxes and numbers
Presenting this set of slides with name - 7 Piece Pie Chart With Boxes And Numbers. This is a seven stage process. The stages in this process are 6 Piece Pie Chart, 6 Parts Pie Chart, 6 Segment Pie Chart.
-
 7 piece pie chart with magnifying glass and boxes
Presenting this set of slides with name - 7 Piece Pie Chart With Magnifying Glass And Boxes. This is a seven stage process. The stages in this process are 6 Piece Pie Chart, 6 Parts Pie Chart, 6 Segment Pie Chart.
-
 8 piece colored pie chart with numbers
Presenting this set of slides with name - 8 Piece Colored Pie Chart With Numbers. This is a eight stage process. The stages in this process are 6 Piece Pie Chart, 6 Parts Pie Chart, 6 Segment Pie Chart.
-
 8 piece green pie chart with numbers
Presenting this set of slides with name - 8 Piece Green Pie Chart With Numbers. This is a eight stage process. The stages in this process are 6 Piece Pie Chart, 6 Parts Pie Chart, 6 Segment Pie Chart.
-
 8 piece multicolored pie chart with icons and boxes
Presenting this set of slides with name - 8 Piece Multicolored Pie Chart With Icons And Boxes. This is a eight stage process. The stages in this process are 6 Piece Pie Chart, 6 Parts Pie Chart, 6 Segment Pie Chart.
-
 8 piece pie chart with boxes and numbers
Presenting this set of slides with name - 8 Piece Pie Chart With Boxes And Numbers. This is a eight stage process. The stages in this process are 6 Piece Pie Chart, 6 Parts Pie Chart, 6 Segment Pie Chart.
-
 8 piece pie chart with magnifying glass and boxes
Presenting this set of slides with name - 8 Piece Pie Chart With Magnifying Glass And Boxes. This is a eight stage process. The stages in this process are 6 Piece Pie Chart, 6 Parts Pie Chart, 6 Segment Pie Chart.
-
 Deliver offers catalog price 6 piece pie chart
Presenting this set of slides with name - Deliver Offers Catalog Price 6 Piece Pie Chart. This is a six stage process. The stages in this process are 6 Piece Pie Chart, 6 Parts Pie Chart, 6 Segment Pie Chart.
-
 Deliver offers catalog price 7 piece pie chart
Presenting this set of slides with name - Deliver Offers Catalog Price 7 Piece Pie Chart. This is a seven stage process. The stages in this process are 6 Piece Pie Chart, 6 Parts Pie Chart, 6 Segment Pie Chart.
-
 Deliver offers catalog price 8 piece pie chart
Presenting this set of slides with name - Deliver Offers Catalog Price 8 Piece Pie Chart. This is a eight stage process. The stages in this process are 6 Piece Pie Chart, 6 Parts Pie Chart, 6 Segment Pie Chart.
-
 Quantitative bar graph chart showing survey respondents
Presenting this set of slides with name - Quantitative Bar Graph Chart Showing Survey Respondents. This is a five stage process. The stages in this process are Quantitative, Financial Analysis, Statistical Modelling.
-
 Quantitative data showing area chart sales history
Presenting this set of slides with name - Quantitative Data Showing Area Chart Sales History. This is a one stage process. The stages in this process are Quantitative, Financial Analysis, Statistical Modelling.
-
 Quantitative data showing column chart sales by order type
Presenting this set of slides with name - Quantitative Data Showing Column Chart Sales By Order Type. This is a four stage process. The stages in this process are Quantitative, Financial Analysis, Statistical Modelling.
-
 Analytic data chart of business kpi image showing employee working on desktop
Presenting this set of slides with name - Analytic Data Chart Of Business Kpi Image Showing Employee Working On Desktop. This is a three stage process. The stages in this process are Business Kpi, Business Dashboard, Business Metrics.
-
 Business kpi contain visualization aid of analytic data in form of bar chart
Presenting this set of slides with name - Business Kpi Contain Visualization Aid Of Analytic Data In Form Of Bar Chart. This is a four stage process. The stages in this process are Business Kpi, Business Dashboard, Business Metrics.
-
 Business kpi showing summary of key performance indicator data representation in line graph and pie chart
Presenting this set of slides with name - Business Kpi Showing Summary Of Key Performance Indicator Data Representation In Line Graph And Pie Chart. This is a three stage process. The stages in this process are Business Kpi, Business Dashboard, Business Metrics.
-
 Employee looking at the graph of business kpi in tablet covering bar graphs and pie charts
Presenting this set of slides with name - Employee Looking At The Graph Of Business Kpi In Tablet Covering Bar Graphs And Pie Charts. This is a four stage process. The stages in this process are Business Kpi, Business Dashboard, Business Metrics.
-
 Summary of key performance showing graphical representation of business kpi in bar graphs and pie charts
Presenting this set of slides with name - Summary Of Key Performance Showing Graphical Representation Of Business Kpi In Bar Graphs And Pie Charts. This is a three stage process. The stages in this process are Business Kpi, Business Dashboard, Business Metrics.
-
 Visualization representation of business kpi data showing chart and graph of financial data
Presenting this set of slides with name - Visualization Representation Of Business Kpi Data Showing Chart And Graph Of Financial Data. This is a four stage process. The stages in this process are Business Kpi, Business Dashboard, Business Metrics.
-
 Hia aids pie chart image showing data
Presenting this set of slides with name - Hia Aids Pie Chart Image Showing Data. This is a two stage process. The stages in this process are Hiv Aids, Human Immunodeficiency Virus Infection And Acquired Immune Deficiency Syndrome, Health Disasters.
-
 Project progress showing burn down chart start and finish date
Presenting this set of slides with name - Project Progress Showing Burn Down Chart Start And Finish Date. This is a one stage process. The stages in this process are Project Progress, Project Growth, Project Management.
-
 Facts chart graph report writing and analysis
Presenting this set of slides with name - Facts Chart Graph Report Writing And Analysis. This is a one stage process. The stages in this process are Facts, Factual, Reality.
-
 Facts pie chart graph business report review
Presenting this set of slides with name - Facts Pie Chart Graph Business Report Review. This is a three stage process. The stages in this process are Facts, Factual, Reality.
-
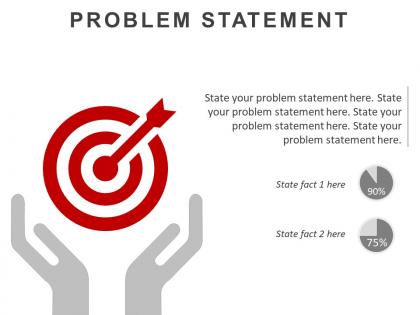
 Problem statement with target board and data driven pie charts
Presenting problem statement with target board and data driven pie charts. This is a problem statement with target board and data driven pie charts. This is a one stage process. The stages in this process are problem, business problem, research problem statement, business challenge, challenges.
-
 Organisation contributors evaluation chart with value of contribution in percent
Presenting this set of slides with name - Organisation Contributors Evaluation Chart With Value Of Contribution In Percent. This is a ten stage process. The stages in this process are Contributor, Writer, Reporter.
-
 Project background showing completion index and pie chart
Presenting this set of slides with name - Project Background Showing Completion Index And Pie Chart. This is a four stage process. The stages in this process are Project Background, Project Management, Project Description.
-
 Drill down bar graph to pie chart
Presenting this set of slides with name - Drill Down Bar Graph To Pie Chart. This is a two stage process. The stages in this process are Drill Down, Hierarchy, Top Downwards.
-
 Drill down bar graph to semi circular pie chart
Presenting this set of slides with name - Drill Down Bar Graph To Semi Circular Pie Chart. This is a two stage process. The stages in this process are Drill Down, Hierarchy, Top Downwards.
-
 Drill down country wise breakdown having bar graph and pie chart
Presenting this set of slides with name - Drill Down Country Wise Breakdown Having Bar Graph And Pie Chart. This is a three stage process. The stages in this process are Drill Down, Hierarchy, Top Downwards.
-
 Drill down month wise pie chart and day wise bar graph
Presenting this set of slides with name - Drill Down Month Wise Pie Chart And Day Wise Bar Graph. This is a two stage process. The stages in this process are Drill Down, Hierarchy, Top Downwards.
-
 Goal status with thermometer chart
Presenting this set of slides with name - Goal Status With Thermometer Chart. This is a one stage process. The stages in this process are Goal Status, Objective Status, Aim Status.
-
 3d graphs business bar chart and pie chart with icons
Presenting this set of slides with name - 3d Graphs Business Bar Chart And Pie Chart With Icons. This is a two stage process. The stages in this process are Paint Brush, Art, Coloring.
-
 Vendor kpi dashboard showing role holder alerts and specialization chart
Presenting Vendor KPI Dashboard Showing Role Holder Alerts And Specialization Chart Pictures PPT slide. This presentation design has been professionally designed, is fully editable in PowerPoint and is compatible with Google slides as well. The font type, font size, colors of the diagrams, background color are customizable and the company logo can be added too. High quality graphs, charts, tables and icons ensure that there is no deteriorating in quality on enlarging their size. Fast download at click of a button.
-
 Tech cash diversified trading revenue drivers allocation chart with icons
Presenting this set of slides with name - Tech Cash Diversified Trading Revenue Drivers Allocation Chart With Icons. This is a seven stage process. The stages in this process are Revenue Drivers, Income Drivers, Earning Drivers.
-
 Bubble chart for product differentiation of pricing vs sales record of current year
Presenting this set of slides with name - Bubble Chart For Product Differentiation Of Pricing Vs Sales Record Of Current Year. This is a four stage process. The stages in this process are Product Differentiation, Product Competition, Competitive Analysis.
-
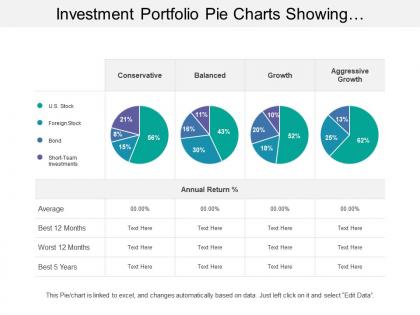
 Investment portfolio pie charts showing conservative and balanced growth
Presenting this set of slides with name - Investment Portfolio Pie Charts Showing Conservative And Balanced Growth. This is a four stage process. The stages in this process are Investment Portfolio, Funding Portfolio, Expenditure Portfolio.
-
 Investment portfolio pie charts showing shares property bond cash risk investor
Presenting this set of slides with name - Investment Portfolio Pie Charts Showing Shares Property Bond Cash Risk Investor. This is a three stage process. The stages in this process are Investment Portfolio, Funding Portfolio, Expenditure Portfolio.
-
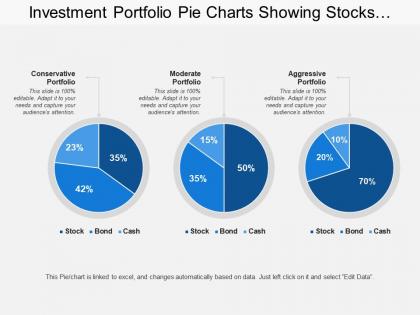
 Investment portfolio pie charts showing stocks bonds cash with conservative portfolio
Presenting this set of slides with name - Investment Portfolio Pie Charts Showing Stocks Bonds Cash With Conservative Portfolio. This is a three stage process. The stages in this process are Investment Portfolio, Funding Portfolio, Expenditure Portfolio.
-
 Hr dashboard employee age breakdown graph donut chart
Presenting this set of slides with name - Hr Dashboard Employee Age Breakdown Graph Donut Chart. This is a four stage process. The stages in this process are Hr Dashboard, Human Resource Dashboard, Hr Kpi.
-
 Hr dashboard shown by pie charts hand humans
Presenting this set of slides with name - Hr Dashboard Shown By Pie Charts Hand Humans. This is a four stage process. The stages in this process are Hr Dashboard, Human Resource Dashboard, Hr Kpi.
-
 Business flow diagram chart marketing powerpoint templates ppt backgrounds for slides 0523
High quality of images used in the PPT slide. Presentation design can be offered in standard and widescreen view. Preference to amend the PowerPoint design. Easy download and transformable into JPG and PDF. Adjustable designs as fully compatible with Google slides. Alternate to include or exclude company image and logo. Suitable for business and marketing industry.
-
 Arrows in circle chart 2 stages showing circular flow in process 2 halves powerpoint templates 0712
Circle Chart is a type of graphics that shows how items are related to one another in a repeating cycle.
-
 Rectangular jigsaw puzzle chart powerpoint templates ppt presentation slides 0812
You can use this diagram for explaining the solution of more general problems.
-
 Two way process circular chart powerpoint templates graphics slides 0712
Complete your presentation and convince your audience with high quality design.
-
 3d circular approach chart 2 stages powerpoint diagrams presentation slides graphics 0912
3D Circular Chart in red and green color can be helpful on explaining two different approaches for business process
-
 Global economic circular chart 2 stages powerpoint diagrams presentation slides graphics 0912
This chart makes employees more productive, helping them understand company strategy and structure.
-
 Half yearly plan shown by pie chart split up powerpoint diagram templates graphics 712
These high quality, editable pre-designed half yearly plan shown by pie chart split up powerpoint diagram templates graphics 712 powerpoint slides and powerpoint templates have been carefully created by our professional team to help you impress your audience. Each graphic in every powerpoint slide is vector based and is 100% editable in powerpoint.
-
 Business powerpoint templates creative sales puzzle charts for and education ppt slides
It is all there in bits and pieces. Individual components well researched and understood in their place. Now you need to get it all together to form the complete picture and reach the goal. You have the ideas and plans on how to go about it. Use this template to illustrate your method, piece by piece, and interlock the whole process in the minds of your audience. It is a 15x16 240 pieces 3D Rectangular Jigsaw Puzzle Matrix.
-
 Business powerpoint templates rectangular jigsaw problem solving puzzle piece chart sales ppt slides
It is all there in bits and pieces. Individual components well researched and understood in their place. Now you need to get it all together to form the complete picture and reach the goal. You have the ideas and plans on how to go about it. Use this template to illustrate your method, piece by piece, and interlock the whole process in the minds of your audience. It is a 14x13 182 pieces 3D Rectangular Jigsaw Puzzle Matrix.
-
 Business powerpoint templates rectangular jigsaw strategy puzzle chart sales ppt slides
Competitive level of design and content. Flawless picture quality for clear widescreen projection. Error free compatibility with multiple number of online and offline software. Ease of editing PPT diagrams images, text, font, colors, etc. Add or swipe out the slide elements at your sole discretion. Easy inclusion of company specific name, logo or trademark. A structured layout. Used by students, educators, marketers, strategists, sales people and human resource personnel.
-
 Ring chart diagram 2 stages powerpoint slides and ppt templates 0412
This template is skillfully designed and is completely editable to suit all the needs and requirements of the user. The color of the font, its size, style, and all other elements can be customized according to the user's desire The text in the PPT placeholder can be replaced with the desired information making this template highly flexible and adaptable as well. This template is also compatible with various Microsoft versions and formats like Google Slides, JPG, PDF, etc so the user will face no issue in saving it in the format of his choice.
-
 Interconnected circular diagram chart 2 stages 5
This template is skillfully designed and is completely editable to suit all the needs and requirements of the user. The color of the font, its size, style, and all other elements can be customized according to the user's desire The text in the PPT placeholder can be replaced with the desired information making this template highly flexible and adaptable as well. This template is also compatible with various Microsoft versions and formats like Google Slides, JPG, PDF, etc so the user will face no issue in saving it in the format of his choice.
-
 Global economic circular chart 2 stages 11
This template is skillfully designed and is completely editable to suit all the needs and requirements of the user. The color of the font, its size, style, and all other elements can be customized according to the user's desire The text in the PPT placeholder can be replaced with the desired information making this template highly flexible and adaptable as well. This template is also compatible with various Microsoft versions and formats like Google Slides, JPG, PDF, etc so the user will face no issue in saving it in the format of his choice.
-
 Two way process circular chart 7
This template is skillfully designed and is completely editable to suit all the needs and requirements of the user. The color of the font, its size, style, and all other elements can be customized according to the user's desire The text in the PPT placeholder can be replaced with the desired information making this template highly flexible and adaptable as well. This template is also compatible with various Microsoft versions and formats like Google Slides, JPG, PDF, etc so the user will face no issue in saving it in the format of his choice.


