Powerpoint Templates and Google slides for Business statistics 3
Save Your Time and attract your audience with our fully editable PPT Templates and Slides.
-
 Business workflow diagram 3d circular pie chart statistics powerpoint slides
We are proud to present our business workflow diagram 3d circular pie chart statistics powerpoint slides. The above PowerPoint diagram contains an image of 3d pie chart also known as donut diagram. This diagram is a graphical representation of a business process flow, consisting of activities and the connections between these activities.
-
 3 Part Slide Business Innovation Portfolio Management Statistics Approval
If you require a professional template with great design, then this 3 Part Slide Business Innovation Portfolio Management Statistics Approval is an ideal fit for you. Deploy it to enthrall your audience and increase your presentation threshold with the right graphics, images, and structure. Portray your ideas and vision using twelve slides included in this complete deck. This template is suitable for expert discussion meetings presenting your views on the topic. With a variety of slides having the same thematic representation, this template can be regarded as a complete package. It employs some of the best design practices, so everything is well-structured. Not only this, it responds to all your needs and requirements by quickly adapting itself to the changes you make. This PPT slideshow is available for immediate download in PNG, JPG, and PDF formats, further enhancing its usability. Grab it by clicking the download button.
-
 6 stages pie donut chart business statistics 3
This template is skillfully designed and is completely editable to suit all the needs and requirements of the user. The color of the font, its size, style, and all other elements can be customized according to the user's desire The text in the PPT placeholder can be replaced with the desired information making this template highly flexible and adaptable as well. This template is also compatible with various Microsoft versions and formats like Google Slides, JPG, PDF, etc so the user will face no issue in saving it in the format of his choice.
-
 Business context diagrams 3d analysis of donut statistical chart stages powerpoint templates
We are proud to present our business context diagrams 3d analysis of donut statistical chart stages powerpoint templates. Donut Charts are identical to pie charts. Deliver unique Microsoft office PPT Presentations with our above diagram. This diagram display proportions and distributions. Use this diagram for business presentations on corporate structure, business strategies, and strategic business management.
-
 Data driven 3d bar chart for business statistics powerpoint slides
We are proud to present our data driven 3d bar chart for business statistics powerpoint slides. This Professionally designed PowerPoint template shows bar chart for business statistics. Using visual representations to present data and evaluation of activities makes audience easier to understand.
-
 Data driven 3d pie chart for business statistics powerpoint slides
We are proud to present our data driven 3d pie chart for business statistics powerpoint slides. Put The Wind In Your Sails With Our Data Driven 3D Pie Chart For Business Statistics Powerpoint Slides Power Point Templates. Skim Smoothly Over The Choppy Waters Of The Market. Let Our Data Driven 3D Pie Chart For Business Statistics Powerpoint Slides Power Point Templates Give The Updraft To Your Ideas. See Them Soar To Great Heights With Ease.
-
 Asahi group holdings ltd statistic 3 alcohol beverages business segment
This is a professionally designed visual chart for Asahi Group Holdings Ltd Statistic 3 Alcohol Beverages Business Segment. This is part of our Data and Statistics products selection, and you will need a Paid account to download the actual report with accurate data and sources. Downloaded report will contain the editable graph with accurate data, an excel table with the actual data, the exact source of the data and the release date. This slide provides a graph of revenue in JPY Bn and core operating profit margin of Alcohol Beverages Business Segment of Asahi Group Holdings, Ltd for the years 2014 to 18. Download it immediately and use it for your business.
-
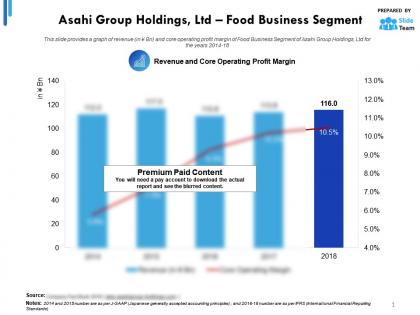
 Asahi group holdings ltd statistic 3 food business segment
This is a professionally designed visual chart for Asahi Group Holdings Ltd Statistic 3 Food Business Segment. This is part of our Data and Statistics products selection, and you will need a Paid account to download the actual report with accurate data and sources. Downloaded report will contain the editable graph with accurate data, an excel table with the actual data, the exact source of the data and the release date. This slide provides a graph of revenue in JPY Bn and core operating profit margin of Food Business Segment of Asahi Group Holdings, Ltd for the years 2014 to 18. Download it immediately and use it for your business.
-
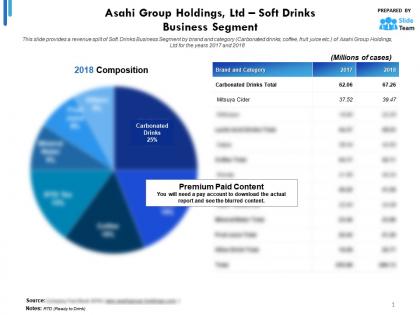
 Asahi group holdings ltd statistic 3 soft drinks business segment
This is a professionally designed visual chart for Asahi Group Holdings Ltd Statistic 3 Soft Drinks Business Segment. This is part of our Data and Statistics products selection, and you will need a Paid account to download the actual report with accurate data and sources. Downloaded report will contain the editable graph with accurate data, an excel table with the actual data, the exact source of the data and the release date. This slide provides a revenue split of Soft Drinks Business Segment by brand and category Carbonated drinks, coffee, fruit juice etc. of Asahi Group Holdings, Ltd for the years 2017 to 2018. Download it immediately and use it for your business.
-
 3 part slide for business approval and statistics
Presenting our set of slides with name 3 Part Slide For Business Approval And Statistics. This exhibits information on three stages of the process. This is an easy to edit and innovatively designed PowerPoint template. So download immediately and highlight information on 3 Part Slide, Business Approval, Statistics.


