Powerpoint Templates and Google slides for Business Revenues
Save Your Time and attract your audience with our fully editable PPT Templates and Slides.
-
 Business long term goals with revenue growth and manpower expansion
Presenting this set of slides with name Business Long Term Goals With Revenue Growth And Manpower Expansion. This is a five stage process. The stages in this process are Long Term Goals, Business, Magnifying Glass. This is a completely editable PowerPoint presentation and is available for immediate download. Download now and impress your audience.
-
 Revenue by business line powerpoint slide designs download
Presenting revenue by business line powerpoint slide designs download. This is a revenue by business line powerpoint slide designs download. This is a four stage process. The stages in this process are business, management, marketing, revenue, growth.
-
 Revenue by business line powerpoint slide influencers
Presenting revenue by business line powerpoint slide influencers. This is a revenue by business line powerpoint slide influencers. This is a four stage process. The stages in this process are business, management, marketing, revenue, influencers.
-
 Revenue by business line ppt example file
Presenting revenue by business line ppt example file. This is a revenue by business line ppt example file. This is a four stage process. The stages in this process are business, management, marketing, revenue, strategy.
-
 Revenue by business line ppt inspiration
Presenting revenue by business line ppt inspiration. This is a revenue by business line ppt inspiration. This is a four stage process. The stages in this process are business, management, marketing, revenue, inspiration.
-
 Revenue by business line ppt presentation
Presenting revenue by business line ppt presentation. This is a revenue by business line ppt presentation. This is a four stage process. The stages in this process are business, management, marketing, revenue, presentation.
-
 Revenue by business line presentation portfolio
Presenting revenue by business line presentation portfolio. This is a revenue by business line presentation portfolio. This is a four stage process. The stages in this process are business, management, marketing, revenue, portfolio.
-
 Volkswagen ag sales revenue by market and business area 2018
This is a professionally designed visual chart for Volkswagen Ag Sales Revenue By Market And Business Area 2018. This is part of our Data and Statistics products selection, and you will need a Paid account to download the actual report with accurate data and sources. Downloaded report will contain the editable graph with accurate data, an excel table with the actual data, the exact source of the data and the release date. This slide provides a pie chart of Sales Revenue in percent by Market and Business Area of the company Volkswagen AG for the year 2018. Download it immediately and use it for your business.
-
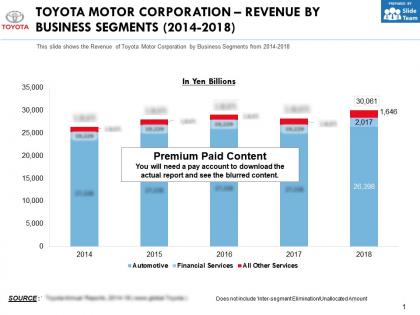 Toyota motor corporation revenue by business segments 2014-2018
This is a professionally designed visual chart for Toyota Motor Corporation Revenue By Business Segments 2014 to 2018. This is part of our Data and Statistics products selection, and you will need a Paid account to download the actual report with accurate data and sources. Downloaded report will contain the editable graph with accurate data, an excel table with the actual data, the exact source of the data and the release date. This slide shows the Revenue of Toyota Motor Corporation by Business Segments from 2014 to 2018. Download it immediately and use it for your business.
-
 Danone revenue by business segments 2016-2018
This is a professionally designed visual chart for Danone Revenue By Business Segments 2016 to 2018. This is part of our Data and Statistics products selection, and you will need a Paid account to download the actual report with accurate data and sources. Downloaded report will contain the editable graph with accurate data, an excel table with the actual data, the exact source of the data and the release date. This slide shows the revenue in JPY Bn of segments EDP International, EDP Noram, Specialized Nutrition, and waters of Danone S.A for the years 2016 to 2018. Download it immediately and use it for your business.
-
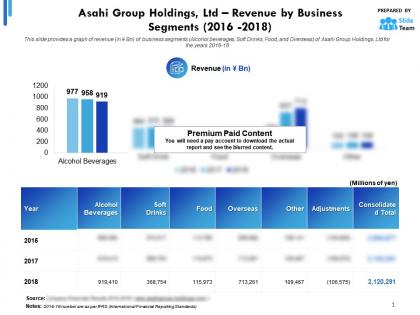 Asahi group holdings ltd revenue by business segments 2016-2018
This is a professionally designed visual chart for Asahi Group Holdings Ltd Revenue By Business Segments 2016 to 2018. This is part of our Data and Statistics products selection, and you will need a Paid account to download the actual report with accurate data and sources. Downloaded report will contain the editable graph with accurate data, an excel table with the actual data, the exact source of the data and the release date. This slide provides a graph of revenue in JPY Bn of business segments Alcohol beverages, Soft Drinks, Food and Overseas of Asahi Group Holdings, Ltd for the years 2016 to 18. Download it immediately and use it for your business.
-
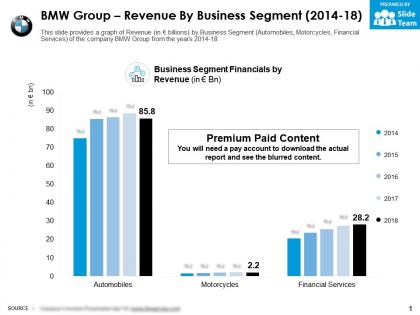 Bmw group revenue by business segment 2014-18
This is a professionally designed visual chart for BMW Group Revenue By Business Segment 2014 to 18. This is part of our Data and Statistics products selection, and you will need a Paid account to download the actual report with accurate data and sources. Downloaded report will contain the editable graph with accurate data, an excel table with the actual data, the exact source of the data and the release date. This slide provides a graph of Revenue in JPY billions by Business Segment Automobiles, Motorcycles, Financial Services of the company BMW Group from the years 2014 to 18 . Download it immediately and use it for your business.
-
 Honda motor co ltd automobile business revenue 2014-2018
This is a professionally designed visual chart for Honda Motor Co Ltd Automobile Business Revenue 2014 to 2018. This is part of our Data and Statistics products selection, and you will need a Paid account to download the actual report with accurate data and sources. Downloaded report will contain the editable graph with accurate data, an excel table with the actual data, the exact source of the data and the release date. This slide shows the Automobile Business Revenue of Honda company from 2014 to 2018 In billions JPY. Download it immediately and use it for your business.
-
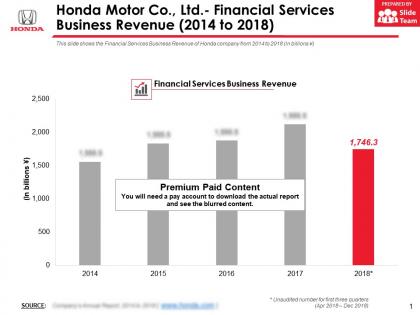 Honda motor co ltd financial services business revenue 2014-2018
This is a professionally designed visual chart for Honda Motor Co Ltd Financial Services Business Revenue 2014 to 2018. This is part of our Data and Statistics products selection, and you will need a Paid account to download the actual report with accurate data and sources. Downloaded report will contain the editable graph with accurate data, an excel table with the actual data, the exact source of the data and the release date. This slide shows the Financial Services Business Revenue of Honda company from 2014 to 2018 In billions JPY. Download it immediately and use it for your business.
-
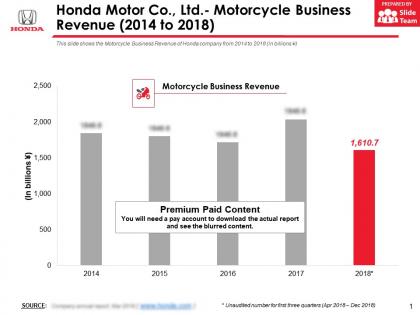 Honda motor co ltd motorcycle business revenue 2014-2018
This is a professionally designed visual chart for Honda Motor Co Ltd Motorcycle Business Revenue 2014 to 2018. This is part of our Data and Statistics products selection, and you will need a Paid account to download the actual report with accurate data and sources. Downloaded report will contain the editable graph with accurate data, an excel table with the actual data, the exact source of the data and the release date. This slide shows the Motorcycle Business Revenue of Honda company from 2014 to 2018 In billions JPY. Download it immediately and use it for your business.
-
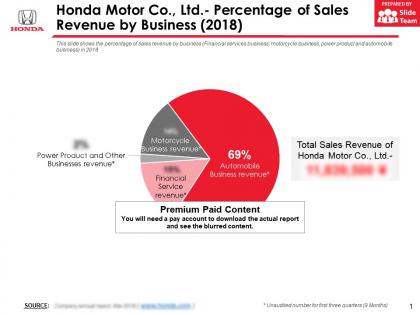 Honda motor co ltd percentage of sales revenue by business 2018
This is a professionally designed visual chart for Honda Motor Co Ltd Percentage Of Sales Revenue By Business 2018. This is part of our Data and Statistics products selection, and you will need a Paid account to download the actual report with accurate data and sources. Downloaded report will contain the editable graph with accurate data, an excel table with the actual data, the exact source of the data and the release date. This slide shows the percentage of sales revenue by business Financial services business, motorcycle business, power product and automobile business in 2018. Download it immediately and use it for your business.
-
 Honda motor co ltd power product and other businesses revenue 2014-2018
This is a professionally designed visual chart for Honda Motor Co Ltd Power Product And Other Businesses Revenue 2014 to 2018. This is part of our Data and Statistics products selection, and you will need a Paid account to download the actual report with accurate data and sources. Downloaded report will contain the editable graph with accurate data, an excel table with the actual data, the exact source of the data and the release date. This slide shows the Power Product and Other Businesses Revenue of Honda company from 2014 to 2018 In billions JPY. Download it immediately and use it for your business.
-
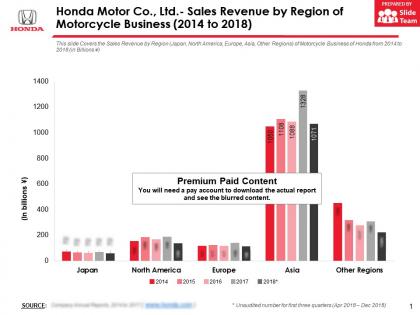 Honda motor co ltd sales revenue by region of motorcycle business 2014-2018
This is a professionally designed visual chart for Honda Motor Co Ltd Sales Revenue By Region Of Motorcycle Business 2014 to 2018. This is part of our Data and Statistics products selection, and you will need a Paid account to download the actual report with accurate data and sources. Downloaded report will contain the editable graph with accurate data, an excel table with the actual data, the exact source of the data and the release date. This slide Covers the Sales Revenue by Region Japan, North America, Europe, Asia, Other Regions of Motorcycle Business of Honda from 2014 to 2018 in Billions JPY. Download it immediately and use it for your business.
-
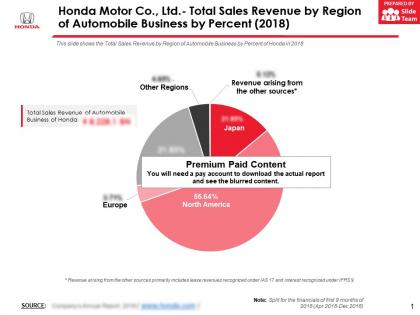 Honda motor co ltd total sales revenue by region of automobile business by percent 2018
This is a professionally designed visual chart for Honda Motor Co Ltd Total Sales Revenue By Region Of Automobile Business By Percent 2018. This is part of our Data and Statistics products selection, and you will need a Paid account to download the actual report with accurate data and sources. Downloaded report will contain the editable graph with accurate data, an excel table with the actual data, the exact source of the data and the release date. This slide shows the Total Sales Revenue by Region of Automobile Business by Percent of Honda in 2018. Download it immediately and use it for your business.
-
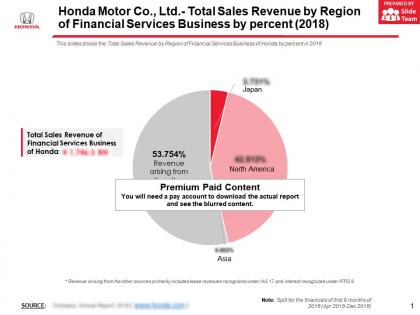 Honda motor co ltd total sales revenue by region of financial services business by percent 2018
This is a professionally designed visual chart for Honda Motor Co Ltd Total Sales Revenue By Region Of Financial Services Business By Percent 2018. This is part of our Data and Statistics products selection, and you will need a Paid account to download the actual report with accurate data and sources. Downloaded report will contain the editable graph with accurate data, an excel table with the actual data, the exact source of the data and the release date. This slides shows the Total Sales Revenue by Region of Financial Services Business of Honda by percent in 2018. Download it immediately and use it for your business.
-
 Honda motor co ltd total sales revenue by region of motorcycle business by percent 2018
This is a professionally designed visual chart for Honda Motor Co Ltd Total Sales Revenue By Region Of Motorcycle Business By Percent 2018. This is part of our Data and Statistics products selection, and you will need a Paid account to download the actual report with accurate data and sources. Downloaded report will contain the editable graph with accurate data, an excel table with the actual data, the exact source of the data and the release date. This slide shows the Total Sales Revenue by Region of Motorcycle Business by percent of Honda in 2018. Download it immediately and use it for your business.
-
 Honda motor co ltd total sales revenue by region of power product and other businesses by percent 2018
This is a professionally designed visual chart for Honda Motor Co Ltd Total Sales Revenue By Region Of Power Product And Other Businesses By Percent 2018. This is part of our Data and Statistics products selection, and you will need a Paid account to download the actual report with accurate data and sources. Downloaded report will contain the editable graph with accurate data, an excel table with the actual data, the exact source of the data and the release date. This slide shows the Total Sales Revenue by Region of Power Product and Other Businesses by Percent of Honda in 2018. Download it immediately and use it for your business.
-
 Microsoft corporation productivity and business processes segment revenue 2014-2018
This is a professionally designed visual chart for Microsoft Corporation Productivity And Business Processes Segment Revenue 2014 to 2018. This is part of our Data and Statistics products selection, and you will need a Paid account to download the actual report with accurate data and sources. Downloaded report will contain the editable graph with accurate data, an excel table with the actual data, the exact source of the data and the release date. This slide provides a graph of Productivity and Business Processes segment revenue in JPY MM of Microsoft Corporation for the years 2014 to 2018. Download it immediately and use it for your business.
-
 Amazon revenue by business segment 2014-2018
This is a professionally designed visual chart for Amazon Revenue By Business Segment 2014 to 2018. This is part of our Data and Statistics products selection, and you will need a Paid account to download the actual report with accurate data and sources. Downloaded report will contain the editable graph with accurate data, an excel table with the actual data, the exact source of the data and the release date. This slide provides a graph of revenue split in JPY MM by business segments North America, International and AWS of Amazon.Com Inc for the years 2014 to 2018. Download it immediately and use it for your business.
-
 Britvic plc percent of revenue share by business units 2018
This is a professionally designed visual chart for Britvic Plc Percent Of Revenue Share By Business Units 2018. This is part of our Data and Statistics products selection, and you will need a Paid account to download the actual report with accurate data and sources. Downloaded report will contain the editable graph with accurate data, an excel table with the actual data, the exact source of the data and the release date. This slide depicts a pie chart of percent of Revenue Share in JPY millions by Business Units Great Britain, France, Brazil, Ireland and International of the company Britvic PLC for the year 2018. . Download it immediately and use it for your business.
-
 Axa gross revenue by business segments 2016-18
This is a professionally designed visual chart for AXA Gross Revenue By Business Segments 2016 to 18. This is part of our Data and Statistics products selection, and you will need a Paid account to download the actual report with accurate data and sources. Downloaded report will contain the editable graph with accurate data, an excel table with the actual data, the exact source of the data and the release date. This slide provides a stack chart of Gross Revenue JPY millions by Business Segments France, Europe, Asia, AXA XL, US, International and Transversal and Central Holdings of the company AXA SA from the years 2016 to 18. Download it immediately and use it for your business.
-
 Axa health gross revenue by business segments 2016-18
This is a professionally designed visual chart for AXA Health Gross Revenue By Business Segments 2016 to 18. This is part of our Data and Statistics products selection, and you will need a Paid account to download the actual report with accurate data and sources. Downloaded report will contain the editable graph with accurate data, an excel table with the actual data, the exact source of the data and the release date. This slide provides a stack chart of Gross Revenue JPY millions by Business Segments France, Europe, Asia, US, International and Transversal and Central Holdings for the Health product service of the company AXA SA from the years 2016 to 18. Download it immediately and use it for your business.
-
 Axa life and savings gross revenue by business segments 2016-18
This is a professionally designed visual chart for AXA Life And Savings Gross Revenue By Business Segments 2016 to 18. This is part of our Data and Statistics products selection, and you will need a Paid account to download the actual report with accurate data and sources. Downloaded report will contain the editable graph with accurate data, an excel table with the actual data, the exact source of the data and the release date. This slide provides a stack chart of Gross Revenue JPY millions by Business Segments France, Europe, Asia, AXA XL, US, International and Transversal and Central Holdings for the Life and Savings product service of the company AXA SA from the years 2016 to 18. Download it immediately and use it for your business.
-
 Axa property and casualty gross revenue by business segments 2016-18
This is a professionally designed visual chart for AXA Property And Casualty Gross Revenue By Business Segments 2016 to 18. This is part of our Data and Statistics products selection, and you will need a Paid account to download the actual report with accurate data and sources. Downloaded report will contain the editable graph with accurate data, an excel table with the actual data, the exact source of the data and the release date. This slide provides a stack chart of Gross Revenue JPY millions by Business Segments France, Europe, Asia, AXA XL, International and Transversal and Central Holdings for the Property and Casualty product service of the company AXA SA from the years 2016 to 18. Download it immediately and use it for your business.
-
 Zurich insurance bop revenues by business segment 2016-18
This is a professionally designed visual chart for Zurich Insurance BOP Revenues By Business Segment 2016 to 18. This is part of our Data and Statistics products selection, and you will need a Paid account to download the actual report with accurate data and sources. Downloaded report will contain the editable graph with accurate data, an excel table with the actual data, the exact source of the data and the release date. This slide provides a stack chart of BOP Revenues and Policy Fees by Business Segment Property and Casualty, Life, Farmers, Group Functions and Operations and Non Core Businesses JPY millions of the company Zurich Insurance Group from the years 2016 to 18. Download it immediately and use it for your business.
-
 Asos plc revenue split by business segment 2014-2018
This is a professionally designed visual chart for ASOS PLC Revenue Split By Business Segment 2014 to 2018. This is part of our Data and Statistics products selection, and you will need a Paid account to download the actual report with accurate data and sources. Downloaded report will contain the editable graph with accurate data, an excel table with the actual data, the exact source of the data and the release date. This slide provides a graph of revenue split in JPY MM by business segments UK, EU, US and Row of ASOS PLC for the years 2014 to 2018. Download it immediately and use it for your business.
-
 Ibm corp global business services segments revenue split 2014-2018
This is a professionally designed visual chart for IBM Corp Global Business Services Segments Revenue Split 2014 to 2018. This is part of our Data and Statistics products selection, and you will need a Paid account to download the actual report with accurate data and sources. Downloaded report will contain the editable graph with accurate data, an excel table with the actual data, the exact source of the data and the release date. This slide provides a graph of Global Business Services Segment Revenue Split in JPY MM of IBM Corporation for the years 2014 to 2018. Download it immediately and use it for your business.
-
 Ibm corp revenue split by business segments 2014-2018
This is a professionally designed visual chart for IBM Corp Revenue Split By Business Segments 2014 to 2018. This is part of our Data and Statistics products selection, and you will need a Paid account to download the actual report with accurate data and sources. Downloaded report will contain the editable graph with accurate data, an excel table with the actual data, the exact source of the data and the release date. This slide provides a graph of revenue split in JPY MM by business segments Cognitive Solutions, Global Business Services, Technology Services and Cloud Platforms, Systems, Global Financing and Others of IBM Corporation for the years 2014 to 2018. Download it immediately and use it for your business.
-
 Suntory beverage and food limited sales revenue by business units 2014-18
This is a professionally designed visual chart for Suntory Beverage And Food Limited Sales Revenue By Business Units 2014 to 18. This is part of our Data and Statistics products selection, and you will need a Paid account to download the actual report with accurate data and sources. Downloaded report will contain the editable graph with accurate data, an excel table with the actual data, the exact source of the data and the release date. This slide provides a stack-chart of Sales Revenue in JPY millions by Business Units Japan Europe Asia Oceania and Americas of the company Suntory Beverage and Food Limited from the years 2014 to 18. Download it immediately and use it for your business.
-
 Unitedhealth group graph of revenue by business platform for five years 2014-18
This is a professionally designed visual chart for UnitedHealth Group Graph Of Revenue By Business Platform For Five Years 2014 to 18. This is part of our Data and Statistics products selection, and you will need a Paid account to download the actual report with accurate data and sources. Downloaded report will contain the editable graph with accurate data, an excel table with the actual data, the exact source of the data and the release date. This slide provides a stack chart of Revenue JPY millions by Business Platform UnitedHealthcare and Optum of the company UnitedHealth Group from the years 2014 to 18. Download it immediately and use it for your business.
-
 Unitedhealth group optum graph of revenue by business segments for five years 2014-18
This is a professionally designed visual chart for UnitedHealth Group Optum Graph Of Revenue By Business Segments For Five Years 2014 to 18. This is part of our Data and Statistics products selection, and you will need a Paid account to download the actual report with accurate data and sources. Downloaded report will contain the editable graph with accurate data, an excel table with the actual data, the exact source of the data and the release date. This slide provides a stack-chart of Optum Revenue JPY millions by Business Segments OptumHealth, OptumInsight and OptumRx of the company UnitedHealth Group from the years 2014 to 18. Download it immediately and use it for your business.
-
 Unitedhealth group uhc graph of revenue by business segments for five years 2014-18
This is a professionally designed visual chart for UnitedHealth Group UHC Graph Of Revenue By Business Segments For Five Years 2014 to 18. This is part of our Data and Statistics products selection, and you will need a Paid account to download the actual report with accurate data and sources. Downloaded report will contain the editable graph with accurate data, an excel table with the actual data, the exact source of the data and the release date. This slide provides a stack chart of UHC Revenue JPY millions by Business Segments Employer and Individual, Medicare and Retirement, Community and State and Global of the company UnitedHealth Group from the years 2014 to 18. Download it immediately and use it for your business.
-
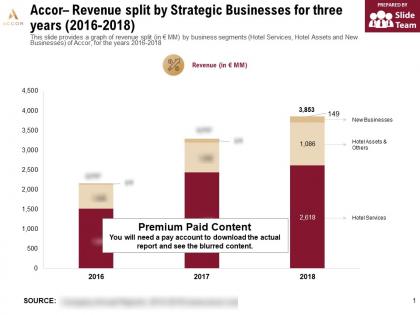 Accor revenue split by strategic businesses for three years 2016-2018
This is a professionally designed visual chart for Accor Revenue Split By Strategic Businesses For Three Years 2016 to 2018. This is part of our Data and Statistics products selection, and you will need a Paid account to download the actual report with accurate data and sources. Downloaded report will contain the editable graph with accurate data, an excel table with the actual data, the exact source of the data and the release date. This slide provides a graph of revenue split in JPY MM by business segments Hotel Services, Hotel Assets and New Businesses of Accor for the years 2016 to 2018. Download it immediately and use it for your business.
-
 Adm revenue split by business segment 2014-2018
This is a professionally designed visual chart for Adm Revenue Split By Business Segment 2014 to 2018. This is part of our Data and Statistics products selection, and you will need a Paid account to download the actual report with accurate data and sources. Downloaded report will contain the editable graph with accurate data, an excel table with the actual data, the exact source of the data and the release date. This slide provides a graph of revenue split in JPY MM by business segments Origination, Oilseeds, Carbohydrate Solutions, Nutrition and Others of Archer Daniels Midland Company for the years 2014 to 2018. Download it immediately and use it for your business.
-
 Anthem commercial and specialty segment business revenue split 2014-2018
This is a professionally designed visual chart for Anthem Commercial And Specialty Segment Business Revenue Split 2014 to 2018. This is part of our Data and Statistics products selection, and you will need a Paid account to download the actual report with accurate data and sources. Downloaded report will contain the editable graph with accurate data, an excel table with the actual data, the exact source of the data and the release date. This slide shows the Commercial and Specialty Segment Business Revenue Split of Anthem Inc. from 2014 to 2018 In Million JPY. Download it immediately and use it for your business.
-
 Anthem government business revenue split 2014-2018
This is a professionally designed visual chart for Anthem Government Business Revenue Split 2014 to 2018. This is part of our Data and Statistics products selection, and you will need a Paid account to download the actual report with accurate data and sources. Downloaded report will contain the editable graph with accurate data, an excel table with the actual data, the exact source of the data and the release date. This slide shows the Government Business Revenue Split of Anthem Inc. from 2014 to 2018 In Million JPY. Download it immediately and use it for your business.
-
 Akzo nobel revenue split by business segments 2014-2018
This is a professionally designed visual chart for Akzo Nobel Revenue Split By Business Segments 2014 to 2018. This is part of our Data and Statistics products selection, and you will need a Paid account to download the actual report with accurate data and sources. Downloaded report will contain the editable graph with accurate data, an excel table with the actual data, the exact source of the data and the release date. This slide provides a stack chart of Net Revenue Split by Business Segments Decorative Paints business, Specialty Chemicals business and Performance Coatings business in JPY MM of Akzo Nobel N.V. for the years 2014 to 2018. Download it immediately and use it for your business.
-
 Air france klm revenue split by business segment 2014-2018
This is a professionally designed visual chart for Air France KLM Revenue Split By Business Segment 2014 to 2018. This is part of our Data and Statistics products selection, and you will need a Paid account to download the actual report with accurate data and sources. Downloaded report will contain the editable graph with accurate data, an excel table with the actual data, the exact source of the data and the release date. This slide provides a graph of revenue split in JPY MM by business segments Network, Maintenance, Transavia and Others of Air France KLM Group for the years 2014 to 2018. Download it immediately and use it for your business.
-
 Activision blizzard revenue by business segments 2014-2018
This is a professionally designed visual chart for Activision Blizzard Revenue By Business Segments 2014 to 2018. This is part of our Data and Statistics products selection, and you will need a Paid account to download the actual report with accurate data and sources. Downloaded report will contain the editable graph with accurate data, an excel table with the actual data, the exact source of the data and the release date. This slide provides a stack chart of Net Revenue Split by Business Segments Activision, Blizzard, King and Other in JPY millions of Activision Blizzard Inc for the years 2014 to 2018. Download it immediately and use it for your business.
-
 Aeon operating revenue by business segments 2014-2018
This is a professionally designed visual chart for Aeon Operating Revenue By Business Segments 2014 to 2018. This is part of our Data and Statistics products selection, and you will need a Paid account to download the actual report with accurate data and sources. Downloaded report will contain the editable graph with accurate data, an excel table with the actual data, the exact source of the data and the release date. This slide provides a stack chart of Operating Revenue Split by Business Segments General Merchandise Store Business, Supermarket Business, Small-sized Business, Health and Wellness Drugstore and Pharmacy Business, Financial Services Business, Shopping Center Development Business, Services and Specialty Store Business, International Business and Others in JPY billions of Aeon Co. Ltd. for the years 2014 to 2018. Download it immediately and use it for your business.
-
 Acer inc revenue split of other businesses 2014-2018
This is a professionally designed visual chart for Acer Inc Revenue Split Of Other Businesses 2014 to 2018. This is part of our Data and Statistics products selection, and you will need a Paid account to download the actual report with accurate data and sources. Downloaded report will contain the editable graph with accurate data, an excel table with the actual data, the exact source of the data and the release date. This slide provides a graph of revenue split in NT JPY MM of Other Businesses of Acer Inc for the years 2014 to 2018. Download it immediately and use it for your business.
-
 In Home Care Business Plan Profit And Loss Account Statement Summary Of Revenue Cost BP SS
The slides provide a glimpse of the projected profit and loss statement to visualize the platforms financial performance for the next five years. The key components are total revenue from operations, gross profit, EBITDA, etc. Present the topic in a bit more detail with this In Home Care Business Plan Profit And Loss Account Statement Summary Of Revenue Cost BP SS. Use it as a tool for discussion and navigation on Profit And Loss Account Statement, Summary Of Revenue, Cost And Expenses, Revenue From Operations. This template is free to edit as deemed fit for your organization. Therefore download it now.
-
 Elderly Care Business Profit And Loss Account Statement Summary Of Revenue Cost And Expenses BP SS
The slides provide a glimpse of the projected profit and loss statement to visualize the platforms financial performance for the next five years. The key components are total revenue from operations, gross profit, EBITDA, etc. Deliver an outstanding presentation on the topic using this Elderly Care Business Profit And Loss Account Statement Summary Of Revenue Cost And Expenses BP SS. Dispense information and present a thorough explanation of Profit And Loss Account Statement, Summary Of Revenue, Cost And Expenses, Revenue From Operations using the slides given. This template can be altered and personalized to fit your needs. It is also available for immediate download. So grab it now.
-
 Daycare Business Plan Profit And Loss Account Statement Summary Of Revenue Cost And Expenses BP SS
The slides provide a glimpse of the projected profit and loss statement to visualize the platforms financial performance for the next five years. The key components are total revenue from operations, gross profit, EBITDA, etc. Deliver an outstanding presentation on the topic using this Daycare Business Plan Profit And Loss Account Statement Summary Of Revenue Cost And Expenses BP SS. Dispense information and present a thorough explanation of Profit And Loss Statement, Platforms Financial Performance, Revenue From Operations, Gross Profit using the slides given. This template can be altered and personalized to fit your needs. It is also available for immediate download. So grab it now.
-
 R62 Effective Go To Marketing Strategies To Increase Sales Volume And Revenue BBQ Business plan BP SS
The purpose of this slide is to implement an effective go to market strategy for bringing BBQ to an end customer taking into consideration elements like sales, positioning, and price. Introducing R62 Effective Go To Marketing Strategies To Increase Sales Volume And Revenue BBQ Business plan BP SS to increase your presentation threshold. Encompassed with six stages, this template is a great option to educate and entice your audience. Dispence information on Catering Services, Customer Loyalty Programs, Branding And Social Media Presence, using this template. Grab it now to reap its full benefits.
-
 Revenue forecast for your business ppt powerpoint presentation summary example file
The slide provides the revenue forecast of the company on the basis of number of subscribers estimation, average revenue per user and churn rate. Presenting this set of slides with name Revenue Forecast For Your Business Ppt Powerpoint Presentation Summary Example File. The topics discussed in these slides are Revenue Forecast, Average Revenue Per User, Starting Subscribers, Cancellations, Projected Lifetime. This is a completely editable PowerPoint presentation and is available for immediate download. Download now and impress your audience.
-
 Ecommerce business revenue models ppt powerpoint presentation styles slide download cpb
Presenting this set of slides with name Ecommerce Business Revenue Models Ppt Powerpoint Presentation Styles Slide Download Cpb. This is an editable Powerpoint four stages graphic that deals with topics like Ecommerce Business Revenue Models to help convey your message better graphically. This product is a premium product available for immediate download and is 100 percent editable in Powerpoint. Download this now and use it in your presentations to impress your audience.
-
 New business revenue ppt powerpoint presentation show portrait cpb
Presenting this set of slides with name New Business Revenue Ppt Powerpoint Presentation Show Portrait Cpb. This is an editable Powerpoint three stages graphic that deals with topics like New Business Revenue to help convey your message better graphically. This product is a premium product available for immediate download and is 100 percent editable in Powerpoint. Download this now and use it in your presentations to impress your audience.
-
 Recurring revenue businesses ppt powerpoint presentation model rules cpb
Presenting this set of slides with name Recurring Revenue Businesses Ppt Powerpoint Presentation Model Rules Cpb. This is an editable Powerpoint five stages graphic that deals with topics like Recurring Revenue Businesses to help convey your message better graphically. This product is a premium product available for immediate download and is 100 percent editable in Powerpoint. Download this now and use it in your presentations to impress your audience.
-
 Valuation business based revenue ppt powerpoint presentation summary designs download cpb
Presenting this set of slides with name Valuation Business Based Revenue Ppt Powerpoint Presentation Summary Designs Download Cpb. This is an editable Powerpoint four stages graphic that deals with topics like Valuation Business Based Revenue to help convey your message better graphically. This product is a premium product available for immediate download and is 100 percent editable in Powerpoint. Download this now and use it in your presentations to impress your audience.
-
 Business intelligence kpi metrics revenue ppt powerpoint presentation graphics
Presenting this set of slides with name Business Intelligence KPI Metrics Revenue Ppt Powerpoint Presentation Graphics. This is a four stage process. The stages in this process are Traffic Weekly, Trip, Distance, Clients, Revenue. This is a completely editable PowerPoint presentation and is available for immediate download. Download now and impress your audience.
-
 Revenue model online business ppt powerpoint presentation visual aids ideas cpb
Presenting this set of slides with name Revenue Model Online Business Ppt Powerpoint Presentation Visual Aids Ideas Cpb. This is an editable Powerpoint four stages graphic that deals with topics like Revenue Model Online Business to help convey your message better graphically. This product is a premium product available for immediate download and is 100 percent editable in Powerpoint. Download this now and use it in your presentations to impress your audience.
-
 Three rings for business revenue generation
Presenting this set of slides with name Three Rings For Business Revenue Generation. This is a three stage process. The stages in this process are Portfolio Management, Global Expansion, Innovation. This is a completely editable PowerPoint presentation and is available for immediate download. Download now and impress your audience.
-
 Dashboard with total revenue and net income of business
Presenting this set of slides with name Dashboard With Total Revenue And Net Income Of Business. The topics discussed in these slides are Dashboard, Total Revenue, Net Income, Business. This is a completely editable PowerPoint presentation and is available for immediate download. Download now and impress your audience.
-
 Monthly revenue and gross profit for business
Presenting this set of slides with name Monthly Revenue And Gross Profit For Business. The topics discussed in these slides are Monthly Revenue, Gross Profit, For Business. This is a completely editable PowerPoint presentation and is available for immediate download. Download now and impress your audience.


