Powerpoint Templates and Google slides for Business Performance Dashboard
Save Your Time and attract your audience with our fully editable PPT Templates and Slides.
-
 Indicators Business Growth Graph Performance Development Arrow Pressure Location Dashboard
This complete deck covers various topics and highlights important concepts. It has PPT slides which cater to your business needs. This complete deck presentation emphasizes Indicators Business Growth Graph Performance Development Arrow Pressure Location Dashboard and has templates with professional background images and relevant content. This deck consists of total of thirteen slides. Our designers have created customizable templates, keeping your convenience in mind. You can edit the colour, text and font size with ease. Not just this, you can also add or delete the content if needed. Get access to this fully editable complete presentation by clicking the download button below.
-
 Dashboard Icon Analysis Performance Indicators Informational Business
It covers all the important concepts and has relevant templates which cater to your business needs. This complete deck has PPT slides on Dashboard Icon Analysis Performance Indicators Informational Business with well suited graphics and subject driven content. This deck consists of total of twelve slides. All templates are completely editable for your convenience. You can change the colour, text and font size of these slides. You can add or delete the content as per your requirement. Get access to this professionally designed complete deck presentation by clicking the download button below.
-
 Performance Business Financial Appreciating Dashboard Exhibiting
It covers all the important concepts and has relevant templates which cater to your business needs. This complete deck has PPT slides on Performance Business Financial Appreciating Dashboard Exhibiting with well suited graphics and subject driven content. This deck consists of total of twelve slides. All templates are completely editable for your convenience. You can change the colour, text and font size of these slides. You can add or delete the content as per your requirement. Get access to this professionally designed complete deck presentation by clicking the download button below.
-
 Sales force effectiveness businesses analytics customer segmentation performance dashboard
Engage buyer personas and boost brand awareness by pitching yourself using this prefabricated set. This Sales Force Effectiveness Businesses Analytics Customer Segmentation Performance Dashboard is a great tool to connect with your audience as it contains high-quality content and graphics. This helps in conveying your thoughts in a well-structured manner. It also helps you attain a competitive advantage because of its unique design and aesthetics. In addition to this, you can use this PPT design to portray information and educate your audience on various topics. With twelve slides, this is a great design to use for your upcoming presentations. Not only is it cost-effective but also easily pliable depending on your needs and requirements. As such color, font, or any other design component can be altered. It is also available for immediate download in different formats such as PNG, JPG, etc. So, without any further ado, download it now.
-
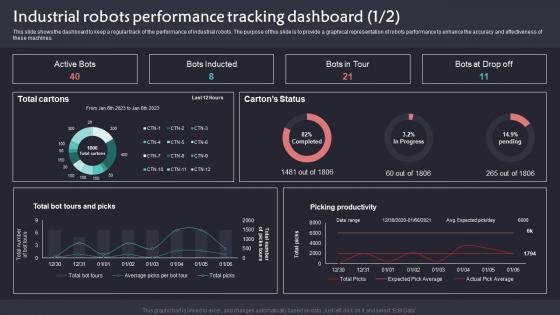 Industrial Robots Performance Tracking Dashboard Implementation Of Robotic Automation In Business
This slide shows the dashboard to keep a regular track of the performance of industrial robots. The purpose of this slide is to provide a graphical representation of robots performance to enhance the accuracy and effectiveness of these machines. Deliver an outstanding presentation on the topic using this Industrial Robots Performance Tracking Dashboard Implementation Of Robotic Automation In Business. Dispense information and present a thorough explanation of Total Cartons, Cartons Status using the slides given. This template can be altered and personalized to fit your needs. It is also available for immediate download. So grab it now.
-
 Defining product leadership strategies measuring business unit performance dashboard
This slide covers dashboard that shows business unit performance such as new customers, average weekly sales revenue, sales revenues, profits, customer lifetime value, etc. Deliver an outstanding presentation on the topic using this Defining Product Leadership Strategies Measuring Business Unit Performance Dashboard. Dispense information and present a thorough explanation of Business, Performance, Dashboard using the slides given. This template can be altered and personalized to fit your needs. It is also available for immediate download. So grab it now.
-
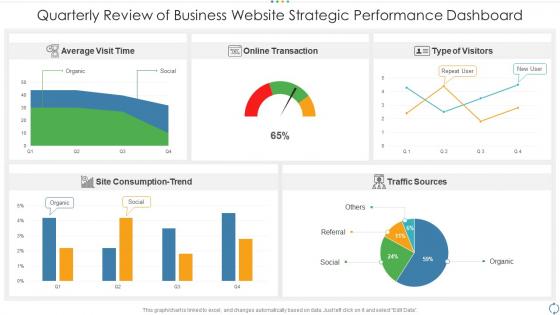 Quarterly review of business website strategic performance dashboard
Presenting our well structured Quarterly Review Of Business Website Strategic Performance Dashboard. The topics discussed in this slide are Average, Sources, Social. This is an instantly available PowerPoint presentation that can be edited conveniently. Download it right away and captivate your audience.
-
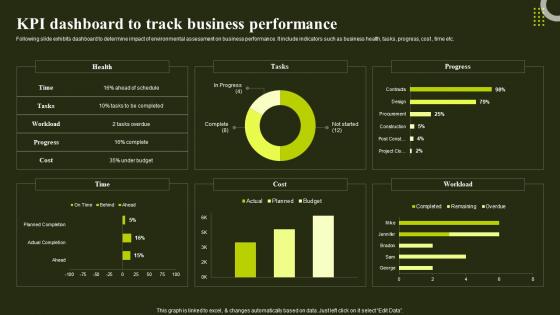 KPI Dashboard To Track Business Performance Environmental Analysis To Optimize
Following slide exhibits dashboard to determine impact of environmental assessment on business performance. It include indicators such as business health, tasks, progress, cost , time etc.Deliver an outstanding presentation on the topic using this KPI Dashboard To Track Business Performance Environmental Analysis To Optimize. Dispense information and present a thorough explanation of KPI Dashboard, Track Business Performance using the slides given. This template can be altered and personalized to fit your needs. It is also available for immediate download. So grab it now.
-
 Analyzing Cloud Kitchen Service Cloud Kitchen Business Performance Management Dashboard
This slide highlights a dashboard to track and manage performance progress of a dark kitchen business. It showcases components such as income, expense, order rate, activity, total order complete, total order delivered, total order cancelled, order pending and popular food. Present the topic in a bit more detail with this Analyzing Cloud Kitchen Service Cloud Kitchen Business Performance Management Dashboard Use it as a tool for discussion and navigation on Popular Food, Total Order Complete, Total Order Canceled This template is free to edit as deemed fit for your organization. Therefore download it now.
-
 Financial Performance Management With KPI Dashboard Enhancing Business Operations
The following slide highlights the impact of adopting enterprise resource planning ERP software on financial performance to measure its success. It includes key performance indicators such as gross profit margin, operating ratio, net profit margin, liquidity status etc. Deliver an outstanding presentation on the topic using this Financial Performance Management With KPI Dashboard Enhancing Business Operations. Dispense information and present a thorough explanation of Gross Sales, Income And Expenses, Financial Performance using the slides given. This template can be altered and personalized to fit your needs. It is also available for immediate download. So grab it now.
-
 KPI Dashboard To Track Business Performance Implementing Strategies For Business
Following slide exhibits dashboard to determine impact of environmental assessment on business performance. It include indicators such as business health, tasks, progress, cost , time etc.Present the topic in a bit more detail with this KPI Dashboard To Track Business Performance Implementing Strategies For Business. Use it as a tool for discussion and navigation on Kpi Dashboard, Track Business Performance, Product Demand. This template is free to edit as deemed fit for your organization. Therefore download it now.
-
 Deploying Techniques For Analyzing Kpi Dashboard To Track Business Performance
Following slide exhibits dashboard to determine impact of environmental assessment on business performance. It include indicators such as business health, tasks, progress, cost, time etc. Present the topic in a bit more detail with this Deploying Techniques For Analyzing Kpi Dashboard To Track Business Performance. Use it as a tool for discussion and navigation on Health, Tasks. This template is free to edit as deemed fit for your organization. Therefore download it now.
-
 Business Performance Dashboard To Trade Marketing Plan To Increase Market Share Strategy SS
This slide provides an overview of the dashboard depicting performance of the firm. It includes new customer, sales revenue, profit, average revenue, customer lifetime, acquisition cost, etc. Deliver an outstanding presentation on the topic using this Business Performance Dashboard To Trade Marketing Plan To Increase Market Share Strategy SS. Dispense information and present a thorough explanation of Business, Performance, Dashboard using the slides given. This template can be altered and personalized to fit your needs. It is also available for immediate download. So grab it now.
-
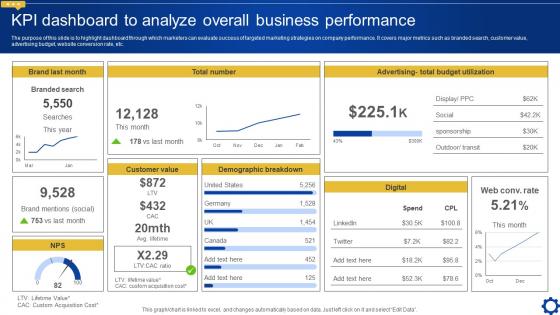 KPI Dashboard To Analyze Overall Business Performance Creating Personalized Marketing Messages MKT SS V
The purpose of this slide is to highlight dashboard through which marketers can evaluate success of targeted marketing strategies on company performance. It covers major metrics such as branded search, customer value, advertising budget, website conversion rate, etc. Present the topic in a bit more detail with this KPI Dashboard To Analyze Overall Business Performance Creating Personalized Marketing Messages MKT SS V. Use it as a tool for discussion and navigation on Customer Value, Demographic Breakdown. This template is free to edit as deemed fit for your organization. Therefore download it now.
-
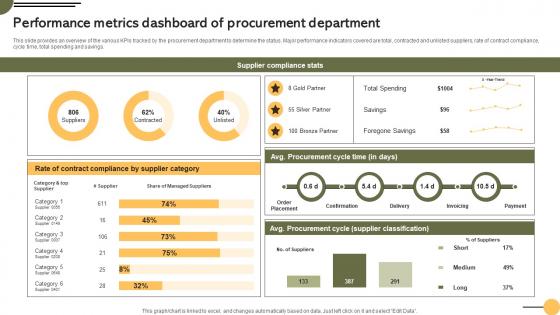 Performance Metrics Dashboard Achieving Business Goals Procurement Strategies Strategy SS V
This slide provides an overview of the various KPIs tracked by the procurement department to determine the status. Major performance indicators covered are total, contracted and unlisted suppliers, rate of contract compliance, cycle time, total spending and savings. Present the topic in a bit more detail with this Performance Metrics Dashboard Achieving Business Goals Procurement Strategies Strategy SS V. Use it as a tool for discussion and navigation on Performance, Procurement, Department. This template is free to edit as deemed fit for your organization. Therefore download it now.
-
 Dashboard To Track Linkedin Performance Metrics Of Business Profile
This slide shows the dashboard for monitoring LinkedIn performance KPIs of the company profile. The purpose of this slide is to help the business track the performance of it LinkedIn profile for increasing its online visibility. It includes elements such as viewers gained, engagement performance, etc. Introducing our Dashboard To Track Linkedin Performance Metrics Of Business Profile set of slides. The topics discussed in these slides are Viewers Gained, Engagement Performance, Viewers Categorized Industry. This is an immediately available PowerPoint presentation that can be conveniently customized. Download it and convince your audience.
-
 KPI Dashboard To Track Business Performance Understanding Factors Affecting
Following slide exhibits dashboard to determine impact of environmental assessment on business performance. It include indicators such as business health, tasks, progress, cost , time etc. Present the topic in a bit more detail with this KPI Dashboard To Track Business Performance Understanding Factors Affecting. Use it as a tool for discussion and navigation on Progress, Workload, Health, Business Performance. This template is free to edit as deemed fit for your organization. Therefore download it now.
-
 Quarterly Business Performance Review Dashboard
This slide highlights KPI dashboard for quarterly performance business review to track accomplishments of three quarter. It further includes customer signup in q1, customer signup in Q2, customer signup in Q3 etc. Introducing our Quarterly Business Performance Review Dashboard set of slides. The topics discussed in these slides are Business, Performance, Review. This is an immediately available PowerPoint presentation that can be conveniently customized. Download it and convince your audience.
-
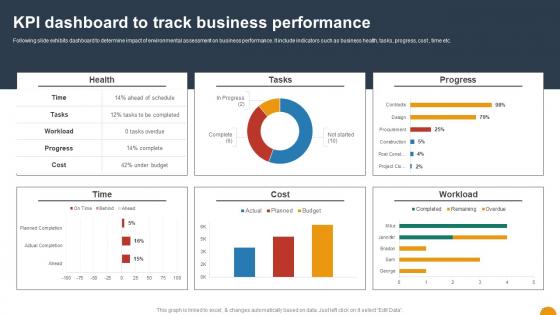 KPI Dashboard To Track Business Performance Using SWOT Analysis For Organizational
Following slide exhibits dashboard to determine impact of environmental assessment on business performance. It include indicators such as business health, tasks, progress, cost , time etc. Present the topic in a bit more detail with this KPI Dashboard To Track Business Performance Using SWOT Analysis For Organizational. Use it as a tool for discussion and navigation on Health, Tasks, Workload. This template is free to edit as deemed fit for your organization. Therefore download it now.
-
 Integrated Event Execution Dashboard For Optimizing Business Performance
This slide showcases dashboard for optimizing business performance. The main purpose of this slide is to track events that are approaching. This includes total revenue, passes, approaching events, passes sold, etc.Introducing our Integrated Event Execution Dashboard For Optimizing Business Performance set of slides. The topics discussed in these slides are Total Revenue, Jasslca William, Approaching Event. This is an immediately available PowerPoint presentation that can be conveniently customized. Download it and convince your audience.
-
 KPI Dashboard To Track Business Performance Environmental Scanning For Effective
Following slide exhibits dashboard to determine impact of environmental assessment on business performance. It include indicators such as business health, tasks, progress, cost , time etc.Deliver an outstanding presentation on the topic using this KPI Dashboard To Track Business Performance Environmental Scanning For Effective. Dispense information and present a thorough explanation of Changing Customer Preferences, Dynamic Environment, Example using the slides given. This template can be altered and personalized to fit your needs. It is also available for immediate download. So grab it now.
-
 Business Financial Savings KPI Dashboard To Evaluate Cash Performance
This slide showcases evaluating cash performance with business financial savings KPI dashboard. This slide includes savings, income and expenses vs their last year money and weekly savings per day for company. Introducing our Business Financial Savings KPI Dashboard To Evaluate Cash Performance set of slides. The topics discussed in these slides are Weekly Savings, Savings. This is an immediately available PowerPoint presentation that can be conveniently customized. Download it and convince your audience.
-
 KPI Dashboard To Assess Sales Performance Accelerating Business Digital Transformation DT SS
This slide covers KPI dashboard to analyze sales performance of retail store. It involves details such as total sales revenue, number of customers, average transaction price and average unit per customer. Deliver an outstanding presentation on the topic using this KPI Dashboard To Assess Sales Performance Accelerating Business Digital Transformation DT SS. Dispense information and present a thorough explanation of Revenue, Consumers, Transaction using the slides given. This template can be altered and personalized to fit your needs. It is also available for immediate download. So grab it now.
-
 KPI Dashboard To Evaluate Sales Performance Accelerating Business Growth Top Strategy SS V
The following slide outlines key performance indicator KPI dashboard to monitor sales performance of company. The key metrics covered in slide are total sales by location, monthly sales trend, average revenue AR by clients, etc. Present the topic in a bit more detail with this KPI Dashboard To Evaluate Sales Performance Accelerating Business Growth Top Strategy SS V. Use it as a tool for discussion and navigation on Sales Trend, Sales By Location, Actual Vs Budget. This template is free to edit as deemed fit for your organization. Therefore download it now.
-
 Performance Dashboard To Measure Marketing Accelerating Business Growth Top Strategy SS V
The following slide outlines key performance indicator KPI dashboard that can assist digital marketers to evaluate marketing campaign performance. The success metrics outlined in slide are total spend on advertisement, cost per thousand CPM, cost per click CPC, click-through rate CTR, etc. Deliver an outstanding presentation on the topic using this Performance Dashboard To Measure Marketing Accelerating Business Growth Top Strategy SS V. Dispense information and present a thorough explanation of Performance Dashboard, Measure Marketing using the slides given. This template can be altered and personalized to fit your needs. It is also available for immediate download. So grab it now.
-
 OKR Dashboard To Assess Business Performance Indicators
This slide depicts the OKR dashboard to evaluate the business performance indicators. The purpose of this slide is to help the business track its performance through measurement of indicators such as profitability rate, conversion rate, etc. Introducing our OKR Dashboard To Assess Business Performance Indicators set of slides. The topics discussed in these slides are Profitability Rate, Average Online, Conversion Rate Retail This is an immediately available PowerPoint presentation that can be conveniently customized. Download it and convince your audience.
-
 Performance Dashboard To Measure Business Growth Plan To Increase Strategy SS V
The following slide outlines key performance indicator KPI dashboard that can assist digital marketers to evaluate marketing campaign performance. The success metrics outlined in slide are total spend on advertisement, cost per thousand CPM, cost per click CPC, click through rate CTR, etc. Present the topic in a bit more detail with this Performance Dashboard To Measure Business Growth Plan To Increase Strategy SS V. Use it as a tool for discussion and navigation on Campaign, Performance, Marketing. This template is free to edit as deemed fit for your organization. Therefore download it now.
-
 Essential Guide To Database Marketing Kpi Dashboard To Analyze Overall Business Performance MKT SS V
The purpose of this slide is to highlight dashboard through which marketers can evaluate success of targeted marketing strategies on company performance. It covers major metrics such as branded search, customer value, advertising budget, website conversion rate, etc. Deliver an outstanding presentation on the topic using this Essential Guide To Database Marketing Kpi Dashboard To Analyze Overall Business Performance MKT SS V Dispense information and present a thorough explanation of Customer Value, Demographic Breakdown, Digital using the slides given. This template can be altered and personalized to fit your needs. It is also available for immediate download. So grab it now.
-
 KPI Dashboard To Analyze Overall Business Performance Database Marketing Techniques MKT SS V
The purpose of this slide is to highlight dashboard through which marketers can evaluate success of targeted marketing strategies on company performance. It covers major metrics such as branded search, customer value, advertising budget, website conversion rate, etc. Present the topic in a bit more detail with this KPI Dashboard To Analyze Overall Business Performance Database Marketing Techniques MKT SS V. Use it as a tool for discussion and navigation on Budget Utilization, Advertising, Demographic Breakdown, Customer Value. This template is free to edit as deemed fit for your organization. Therefore download it now.
-
 Performance Tracking Dashboard For Food Product And Beverage Business Strategic Food Packaging
The slide showcases dashboard representing food and beverage business performance tracking tool , which assist to evaluate monthly performance of employees, customer retention etc. Deliver an outstanding presentation on the topic using this Performance Tracking Dashboard For Food Product And Beverage Business Strategic Food Packaging Dispense information and present a thorough explanation of Beverage Industry, Business using the slides given. This template can be altered and personalized to fit your needs. It is also available for immediate download. So grab it now.
-
 Digital Marketing Techniques Business Performance Dashboard To Determine Strategy SS V
This slide provides an overview of the dashboard depicting performance of the firm. It includes new customer, sales revenue, profit, average revenue, customer lifetime, acquisition cost, etc. Deliver an outstanding presentation on the topic using this Digital Marketing Techniques Business Performance Dashboard To Determine Strategy SS V Dispense information and present a thorough explanation of Digital Marketing Techniques Business Performance Dashboard To Determine Strategy SS V using the slides given. This template can be altered and personalized to fit your needs. It is also available for immediate download. So grab it now.
-
 KPI Dashboard Measuring Business Transformation Performance
This slide showcases business transformation benefits with KPI dashboard. This slide includes forecasted benefits, deployed benefits, benefit in development, benefit pipeline and opportunities by stage. Introducing our KPI Dashboard Measuring Business Transformation Performance set of slides. The topics discussed in these slides are Forecasted Benefit, Benefit Deployed, Benefit In Development This is an immediately available PowerPoint presentation that can be conveniently customized. Download it and convince your audience.
-
 Dashboard To Track Performance Of AI Chatbots For Business Transforming Customer Support Function AI SS V
This slide showcases dashboard that can help organization to evaluate the performance of multiple chatbots. Its key elements are total bot conversations, bot sessions, engagement rate, bot escalation rate and chatbot metrics. Deliver an outstanding presentation on the topic using this Dashboard To Track Performance Of AI Chatbots For Business Transforming Customer Support Function AI SS V. Dispense information and present a thorough explanation of Bot Conversations, Conversations Deflected, Escalation Time using the slides given. This template can be altered and personalized to fit your needs. It is also available for immediate download. So grab it now.
-
 RCM Automation Dashboard To Track Business Performance
This slide highlights a performance dashboard to track RCM automation. The purpose of this slide is to highlight the major KPIs that need to be measured and analyzed for successful RCM automation. It includes RCM in progress, completed, failure modes, etc. Introducing our RCM Automation Dashboard To Track Business Performance set of slides. The topics discussed in these slides are Automation Dashboard, Track Business Performance. This is an immediately available PowerPoint presentation that can be conveniently customized. Download it and convince your audience.
-
 KPI Dashboard To Assess Business Work Performance
This slide represents business KPI dashboard to access work quality. This includes average time to fix defects, net promoter score, customer satisfaction, rework cost, safety meeting, customer complaints and site inspections. Introducing our KPI Dashboard To Assess Business Work Performance set of slides. The topics discussed in these slides are KPI Dashboard Assess, Business Work Performance, Safety Meeting, Customer Complaints. This is an immediately available PowerPoint presentation that can be conveniently customized. Download it and convince your audience.
-
 Dashboard To Monitor Employee Performance Complete Guide To Business Analytics Data Analytics SS
This slide showcases dashboard for tracking employee performance at workplace which helps in improving business revenue. It provides information regarding KPIs such as employee productivity, overall labor effectiveness, top employees by attendance, work done, project achievements etc. Deliver an outstanding presentation on the topic using this Dashboard To Monitor Employee Performance Complete Guide To Business Analytics Data Analytics SS. Dispense information and present a thorough explanation of Dashboard To Monitor Employee, Performance Post, Strategy Implementation using the slides given. This template can be altered and personalized to fit your needs. It is also available for immediate download. So grab it now.
-
 Dashboard To Track Business Financial Performance Complete Guide To Business Analytics Data Analytics SS
This slide showcases dashboard illustrating company financial performance which helps in analyzing revenue growth and identifying gaps. It provide information regarding KPIs such as gross profit margin, opex ratio, earning before interest and taxes, vendor payment error rate etc. Present the topic in a bit more detail with this Dashboard To Track Business Financial Performance Complete Guide To Business Analytics Data Analytics SS. Use it as a tool for discussion and navigation on Dashboard To Track Business, Financial Performance, Post Strategy Implementation. This template is free to edit as deemed fit for your organization. Therefore download it now.
-
 Sales Performance Tracking Dashboard Post Strateg Complete Guide To Business Analytics Data Analytics SS
This slide showcases dashboard for monitoring sales department performance post implementing improvement strategies based on data insights. It provides information regarding revenue generated, current sales pipeline value, sales opportunities, new deals, sales growth by market segment etc. Deliver an outstanding presentation on the topic using this Sales Performance Tracking Dashboard Post Strateg Complete Guide To Business Analytics Data Analytics SS. Dispense information and present a thorough explanation of Sales Performance Tracking, Dashboard Post, Strategy Implementation, Sales Opportunities using the slides given. This template can be altered and personalized to fit your needs. It is also available for immediate download. So grab it now.
-
 Trade Promotion Practices To Increase Business Performance Dashboard To Determine Growth Strategy SS V
This slide provides an overview of the dashboard depicting performance of the firm. It includes new customer, sales revenue, profit, average revenue, customer lifetime, acquisition cost, etc. Deliver an outstanding presentation on the topic using this Trade Promotion Practices To Increase Business Performance Dashboard To Determine Growth Strategy SS V. Dispense information and present a thorough explanation of Business Performance, Dashboard To Determine Growth, Customer Lifetime, Acquisition Cost using the slides given. This template can be altered and personalized to fit your needs. It is also available for immediate download. So grab it now.
-
 Business Performance Dashboard To Trade Promotion To Increase Brand Strategy SS V
This slide provides an overview of the dashboard depicting performance of the firm. It includes new customer, sales revenue, profit, average revenue, customer lifetime, acquisition cost, etc. Deliver an outstanding presentation on the topic using this Business Performance Dashboard To Trade Promotion To Increase Brand Strategy SS V. Dispense information and present a thorough explanation of Customer Lifetime Value, Customer Acquisition Cost, Average Revenue Per Unit using the slides given. This template can be altered and personalized to fit your needs. It is also available for immediate download. So grab it now.
-
 Lead Generation Strategies To Improve Lead Generation Dashboard To Monitor Business Performance SA SS
The purpose of this slide is to measure performance of company post-implementing lead generation strategies and take data-driven decisions accordingly. Deliver an outstanding presentation on the topic using this Lead Generation Strategies To Improve Lead Generation Dashboard To Monitor Business Performance SA SS. Dispense information and present a thorough explanation of Lead Generation Dashboard, Monitor Business Performance, Data Driven Decisions Accordingly using the slides given. This template can be altered and personalized to fit your needs. It is also available for immediate download. So grab it now.
-
 Financial Performance Dashboard For International Business Strategies For Exponential
This slide presents financial performance dashboard for international business monitoring and funds management. It includes metrics such as return on assets, working capital ratio, return on equity and debt equity ratio. Present the topic in a bit more detail with this Financial Performance Dashboard For International Business Strategies For Exponential. Use it as a tool for discussion and navigation on Return On Equity, Return On Assets, Working Capital Ratio. This template is free to edit as deemed fit for your organization. Therefore download it now.
-
 Sales Performance Dashboard For International Business Strategies For Exponential
This slide presents sales performance dashboard for international business, helpful in tracking target accomplishment and overall sales achieved. It includes metrics such as average revenue per unit, customer lifetime value, customer acquisition cost. Present the topic in a bit more detail with this Sales Performance Dashboard For International Business Strategies For Exponential. Use it as a tool for discussion and navigation on Average Revenue Per Unit, Customer Lifetime Value, Customer Acquisition Cost. This template is free to edit as deemed fit for your organization. Therefore download it now.
-
 Market Activity Plan To Improve Brand Dashboard To Analyze Marketing Performance Of Business
The following slide showcases dashboard for analyzing marketing performance of the business. It includes various KPIs such as conversions, website visits, traffic sources, etc. Deliver an outstanding presentation on the topic using this Market Activity Plan To Improve Brand Dashboard To Analyze Marketing Performance Of Business. Dispense information and present a thorough explanation of Dashboard To Analyze Marketing, Performance Of Business, Website Visits, Traffic Sources using the slides given. This template can be altered and personalized to fit your needs. It is also available for immediate download. So grab it now.
-
 Dashboard Performance Business Development Marketing Plan Services Amplifying Profitability CRP DK SS
The below slide illustrates a dashboard for measuring social media post performance by website traffic and revenue generated. Deliver an outstanding presentation on the topic using this Dashboard Performance Business Development Marketing Plan Services Amplifying Profitability CRP DK SS. Dispense information and present a thorough explanation of Dashboard, Performance, Social Media using the slides given. This template can be altered and personalized to fit your needs. It is also available for immediate download. So grab it now.
-
 KPI Dashboard To Track Business Sales Performance
This slide shows a dashboard that can be used by organizations to monitor sales performance from various channels. It includes various metrics such as total revenue, total profit, monthly sales revenue, cost breakup, etc. Presenting our well structured KPI Dashboard To Track Business Sales Performance. The topics discussed in this slide are Sales Number, Total Revenue, Total Profit. This is an instantly available PowerPoint presentation that can be edited conveniently. Download it right away and captivate your audience.
-
 Developing Freemium Business Churn Analytics Dashboard For Performance Evaluation
This slide presents churn analytics dashboard highlighting key segments of churn rate evaluation, helpful in making necessary strategic changes in plan and features. It includes churn by product, churn by country, credit scores to churn, churn by age, etc. Present the topic in a bit more detail with this Developing Freemium Business Churn Analytics Dashboard For Performance Evaluation. Use it as a tool for discussion and navigation on Churn Vs No Churn, Salary To Churn, Tenure To Churn, Balance To Churn. This template is free to edit as deemed fit for your organization. Therefore download it now.
-
 Financial Trend Business Analysis Dashboard Performance Product Comparison
Introduce your topic and host expert discussion sessions with this Financial Trend Business Analysis Dashboard Performance Product Comparison. This template is designed using high-quality visuals, images, graphics, etc, that can be used to showcase your expertise. Different topics can be tackled using the ten slides included in this template. You can present each topic on a different slide to help your audience interpret the information more effectively. Apart from this, this PPT slideshow is available in two screen sizes, standard and widescreen making its delivery more impactful. This will not only help in presenting a birds-eye view of the topic but also keep your audience engaged. Since this PPT slideshow utilizes well-researched content, it induces strategic thinking and helps you convey your message in the best possible manner. The biggest feature of this design is that it comes with a host of editable features like color, font, background, etc. So, grab it now to deliver a unique presentation every time.
-
 Dashboard Monitoring The Performance Of Various Compliance Effective Business Risk Strategy SS V
This slide outlines a training plan on workplace health and safety improvement. It includes training on equipment safety, chemical handling, emergency response and general safety. Deliver an outstanding presentation on the topic using this Dashboard Monitoring The Performance Of Various Compliance Effective Business Risk Strategy SS V. Dispense information and present a thorough explanation of Equipment Safety, Chemical Handling using the slides given. This template can be altered and personalized to fit your needs. It is also available for immediate download. So grab it now.
-
 OKR Dashboard To Track Quarterly Business Performance
This slide showcases the OKR dashboard to measure the quarterly business performance. The purpose of this slide is to help track the quarterly performance of business through quarterly objectives, owner of activities, deadlines set for tasks, etc. Presenting our well structured OKR Dashboard To Track Quarterly Business Performance The topics discussed in this slide are Grow Sales, Progress, Track Quarterly This is an instantly available PowerPoint presentation that can be edited conveniently. Download it right away and captivate your audience.
-
 Benefits Of Business Performance Management Dashboards
The following slide showcases advantages such as instant insights, efficiency, progress tracking, interactivity, intelligent reporting, and predictive capabilities in business performance management dashboards. They aid in informed decision-making, collaboration, and driving business evolution. Introducing our premium set of slides with Benefits Of Business Performance Management Dashboards. Ellicudate the one stages and present information using this PPT slide. This is a completely adaptable PowerPoint template design that can be used to interpret topics like Increased Efficiency, Instant Insights, Business Evolution, High Interactivity. So download instantly and tailor it with your information.
-
 ESG Sustainability Dashboard Icon To Measure Business Performance
Introducing our premium set of slides with name ESG Sustainability Dashboard Icon To Measure Business Performance. Ellicudate the Three stages and present information using this PPT slide. This is a completely adaptable PowerPoint template design that can be used to interpret topics like Esg Sustainability Dashboard Icon, Measure Business Performance. So download instantly and tailor it with your information.
-
 Product Sales Performance Dashboard For Retail Business
Presenting our well structured Product Sales Performance Dashboard For Retail Business. The topics discussed in this slide are Product Sales Performance, Dashboard, Retail Business. This is an instantly available PowerPoint presentation that can be edited conveniently. Download it right away and captivate your audience.
-
 Cash Flow Dashboard Business Sustainability Performance Indicators
Following slide covers cash flow dashboard covering details like beginning cash on hand, cash going in, cash going out, profit or loss and ending cash on hand. It also includes detail of accounts receivable and payable. Present the topic in a bit more detail with this Cash Flow Dashboard Business Sustainability Performance Indicators. Use it as a tool for discussion and navigation on Dashboard, Accounts Payable, Receivable. This template is free to edit as deemed fit for your organization. Therefore download it now.
-
 Customer Satisfaction Dashboard Business Sustainability Performance Indicators
Mentioned slide covers customer satisfaction dashboard with a 12 month format. It includes customer satisfaction details by region and by district. Present the topic in a bit more detail with this Customer Satisfaction Dashboard Business Sustainability Performance Indicators. Use it as a tool for discussion and navigation on Customer, Satisfaction, Dashboard. This template is free to edit as deemed fit for your organization. Therefore download it now.
-
 Customer Service Dashboard Business Sustainability Performance Indicators
Following slide illustrates customer service dashboard covering details such as request answered, total requests, total revenue and support cost revenue. It also includes customer satisfaction score, customer retention in a 12 months format. Deliver an outstanding presentation on the topic using this Customer Service Dashboard Business Sustainability Performance Indicators. Dispense information and present a thorough explanation of Customer, Service, Dashboard using the slides given. This template can be altered and personalized to fit your needs. It is also available for immediate download. So grab it now.
-
 Cash Flow Dashboard Kpis To Assess Business Performance Ppt Show Graphics Download
Following slide covers cash flow dashboard covering details like beginning cash on hand, cash going in, cash going out, profit or loss and ending cash on hand. It also includes detail of accounts receivable and payable. Present the topic in a bit more detail with this Cash Flow Dashboard Kpis To Assess Business Performance Ppt Show Graphics Download. Use it as a tool for discussion and navigation on Dashboard, Accounts, Receivable. This template is free to edit as deemed fit for your organization. Therefore download it now.
-
 Customer Satisfaction Dashboard Snapshot Kpis To Assess Business Performance
Mentioned slide covers customer satisfaction dashboard with a 12-month format. It includes customer satisfaction details by region and by district. Present the topic in a bit more detail with this Customer Satisfaction Dashboard Snapshot Kpis To Assess Business Performance. Use it as a tool for discussion and navigation on Customer, Satisfaction, Dashboard. This template is free to edit as deemed fit for your organization. Therefore download it now.
-
 Customer Service Dashboard Snapshot Kpis To Assess Business Performance
Following slide illustrates customer service dashboard covering details such as request answered, total requests, total revenue and support cost revenue. It also includes customer satisfaction score, customer retention in a 12 months format. Deliver an outstanding presentation on the topic using this Customer Service Dashboard Snapshot Kpis To Assess Business Performance. Dispense information and present a thorough explanation of Customer, Service, Dashboard using the slides given. This template can be altered and personalized to fit your needs. It is also available for immediate download. So grab it now.
-
 Cash Flow Dashboard Measuring Business Performance Using Kpis
Following slide covers cash flow dashboard covering details like beginning cash on hand, cash going in, cash going out, profit or loss and ending cash on hand. It also includes detail of accounts receivable and payable. Present the topic in a bit more detail with this Cash Flow Dashboard Measuring Business Performance Using Kpis. Use it as a tool for discussion and navigation on Dashboard, Accounts, Receivable. This template is free to edit as deemed fit for your organization. Therefore download it now.


