Powerpoint Templates and Google slides for Business Operations Dashboard
Save Your Time and attract your audience with our fully editable PPT Templates and Slides.
-
 Operations Dashboard Business Strength Documents Restaurants
Deliver a credible and compelling presentation by deploying this Operations Dashboard Business Strength Documents Restaurants. Intensify your message with the right graphics, images, icons, etc. presented in this complete deck. This PPT template is a great starting point to convey your messages and build a good collaboration. The twelve slides added to this PowerPoint slideshow helps you present a thorough explanation of the topic. You can use it to study and present various kinds of information in the form of stats, figures, data charts, and many more. This Operations Dashboard Business Strength Documents Restaurants PPT slideshow is available for use in standard and widescreen aspects ratios. So, you can use it as per your convenience. Apart from this, it can be downloaded in PNG, JPG, and PDF formats, all completely editable and modifiable. The most profound feature of this PPT design is that it is fully compatible with Google Slides making it suitable for every industry and business domain.
-
 Financial Performance Management With KPI Dashboard Enhancing Business Operations
The following slide highlights the impact of adopting enterprise resource planning ERP software on financial performance to measure its success. It includes key performance indicators such as gross profit margin, operating ratio, net profit margin, liquidity status etc. Deliver an outstanding presentation on the topic using this Financial Performance Management With KPI Dashboard Enhancing Business Operations. Dispense information and present a thorough explanation of Gross Sales, Income And Expenses, Financial Performance using the slides given. This template can be altered and personalized to fit your needs. It is also available for immediate download. So grab it now.
-
 Supplier And Vendor Management KPI Dashboard Enhancing Business Operations
The following slide showcases the key performance indicators KPIs to track vendor performance post ERP implementation. It mainly includes elements such as rejection rate, ordered value, number of suppliers, purchase in tie and budget etc. Deliver an outstanding presentation on the topic using this Supplier And Vendor Management KPI Dashboard Enhancing Business Operations. Dispense information and present a thorough explanation of Vendor Rejection Rate, Spend Under Management, Purchase In Time And Budget using the slides given. This template can be altered and personalized to fit your needs. It is also available for immediate download. So grab it now.
-
 Business Intelligence Dashboard For Tracking Operating Environment
This slide represents KPI dashboard of operating environment for monitoring business metrics and data points related to business unit. It includes metrics such as study artifacts, notification box, flow diagram, operations manager, etc. Presenting our well structured Business Intelligence Dashboard For Tracking Operating Environment. The topics discussed in this slide are Study Artifacts, Notification Box, Flow Diagram. This is an instantly available PowerPoint presentation that can be edited conveniently. Download it right away and captivate your audience.
-
 Smart Fleet Management Dashboard Showing Business Operations IOT Fleet Management IOT SS V
The following slide delineates smart fleet management dashboard through which fleet companies can take data-driven decisions in real-time. The major metrics mentioned in slide are distance travelled, over speeding, violation alert, idle, harsh breaking, etc. Deliver an outstanding presentation on the topic using this Smart Fleet Management Dashboard Showing Business Operations IOT Fleet Management IOT SS V. Dispense information and present a thorough explanation of Distance Travelled, Driver Scoreboard, Business Operations using the slides given. This template can be altered and personalized to fit your needs. It is also available for immediate download. So grab it now.
-
 Supplier Risk Management Dashboard For Business Operations
This slide illustrates KPI or dashboard of supplier risk management and includes active suppliers, suppliers in onboarding phase, open supplier findings, etc. Presenting our well structured Supplier Risk Management Dashboard For Business Operations The topics discussed in this slide are Open Supplier Findings, Total Supplier Spend. This is an instantly available PowerPoint presentation that can be edited conveniently. Download it right away and captivate your audience.
-
 Operation Reporting Dashboard For Healthcare Business
This slide depicts the operation reporting dashboard for medical and healthcare businesses. The purpose of this operation reporting dashboard is to help identify business efficiency in order to deliver high quality services. It includes elements such as real-time bed occupancy rates, number of patients, etc. Presenting our well structured Operation Reporting Dashboard For Healthcare Business. The topics discussed in this slide are Real Time Bed Occupancy Rate, Estimated Patient Turnover Rate, Patient Satisfaction Metrics. This is an instantly available PowerPoint presentation that can be edited conveniently. Download it right away and captivate your audience.
-
 Operation Reporting Dashboard To Track Retail Business Output
This slide depicts the operation reporting to track productivity of a retail business. The purpose of this slide is to track and monitor operation efficiency through the use of current business working capital, current business liabilities, current account status, etc. Presenting our well structured Operation Reporting Dashboard To Track Retail Business Output. The topics discussed in this slide are Current Account Stats, Yearly Cash Conversion Cycle, Current Business Liabilities. This is an instantly available PowerPoint presentation that can be edited conveniently. Download it right away and captivate your audience.
-
 Real Time Icon Business Analytics Dashboard Processing Operation Monitoring Location
It has PPT slides covering wide range of topics showcasing all the core areas of your business needs. This complete deck focuses on Real Time Icon Business Analytics Dashboard Processing Operation Monitoring Location and consists of professionally designed templates with suitable graphics and appropriate content. This deck has total of ten slides. Our designers have created customizable templates for your convenience. You can make the required changes in the templates like colour, text and font size. Other than this, content can be added or deleted from the slide as per the requirement. Get access to this professionally designed complete deck PPT presentation by clicking the download button below.
-
 Information Technology System Dashboard For Monitoring Business Operations
This slide shows information technology system dashboard for monitoring business operations which can be beneficial for making decisions for their growth. It contains information about learning, internal, finance or customers and users. Presenting our well structured Information Technology System Dashboard For Monitoring Business Operations. The topics discussed in this slide are Learning, Finance And Customers, Users. This is an instantly available PowerPoint presentation that can be edited conveniently. Download it right away and captivate your audience.
-
 Business Loan Operations Dashboard For Banks
This slide displays the dashboard for corporate loan operations management. It include KPIs such as open cases with service level agreements, average open cases by agents, open cases by age, proposed exposure by risk rating, etc. Introducing our Business Loan Operations Dashboard For Banks set of slides. The topics discussed in these slides are Business Loan Operations Dashboard For Banks. This is an immediately available PowerPoint presentation that can be conveniently customized. Download it and convince your audience.
-
 Financial Performance Tracking Dashboard Optimize Business Core Operations
This slide presents the dashboard which will help firm in tracking the financial performance. This dashboard displays number of customers, vendors and revenues generated, expenses and profit incurred. Present the topic in a bit more detail with this Financial Performance Tracking Dashboard Optimize Business Core Operations. Use it as a tool for discussion and navigation on Financial Performance Tracking Dashboard. This template is free to edit as deemed fit for your organization. Therefore download it now.
-
 Potential Prospect Management Dashboard Optimize Business Core Operations
The dashboard will provide overall scenario of all accounts and track new leads, top campaigns, expected revenue earned, etc. Present the topic in a bit more detail with this Potential Prospect Management Dashboard Optimize Business Core Operations. Use it as a tool for discussion and navigation on Potential Prospect Management Dashboard. This template is free to edit as deemed fit for your organization. Therefore download it now.
-
 Sales And Operations Dashboard For Ecommerce Business
This slide covers sales and operations dashboard for ecommerce business. It involves details such as total sales generated, number of brands, total revenue generated, number of units sold and gender and age range breakdown. Introducing our Sales And Operations Dashboard For Ecommerce Business set of slides. The topics discussed in these slides are Sales And Operations, Dashboard, Ecommerce Business. This is an immediately available PowerPoint presentation that can be conveniently customized. Download it and convince your audience.
-
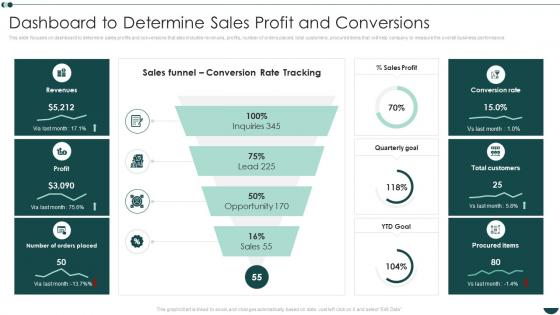 Business Process Reengineering Operational Efficiency Dashboard To Determine Sales Profit And Conversions
This slide focuses on dashboard to determine sales profits and conversions that also includes revenues, profits, number of orders placed, total customers, procured items that will help company to measure the overall business performance. Present the topic in a bit more detail with this Business Process Reengineering Operational Efficiency Dashboard To Determine Sales Profit And Conversions. Use it as a tool for discussion and navigation on Conversions, Dashboard, Revenues. This template is free to edit as deemed fit for your organization. Therefore download it now
-
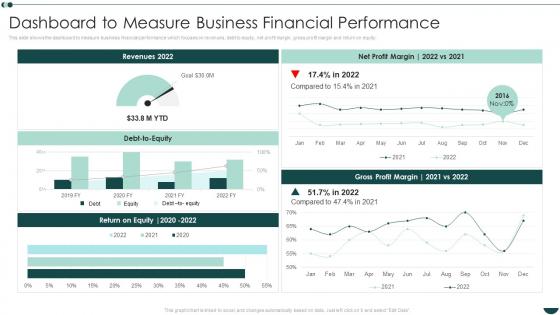 Dashboard To Measure Business Financial Performance Business Process Reengineering Operational Efficiency
This slide shows the dashboard to measure business financial performance which focuses on revenues, debt to equity, net profit margin, gross profit margin and return on equity. Deliver an outstanding presentation on the topic using this Dashboard To Measure Business Financial Performance Business Process Reengineering Operational Efficiency. Dispense information and present a thorough explanation of Business, Financial, Performance using the slides given. This template can be altered and personalized to fit your needs. It is also available for immediate download. So grab it now.
-
 Hr Talent Management Key Metrics Dashboard Snapshot Implementing Business Enhancing Hr Operation
This slide represents the KPI dashboard snapshot to track and monitor management of talent by the HR department. It includes details related to talent satisfaction, talent turnover rate, fired talents etc. Deliver an outstanding presentation on the topic using this Hr Talent Management Key Metrics Dashboard Implementing Business Enhancing Hr Operation. Dispense information and present a thorough explanation of Management, Dashboard, Satisfaction using the slides given. This template can be altered and personalized to fit your needs. It is also available for immediate download. So grab it now.
-
 Implementing Business Enhancing Hr Operation Employee Engagement Key Performance Metrics Dashboard
This slide represents key metrics dashboard to analyze the engagement of employees in the organization. It includes details related to KPIs such as engagement score, response rate, net promoter score etc. Deliver an outstanding presentation on the topic using this Implementing Business Enhancing Hr Operation Employee Engagement Key Performance Metrics Dashboard. Dispense information and present a thorough explanation of Performance, Dashboard, Engagement using the slides given. This template can be altered and personalized to fit your needs. It is also available for immediate download. So grab it now.
-
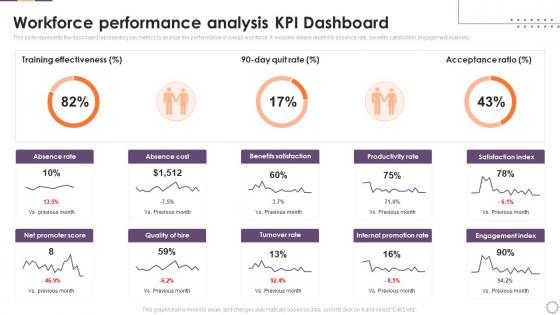 Implementing Business Enhancing Hr Operation Workforce Performance Analysis Kpi Dashboard
This slide represents the dashboard representing key metrics to analyze the performance of overall workforce. It includes details related to absence rate, benefits satisfaction, engagement index etc. Deliver an outstanding presentation on the topic using this Implementing Business Enhancing Hr Operation Workforce Performance Analysis Kpi Dashboard. Dispense information and present a thorough explanation of Workforce, Performance, Analysis using the slides given. This template can be altered and personalized to fit your needs. It is also available for immediate download. So grab it now.
-
 Key Business Metrics Dashboard Blueprint To Optimize Business Operations And Increase Revenues
The following dashboard displays the key business metrics such as new customers, profit, revenue per customer, and weekly revenue. Deliver an outstanding presentation on the topic using this Key Business Metrics Dashboard Blueprint To Optimize Business Operations And Increase Revenues. Dispense information and present a thorough explanation of Business, Dashboard, Revenue using the slides given. This template can be altered and personalized to fit your needs. It is also available for immediate download. So grab it now.
-
 Sales Operation E Commerce Business Dashboard
This slide showcase sales and operations dashboard for e commerce business. It involves total sales, total orders, profit and loss statement, average product value, sales by reference, sales by reference that help in tracking growth of product in market and also for analyzing organization market share. Presenting our well structured Sales Operation E Commerce Business Dashboard. The topics discussed in this slide are Sales By Location, Product Value, Business Dashboard. This is an instantly available PowerPoint presentation that can be edited conveniently. Download it right away and captivate your audience.
-
 Dashboard For Business Operational Activities Management
This slide represents dashboard for management of business operational activities. It includes marketing, product, human resource, sales, finance, services and support. Presenting our well structured Dashboard For Business Operational Activities Management. The topics discussed in this slide are Dashboard, Business Operational, Activities Management. This is an instantly available PowerPoint presentation that can be edited conveniently. Download it right away and captivate your audience.
-
 Dashboard Depicting Business Operations Metrics
This slide exhibits business operations dashboard to track progress on monthly basis. It covers revenue by source, monthly sign ups, top performing support agents, monthly visits etc. Introducing our Dashboard Depicting Business Operations Metrics set of slides. The topics discussed in these slides are Dashboard Depicting, Business Operations Metrics. This is an immediately available PowerPoint presentation that can be conveniently customized. Download it and convince your audience.
-
 Dashboard To Track Client Onboarding Operations Business Process Management System
This slide covers dashboard to track customer onboarding report of a company. The purpose of this slide is to provide employee wise report of signing up customers. It includes elements such as list of customers awaiting onboarding, paying customers along with package details and other important analytics. Deliver an outstanding presentation on the topic using this Dashboard To Track Client Onboarding Operations Business Process Management System. Dispense information and present a thorough explanation of Dashboard, Operations, Analytics using the slides given. This template can be altered and personalized to fit your needs. It is also available for immediate download. So grab it now.
-
 Achieving Operational Excellence In Retail KPI Dashboard For Retail Business Ppt Icon Images
This slide portrays key performance dashboard for measuring retail business performance. KPIs covered in the dashboards are average shopping time, shop visitors, average basket spend and customer retention. Deliver an outstanding presentation on the topic using this Achieving Operational Excellence In Retail KPI Dashboard For Retail Business Ppt Icon Images. Dispense information and present a thorough explanation of Customer Retention, Shopper Visitors, Shopping Time using the slides given. This template can be altered and personalized to fit your needs. It is also available for immediate download. So grab it now.
-
 KPI Dashboard For Retail Business Efficient Management Retail Store Operations
This slide portrays key performance dashboard for measuring retail business performance. Kpis covered in the dashboards are average shopping time, shop visitors, average basket spend and customer retention. Present the topic in a bit more detail with this KPI Dashboard For Retail Business Efficient Management Retail Store Operations. Use it as a tool for discussion and navigation on Shopper Visitors, Customer Retention, Returns By Values. This template is free to edit as deemed fit for your organization. Therefore download it now.
-
 Dashboard For Measuring Customer Satisfaction Managing Retail Business Operations
Mentioned slide illustrates customer satisfaction dashboard. It includes information about net promoter score, customer retention rate and customer effort score. Present the topic in a bit more detail with this Dashboard For Measuring Customer Satisfaction Managing Retail Business Operations. Use it as a tool for discussion and navigation on Promoter Score, Customer Retention, Customer Effort. This template is free to edit as deemed fit for your organization. Therefore download it now.
-
 KPI Dashboard For Retail Business Managing Retail Business Operations Ppt Rules
This slide portrays key performance dashboard for measuring retail business performance. KPIs covered in the dashboards are average shopping time, shop visitors, average basket spend and customer retention. Deliver an outstanding presentation on the topic using this KPI Dashboard For Retail Business Managing Retail Business Operations Ppt Rules. Dispense information and present a thorough explanation of Shopper Visitors, Gross Sales, Retail Business using the slides given. This template can be altered and personalized to fit your needs. It is also available for immediate download. So grab it now.
-
 Retail Store Performance Analysis Dashboard Managing Retail Business Operations
Mentioned slide displays a dashboard to assess retail store performance. Metrics included in the dashboard are net sales, average unit in retail, average basket size, sales volume by store and total visitors count. Present the topic in a bit more detail with this Retail Store Performance Analysis Dashboard Managing Retail Business Operations. Use it as a tool for discussion and navigation on Revenue, Store Performance, Analysis Dashboard. This template is free to edit as deemed fit for your organization. Therefore download it now.
-
 KPI Dashboard For Retail Business Optimizing Retail Operations By Efficiently Handling Inventories
This slide portrays key performance dashboard for measuring retail business performance. KPIs covered in the dashboards are average shopping time, shop visitors, average basket spend and customer retention. Deliver an outstanding presentation on the topic using this KPI Dashboard For Retail Business Optimizing Retail Operations By Efficiently Handling Inventories. Dispense information and present a thorough explanation of Retail, Average, Customer using the slides given. This template can be altered and personalized to fit your needs. It is also available for immediate download. So grab it now.
-
 Business Operations Performance Analysis Dashboard
This slide presents a dashboard to analyze and monitor business operational activities and gain insights of functional performance. It includes key components such as revenue, sigh ups, visitors, revenue by source, monthly sign ups, top performing agents, etc. Introducing our Business Operations Performance Analysis Dashboard set of slides. The topics discussed in these slides are Monthly Visitors, Top Performing, Support Agents. This is an immediately available PowerPoint presentation that can be conveniently customized. Download it and convince your audience.
-
 Dashboard For Aligning Business Outcomes With RPA Operations
This slide showcases KPI for measuring, quantifying visualising ways to drive RPA in business. This template focuses on align automated operations with strategic business outcomes. It includes information related to success rate, robot productivity, etc.Introducing our Dashboard For Aligning Business Outcomes With RPA Operations set of slides. The topics discussed in these slides are Result Distribution, Average Execution, Results Distribution . This is an immediately available PowerPoint presentation that can be conveniently customized. Download it and convince your audience.
-
 Business Deposit Financial Operations Dashboard
The slides showcase a financial deposit dashboard that helps in visualizing, tracking, and reporting financial KPIs in finance and accounting. The elements include open cases, SLA breaches, average closing times, trends, weekly trends, etc. with their key insights. Presenting our well structured Business Deposit Financial Operations Dashboard. The topics discussed in this slide are Business Deposit Financial, Operations Dashboard. This is an instantly available PowerPoint presentation that can be edited conveniently. Download it right away and captivate your audience.
-
 Business Hazard Analysis Process Dashboard For Operational Departments
This slide depicts outcomes and impact of hazards on different operational departments. It includes hazard map, risk identification chart, business hazard graph and types of risk. Introducing our Business Hazard Analysis Process Dashboard For Operational Departments set of slides. The topics discussed in these slides are Business, Analysis, Departments. This is an immediately available PowerPoint presentation that can be conveniently customized. Download it and convince your audience.
-
 Dashboard Icon For Operational Risk Assessment Of Digital Business
Introducing our Dashboard Icon For Operational Risk Assessment Of Digital Business set of slides. The topics discussed in these slides are Dashboard Icon For Operational Risk Assessment Of Digital Business. This is an immediately available PowerPoint presentation that can be conveniently customized. Download it and convince your audience.
-
 Business Operations Metrics Dashboard Icon
Presenting our set of slides with name Business Operations Metrics Dashboard Icon. This exhibits information on three stages of the process. This is an easy to edit and innovatively designed PowerPoint template. So download immediately and highlight information on Business Operations, Metrics Dashboard Icon.
-
 Operations Dashboard Icon Representing Business Performance
Presenting our set of slides with name Operations Dashboard Icon Representing Business Performance. This exhibits information on three stages of the process. This is an easy to edit and innovatively designed PowerPoint template. So download immediately and highlight information on Operations Dashboard, Icon Representing Business Performance.
-
 Practice management business performance dashboards succession planning operational risk cpb
Presenting this set of slides with name - Practice Management Business Performance Dashboards Succession Planning Operational Risk Cpb. This is an editable five graphic that deals with topics like Practice Management, Business Performance Dashboards, Succession Planning, Operational Risk to help convey your message better graphically. This product is a premium product available for immediate download, and is 100 percent editable in Powerpoint. Download this now and use it in your presentations to impress your audience.
-
 Business operations dashboard ppt powerpoint presentation file gridlines
This slide shows dashboard for measuring business operations. It includes details of total production weekly average production, scrap and scrap average in each production line. It also covers daily production statistics production trend project summary events and distribution. Presenting this set of slides with name Business Operations Dashboard Ppt Powerpoint Presentation File Gridlines. The topics discussed in these slides are Business Operations Dashboard. This is a completely editable PowerPoint presentation and is available for immediate download. Download now and impress your audience.
-
 Dashboard Snapshot of business reporting on operation expenditure
Presenting this set of slides with name Dashboard Snapshot Of Business Reporting On Operation Expenditure. The topics discussed in these slides are Income Statement, Gross Profit, Sales, Marketing, OPEX. This is a completely editable PowerPoint presentation and is available for immediate download. Download now and impress your audience.
-
 Business statistics dashboard of finance operation
Presenting this set of slides with name Business Statistics Dashboard Of Finance Operation. The topics discussed in these slides are Operating, Profit, Margin. This is a completely editable PowerPoint presentation and is available for immediate download. Download now and impress your audience.
-
 Business operations dashboard production ppt pictures clipart images
This slide shows dashboard for measuring business operations. It includes details of total production weekly average production scrap and scrap average in each production line. It also covers daily production statistics production trend project summary events and distribution. Presenting this set of slides with name Business Operations Dashboard Production Ppt Pictures Clipart Images. The topics discussed in these slides are Production Trend, Daily Production, Production Summary, Distribution, Events. This is a completely editable PowerPoint presentation and is available for immediate download. Download now and impress your audience.
-
 Dashboard indicating graphs of multiple business operations
Presenting our set of slides with Dashboard Indicating Graphs Of Multiple Business Operations. This exhibits information on one stage of the process. This is an easy-to-edit and innovatively designed PowerPoint template. So download immediately and highlight information on Dashboard Indicating Graphs Of Multiple Business Operations.
-
 Business management dashboards achievement business operations management ppt formats
Present the topic in a bit more detail with this Business Management Dashboards Achievement Business Operations Management Ppt Formats. Use it as a tool for discussion and navigation on Business Management Dashboards. This template is free to edit as deemed fit for your organization. Therefore download it now.
-
 Business management dashboards customers business operations management ppt formats
Deliver an outstanding presentation on the topic using this Business Management Dashboards Customers Business Operations Management Ppt Formats. Dispense information and present a thorough explanation of Business Management Dashboards using the slides given. This template can be altered and personalized to fit your needs. It is also available for immediate download. So grab it now.
-
 Business management dashboards expenses business operations management ppt icons
Present the topic in a bit more detail with this Business Management Dashboards Expenses Business Operations Management Ppt Icons. Use it as a tool for discussion and navigation on Business Management Dashboards. This template is free to edit as deemed fit for your organization. Therefore download it now.
-
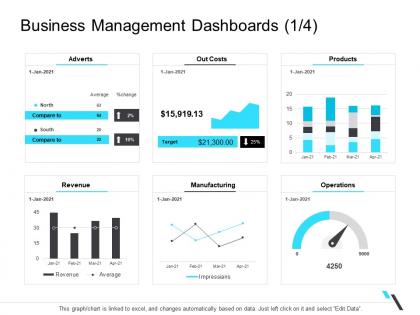 Business management dashboards manufacturing business operations management ppt summary
Deliver an outstanding presentation on the topic using this Business Management Dashboards Manufacturing Business Operations Management Ppt Summary. Dispense information and present a thorough explanation of Business Management Dashboards using the slides given. This template can be altered and personalized to fit your needs. It is also available for immediate download. So grab it now.
-
 Business reporting operation expenditure dashboard slide for interest rate risk powerpoint template
This is a Business Reporting Operation Expenditure Dashboard Slide For Interest Rate Risk Powerpoint Template that you can use to present real-time information about your business. With a variety of graphical representations that are in-line with the current trends, this is a great way to display quantified data and stats. This is also a great PowerPoint slide to make informed decisions based on the data and results depicted. Since this template can accommodate a lot of statistical information in one-go it can be put to use by different department heads of the organization. This PPT slide can also be used to present a thorough discussion on various KPIs, all excel-linked and susceptible to innumerable changes. Thus helping in the portrayal of calculative data in a highly professional format. Not only this, but it can also be reproduced in JPG, PNG, and PDF formats. Therefore, reinvent the wheel by downloading this PPT slide now.
-
 Business operations dashboard snapshot manufacturing company performance analysis ppt model
This slide shows dashboard for measuring business operations. It includes details of total production, weekly average production, scrap and scrap average in each production line. It also covers daily production statistics, production trend, project summary, events and distribution. Deliver an outstanding presentation on the topic using this Business Operations Dashboard Snapshot Manufacturing Company Performance Analysis Ppt Model. Dispense information and present a thorough explanation of Production Trend, Daily Production, Production Summary, Distribution, Events using the slides given. This template can be altered and personalized to fit your needs. It is also available for immediate download. So grab it now.
-
 Infrastructure kpi dashboard showing project revenue business operations analysis examples ppt slides
Present the topic in a bit more detail with this Infrastructure KPI Dashboard Showing Project Revenue Business Operations Analysis Examples Ppt Slides. Use it as a tool for discussion and navigation on Household, All Other Materials, Asphalt, Rubble, Plastic. This template is free to edit as deemed fit for your organization. Therefore download it now.
-
 Infrastructure kpi dashboard showing resource allocation business operations analysis examples ppt introduction
Deliver an outstanding presentation on the topic using this Infrastructure KPI Dashboard Showing Resource Allocation Business Operations Analysis Examples Ppt Introduction. Dispense information and present a thorough explanation of Days Per Project, Resource Allocation, Project Financial using the slides given. This template can be altered and personalized to fit your needs. It is also available for immediate download. So grab it now.


