Powerpoint Templates and Google slides for Bar.
Save Your Time and attract your audience with our fully editable PPT Templates and Slides.
-
 Kpi icons showing magnifying glass and bar graph in circle
Presenting this set of slides with name - Kpi Icons Showing Magnifying Glass And Bar Graph In Circle. This is a three stage process. The stages in this process are Kpi Icon, Metircs Icon, Dashboard Icon.
-
 Roadblocks covering barrier in the circle with two red lights icon
Presenting this set of slides with name - Roadblocks Covering Barrier In The Circle With Two Red Lights Icon. This is a one stage process. The stages in this process are Roadblocks Icon, Barrier Icon, Barricade Icon.
-
 Roadblocks covering barrier sign board icon
Presenting this set of slides with name - Roadblocks Covering Barrier Sign Board Icon. This is a one stage process. The stages in this process are Roadblocks Icon, Barrier Icon, Barricade Icon.
-
 Roadblocks covering barrier with four legs icon
Presenting this set of slides with name - Roadblocks Covering Barrier With Four Legs Icon. This is a one stage process. The stages in this process are Roadblocks Icon, Barrier Icon, Barricade Icon.
-
 Roadblocks covering barrier with lines icon
Presenting this set of slides with name - Roadblocks Covering Barrier With Lines Icon. This is a one stage process. The stages in this process are Roadblocks Icon, Barrier Icon, Barricade Icon.
-
 Roadblocks covering barrier with traffic controller icon
Presenting this set of slides with name - Roadblocks Covering Barrier With Traffic Controller Icon. This is a one stage process. The stages in this process are Roadblocks Icon, Barrier Icon, Barricade Icon.
-
 Monopoly showing the bar chart with man holding hand
Presenting this set of slides with name - Monopoly Showing The Bar Chart With Man Holding Hand. This is a three stage process. The stages in this process are Single Buyer, Single Entity, Single Seller, Monopoly.
-
 Volume icon with adjustment bar
Presenting Volume Icon With Adjustment Bar slide. Its compatibility with Google Slides makes it accessible at once. You can transform and save the slide in PDF and JPG formats as well. Get this high-quality slide to present it in front of thousands of people on a standard screen and widescreen.
-
 Volume icon with equalizer bars
Presenting this set of slides with name - Volume Icon With Equalizer Bars. This is a three stage process. The stages in this process are Sound Icon, Amplification Icon, Volume Icon.
-
 Industry environment entry barriers supplier power buyer power
Introducing Industry Environment Entry Barriers Supplier Power Buyer Power. Create a visually-impressive presentation with the help of our 100% modifiable PowerPoint template. Customize text, font, background, orientation, shapes, patterns, and colors however you desire. Convert the file format from PPT to PDF, PNG, or JPG as per your convenience. You can easily access this PowerPoint layout on Google Slides. It is also compatible with widescreen and standard resolutions.
-
 Stacked bar powerpoint slide presentation guidelines template 1
Presenting this set of slides with name - Stacked Bar Powerpoint Slide Presentation Guidelines Template 1. This is a three stage process. The stages in this process are Business, Marketing, Strategy, Percentage, Graph.
-
 Stacked bar powerpoint slide presentation guidelines
Presenting this set of slides with name - Stacked Bar Powerpoint Slide Presentation Guidelines. This is a two stage process. The stages in this process are Business, Marketing, Finance, Strategy, Graph.
-
 Customer map activities motivation emotions barriers
Presenting this set of slides with name - Customer Map Activities Motivation Emotions Barriers. This is a four stage process. The stages in this process are Customer Map, Customer Journey, Customer Experience.
-
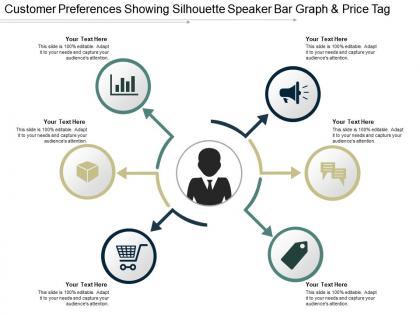 Customer preferences showing silhouette speaker bar graph and price tag
Presenting this set of slides with name - Customer Preferences Showing Silhouette Speaker Bar Graph And Price Tag. This is a six stage process. The stages in this process are Customer Preferences, Customer Behaviour, Customer Needs.
-
 Decision point showing bar graph and three gears
Presenting this set of slides with name - Decision Point Showing Bar Graph And Three Gears. This is a two stage process. The stages in this process are Decision Point, Choice, Decision Making.
-
 Decision point showing gears bar graph recycle and hour glass
Presenting this set of slides with name - Decision Point Showing Gears Bar Graph Recycle And Hour Glass. This is a three stage process. The stages in this process are Decision Point, Choice, Decision Making.
-
 Land icon with farm and barn
Presenting Land Icon With Farm And Barn slide. Its compatibility with Google Slides makes it accessible at once. Make modifications in the font color, font size, and font style of the slide as it is entirely customizable. You can transform and save the slide in PDF and JPG formats as well. Get this high-quality slide to present it in front of thousands of people on a standard screen and widescreen.
-
 Clustered bar powerpoint slide designs download
Presenting clustered bar powerpoint slide designs download. This is a clustered bar powerpoint slide designs download. This is a three stage process. The stages in this process are unit count, business, marketing, finance, graph.
-
 Business action plan timelines resources potential barriers responsibilities steps
Presenting business action plan timelines resources potential barriers responsibilities steps. This is a business action plan timelines resources potential barriers responsibilities steps. This is a five stage process. The stages in this process are business action plan, execution plan, strategic plan.
-
 Analysis icon with silhouettes bar graph notice board
Presenting analysis icon with silhouettes bar graph notice board. This is a analysis icon with silhouettes bar graph notice board. This is a three stage process. The stages in this process are analysis, audit, investigation.
-
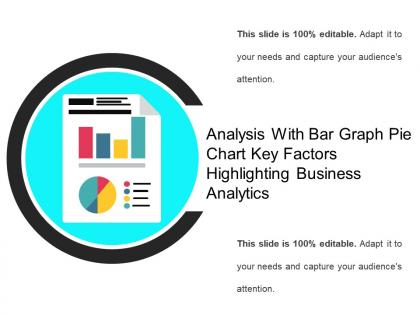 Analysis with bar graph pie chart key factors highlighting business analytics
Presenting analysis with bar graph pie chart key factors highlighting business analytics. This is a analysis with bar graph pie chart key factors highlighting business analytics. This is a two stage process. The stages in this process are analysis, audit, investigation.
-
 Analysis with magnifying glass bar graph chart highlighting business analytics
Presenting analysis with magnifying glass bar graph chart highlighting business analytics. This is a analysis with magnifying glass bar graph chart highlighting business analytics. This is a three stage process. The stages in this process are analysis, audit, investigation.
-
 Business analysis with bar graph magnifying glass dollar sign
Presenting business analysis with bar graph magnifying glass dollar sign. This is a business analysis with bar graph magnifying glass dollar sign. This is a two stage process. The stages in this process are analysis, audit, investigation.
-
 Business analysis with bar graph pie chart upward moving arrow
Presenting business analysis with bar graph pie chart upward moving arrow. This is a business analysis with bar graph pie chart upward moving arrow. This is a three stage process. The stages in this process are analysis, audit, investigation.
-
 Two sound bar pulse electronic music icons
Presenting two sound bar pulse electronic music icons. This is a two sound bar pulse electronic music icons. This is a two stage process. The stages in this process are electronic music, experimental songs, sound effects.
-
 Service innovation showing bulb bar graph and dollar
Presenting service innovation showing bulb bar graph and dollar. This is a service innovation showing bulb bar graph and dollar. This is a six stage process. The stages in this process are service innovation, service management, service design.
-
 Bar chart sample ppt presentation
Presenting Bar Chart Sample Ppt Presentation Presentation. Our PPT layout is compatible with Google Slides. You can download this PPT theme in various formats like PDF, PNG, and JPG. This PowerPoint template is completely editable and you can modify the font size, font type, and shapes as per your requirements. This PPT slide is available at 4:3 and 16:9 aspect ratios.
-
 Assessment icon showcasing bar graph
Presenting assessment icon showcasing bar graph. This is a assessment icon showcasing bar graph. This is a three stage process. The stages in this process are feedback loop icon, evaluation icon, assessment icon.
-
 Assessment icon with magnifying glass bar graph silhouettes document
Presenting assessment icon with magnifying glass bar graph silhouettes document. This is a assessment icon with magnifying glass bar graph silhouettes document. This is a three stage process. The stages in this process are feedback loop icon, evaluation icon, assessment icon.
-
 Assessment icon with magnifying glass showcasing bar graph
Presenting assessment icon with magnifying glass showcasing bar graph. This is a assessment icon with magnifying glass showcasing bar graph. This is a two stage process. The stages in this process are feedback loop icon, evaluation icon, assessment icon.
-
 Efficiency icon represented by two overlapping gears and bar graph performance
Presenting efficiency icon represented by two overlapping gears and bar graph performance. This is a efficiency icon represented by two overlapping gears and bar graph performance. This is a three stage process. The stages in this process are efficiency icon, ability icon, effectiveness icon.
-
 Bar chart in circle with growth icon
Presenting bar chart in circle with growth icon. This is a bar chart in circle with growth icon. This is a three stage process. The stages in this process are growth icons, improvement icons, enhancement icons.
-
 Stacked bar powerpoint layout
Presenting stacked bar powerpoint layout. This is a stacked bar powerpoint layout. This is a two stage process. The stages in this process are stacked bar, finance, marketing, strategy, business, analysis.
-
 Stacked bar powerpoint show
Presenting stacked bar powerpoint show. This is a stacked bar powerpoint show. This is a four stage process. The stages in this process are stacked bar, finance, marketing, strategy, business, analysis.
-
 Bar chart powerpoint slide presentation tips
Presenting Bar Chart PowerPoint Slide Presentation Tips. This PPT theme is available in both 4:3 and 16:9 aspect ratios. As this PowerPoint template is 100% editable, you can modify the color, font size, font type, and shapes as per your requirements. This PPT presentation is Google Slides compatible hence it is easily accessible. You can download and save this PowerPoint layout in different formats like PDF, PNG, and JPG.
-
 Risk and barriers presentation layouts
Presenting risk and barriers presentation layouts. This is a risk and barriers presentation layouts. This is a three stage process. The stages in this process are risk assessment, resistance to change, resistance management plan.
-
 Clustered bar powerpoint themes template 1
Presenting clustered bar powerpoint themes template 1. This is a clustered bar powerpoint themes template 1. This is a two stage process. The stages in this process are profit, product, bar graph, business, growth.
-
 Clustered bar powerpoint slide background picture
Presenting clustered bar powerpoint slide background picture. This is a clustered bar powerpoint slide background picture. This is a two stage process. The stages in this process are business, marketing, bar, planning, strategy.
-
 Stacked bar powerpoint slide presentation sample
Presenting stacked bar powerpoint slide presentation sample. This is a stacked bar powerpoint slide presentation sample. This is a four stage process. The stages in this process are business, marketing, bar, planning, strategy.
-
 Risk and barriers powerpoint slide background picture
Presenting risk and barriers powerpoint slide background picture. This is a risk and barriers powerpoint slide background picture. This is a three stage process. The stages in this process are risk assessment, resistance to change, resistance management plan, business, icons.
-
 Bar chart powerpoint graphics 1
Presenting bar chart powerpoint graphics 1. This is a bar chart powerpoint graphics 1. This is a one stage process. The stages in this process are financial years, graph, business, marketing, strategy.
-
 Clustered bar powerpoint presentation templates
Presenting clustered bar powerpoint presentation templates. This is a clustered bar powerpoint presentation templates. This is a three stage process. The stages in this process are financial, graph, business, marketing, strategy.
-
 Data analytic bar graph magnifying glass
Presenting data analytic bar graph magnifying glass. This is a data analytic bar graph magnifying glass. This is a four stage process. The stages in this process are data analytics icons, information analytics icons, content analytics icons.
-
 Data analytic icon bar graph
Presenting Data Analytic Icon Bar Graph template. The slide is compatible with Google Slides which makes it accessible at once. The slide is completely editable. It can be saved in various document formats such as JPEG, PNG, or PDF. Moreover, both standard screen(4:3) and widescreen(16:9) aspect ratios are supported. High-quality graphics ensure that distortion does not occur.
-
 Data analytic icon computer screen bar graph
Presenting data analytic icon computer screen bar graph. This is a data analytic icon computer screen bar graph. This is a one stage process. The stages in this process are data analytics icons, information analytics icons, content analytics icons.
-
 Data analytic icon improved bar graph
Presenting data analytic icon improved bar graph. This is a data analytic icon improved bar graph. This is a three stage process. The stages in this process are data analytics icons, information analytics icons, content analytics icons.
-
 Data analytic magnifying glass bar graph
Presenting data analytic magnifying glass bar graph. This is a data analytic magnifying glass bar graph. This is a one stage process. The stages in this process are data analytics icons, information analytics icons, content analytics icons.
-
 Data analytic magnifying glass pie chart bar graph
Presenting data analytic magnifying glass pie chart bar graph. This is a data analytic magnifying glass pie chart bar graph. This is a four stage process. The stages in this process are data analytics icons, information analytics icons, content analytics icons.
-
 Data analytic screen growth improvement bar graph
Presenting data analytic screen growth improvement bar graph. This is a data analytic screen growth improvement bar graph. This is a two stage process. The stages in this process are data analytics icons, information analytics icons, content analytics icons.
-
 Desktop icon monitor with vertical bars
Presenting Desktop Icon Monitor With Vertical Bars template. You can include charts and graphs for a clear representation of facts. The PPT also supports the standard (4:3) and widescreen (16:9) aspect ratios. It is having compatibility with Google Slides. Save this into common images or document formats like JPEG, PNG, or PDF. High-quality graphics will ensure that picture quality does not deteriorate.
-
 Clustered bar sample of ppt template 1
Presenting clustered bar sample of ppt template 1. This is a clustered bar sample of ppt template 1. This is a four stage process. The stages in this process are product, unit count, step, business, management.
-
 Online reputation management target board smile bubble bar graph chess
Presenting online reputation management target board smile bubble bar graph chess. This is a online reputation management target board smile bubble bar graph chess. This is a five stage process. The stages in this process are online reputation management, orm, reputation marketing.
-
 Procurement process with five steps circular and bar graph arrow
Presenting procurement process with five steps circular and bar graph arrow. This is a procurement process with five steps circular and bar graph arrow. This is a five stage process. The stages in this process are procurement process, purchasing process, buying cycle.
-
 Procurement process with four steps circular and bar graph arrow
Presenting procurement process with four steps circular and bar graph arrow. This is a procurement process with four steps circular and bar graph arrow. This is a four stage process. The stages in this process are procurement process, purchasing process, buying cycle.
-
 Procurement process with seven steps circular and bar graph arrow
Presenting procurement process with seven steps circular and bar graph arrow. This is a procurement process with seven steps circular and bar graph arrow. This is a seven stage process. The stages in this process are procurement process, purchasing process, buying cycle.
-
 Procurement process with six steps circular and bar graph arrow
Presenting procurement process with six steps circular and bar graph arrow. This is a procurement process with six steps circular and bar graph arrow. This is a six stage process. The stages in this process are procurement process, purchasing process, buying cycle.
-
 Procurement process with three steps circular and bar graph arrow
Presenting procurement process with three steps circular and bar graph arrow. This is a procurement process with three steps circular and bar graph arrow. This is a three stage process. The stages in this process are procurement process, purchasing process, buying cycle.
-
 Clustered bar powerpoint slide background
Presenting clustered bar powerpoint slide background. This is a clustered bar powerpoint slide background. This is a two stage process. The stages in this process are business, marketing, planning, finance, bar graph.
-
 Fraud bank behind bars eyes icon
Presenting fraud bank behind bars eyes icon. This is a fraud bank behind bars eyes icon. This is a one stage process. The stages in this process are fraud, cheater, stabber.
-
 Fence using circular barbed wire four turns
Presenting fence using circular barbed wire four turns. This is a fence using circular barbed wire four turns. This is a four stage process. The stages in this process are fence, boundary, chain link, outdoor.


