Powerpoint Templates and Google slides for Bar.
Save Your Time and attract your audience with our fully editable PPT Templates and Slides.
-
 Bar chart with years for financial data valuation powerpoint slides
Presenting bar chart with years for financial data valuation powerpoint slides. This Power Point template slide has been crafted with graphic of bar chart and finance icons. This PPT slide contains the concept of financial data valuation. Use this PPT slide for business and finance related presentations.
-
 Bar graph for financial distribution with year based analysis powerpoint slides
Amendable PowerPoint presentation backgrounds. Technology and action oriented diagrams. Clearly describes the business and finance related information without creating any doubts. Performs remarkably and wraps up the entire presentation on time. Enhances the image of the organisation with their impressive layout. Offers orientation and ungrouping the objects. Can be conveniently modified without any specific training.
-
 Bar graph with percentage for financial analysis powerpoint slides
Presenting bar graph with percentage for financial analysis powerpoint slides. This Power Point template slide has been crafted with graphic of bar graph and percentage icons. This PPT slide contains the concept of financial analysis. Use this PPT slide for business and finance related presentations.
-
 Barriers to market entry ppt slide
Presenting barriers to market entry ppt slide. This is a barriers to market entry ppt slide. This is a four stage process. The stages in this process are icons, marketing, business.
-
 Media mix optimization bar chart ppt slides
Presenting media mix optimization bar chart ppt slides. This is a media mix optimization bar chart ppt slides. This is a one stage process. The stages in this process are business, strategy, marketing, management, icons.
-
 Bargaining power of suppliers ppt slides
Presenting bargaining power of suppliers ppt slides. This is a bargaining power of suppliers ppt slides. This is a four stage process. The stages in this process are bargaining power of suppliers, bargaining power of buyer, threat of new entrants, threat of substitute products.
-
 Bar graph with business steps and icons powerpoint slides
Presenting bar graph with business steps and icons powerpoint slides. This is a bar graph with business steps and icons powerpoint slides. This is a three stage process. The stages in this process are financials.
-
 Bar graph with percentage values and team powerpoint slides
Presenting bar graph with percentage values and team powerpoint slides. This is a bar graph with percentage values and team powerpoint slides. This is a six stage process. The stages in this process are financials.
-
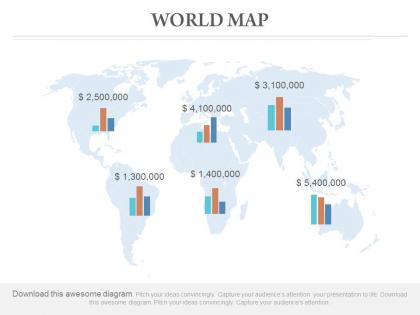 World map with bar chart and financial growth powerpoint slides
Presenting world map with bar chart and financial growth powerpoint slides. This is a world map with bar chart and financial growth powerpoint slides. This is a six stage process. The stages in this process are company location.
-
 Bar graph to showcase financial analysis powerpoint ideas
Presenting bar graph to showcase financial analysis powerpoint ideas. This is a bar graph to showcase financial analysis powerpoint ideas. This is a four stage process. The stages in this process are arrow, financial, analysis, marketing, strategy, business.
-
 Bar graph for sales revenue over the years
Presenting bar graph for sales revenue over the years. This is a bar graph for sales revenue over the years. This is a nine stage process. The stages in this process are business, marketing, growth, bar, years.
-
 Sales growth bar graph powerpoint templates
Presenting sales growth bar graph powerpoint templates. This is a sales growth bar graph powerpoint templates. This is a five stage process. The stages in this process are growth, business, marketing, arrows, management.
-
 Bar graph to highlight financial growth good ppt example
Presenting bar graph to highlight financial growth good ppt example. This is a bar graph to highlight financial growth good ppt example. This is a five stage process. The stages in this process are business, bar graph, finance, marketing, growth, strategy, success.
-
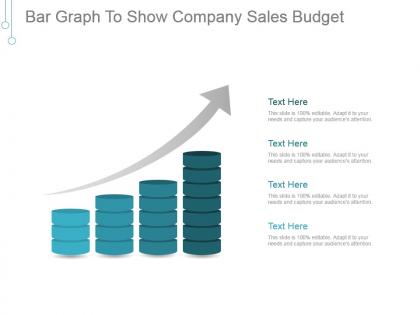 Bar graph to show company sales budget example of ppt
Presenting bar graph to show company sales budget example of ppt. This is a bar graph to show company sales budget example of ppt. This is a four stage process. The stages in this process are business, arrows, growth, marketing, success.
-
 Bar graph for rate of employee turnover example of ppt presentation
Presenting bar graph for rate of employee turnover example of ppt presentation. This is a bar graph for rate of employee turnover example of ppt presentation. This is a five stage process. The stages in this process are rate of turnover, voluntary, total.
-
 Competency rating of employees horizontal bar chart sample ppt presentation
Presenting competency rating of employees horizontal bar chart sample ppt presentation. This is a competency rating of employees horizontal bar chart sample ppt presentation. This is a eight stage process. The stages in this process are managerial efficiency, resource planning, develop and implements, financial accounting, financial analysis, financial planning, provides direction, directiveness.
-
 Horizontal bar chart for comparison powerpoint slide ideas
Presenting horizontal bar chart for comparison PPT slide. This presentation graph chart is fully editable in PowerPoint. You can customize the font type, font size, colors of the chart and background color as per your requirement. The slide is fully compatible with Google slides and can be saved in JPG or PDF format without any hassle. High quality graphics and icons ensure that there is no deteriorating in quality on enlarging their size. Have the tendency to boost the overall impression of your presentation.
-
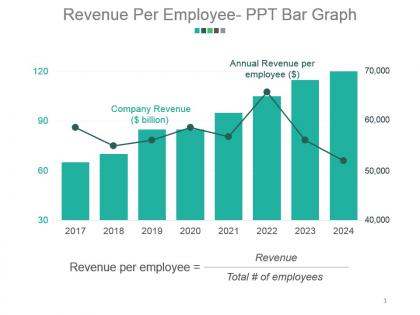 Revenue per employee ppt bar graph powerpoint slide background image
Presenting revenue per employee ppt bar graph powerpoint slide background image. This is a revenue per employee ppt bar graph powerpoint slide background image. This is a eight stage process. The stages in this process are annual revenue per employee, company revenue, revenue per employee, revenue, total number of employees.
-
 Staff acquisition source horizontal bar chart powerpoint slide backgrounds
Presenting staff acquisition source horizontal bar chart powerpoint slide backgrounds. This is a staff acquisition source horizontal bar chart powerpoint slide backgrounds. This is a seven stage process. The stages in this process are campus interview, career fair, recruitment vendor, employee referral, web groups, job portals, print media.
-
 Workforce diversity by age group clustered bar chart powerpoint slide deck template
Presenting workforce diversity by age group clustered bar chart powerpoint slide deck template. This is a workforce diversity by age group clustered bar chart powerpoint slide deck template. This is a three stage process. The stages in this process are total workforce, male, female.
-
 Workforce diversity by region clustered bar graph powerpoint slide design templates
Presenting workforce diversity by region clustered bar graph powerpoint slide design templates. This is a workforce diversity by region clustered bar graph powerpoint slide design templates. This is a four stage process. The stages in this process are employees headcount, new employees hire, employees left job.
-
 Bar graph for showing continuous success example of ppt
Presenting bar graph for showing continuous success example of ppt. This is a bar graph for showing continuous success example of ppt. This is a five stage process. The stages in this process are growth, business, arrow, marketing, success.
-
 Bar graph with arrow for career planning ppt summary
Presenting bar graph with arrow for career planning ppt summary. This is a bar graph with arrow for career planning ppt summary. This is a six stage process. The stages in this process are business, finance, marketing, strategy, planning, success, arrow.
-
 Red board with arrow bar for target market ppt inspiration
Presenting red board with arrow bar for target market ppt inspiration. This is a red board with arrow bar for target market ppt inspiration. This is a three stage process. The stages in this process are our goals, arrows, marketing, strategy, business, success.
-
 Market growth and development bar graph ppt images
Presenting market growth and development bar graph ppt images. This is a market growth and development bar graph ppt images. This is a four stage process. The stages in this process are category, series.
-
 Team target and achievements bar graphs ppt slides
Presenting team target and achievements bar graphs ppt slides. This is a team target and achievements bar graphs ppt slides. This is a six stage process. The stages in this process are jan, feb, mar, apr, may, june, target, achievement.
-
 Absenteeism rate by days data driven bar graph powerpoint show
Presenting absenteeism rate by days data driven bar graph powerpoint show. This is a absenteeism rate by days data driven bar graph powerpoint show. This is a two stage process. The stages in this process are absenteeism rate by days, days lost per employee per annum, monday, tuesday, wednesday, thursday, friday, saturday.
-
 Age group diversity clustered bar graph
Presenting age group diversity clustered bar graph. This is a age group diversity clustered bar graph. This is a three stage process. The stages in this process are by age group, 1500 23 percent of total workforce male 33 percent female 62 percent, 2524 54 percent of total workforce male 40 percent female 60 percent, 2524 54 percent of total workforce male 40 percent female 60 percent, 955 30 percent of total workforce male 55 percent female 45 percent, male employee headcount total and percent, female employee headcount total and percent, new employee hires total and rate, employee who left employment total and rate.
-
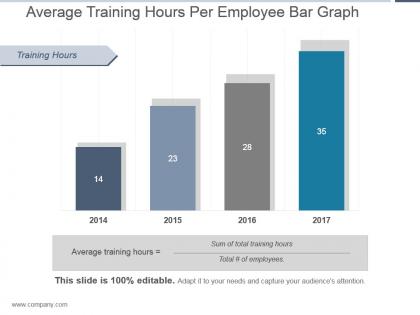 Average training hours per employee bar graph ppt design
Presenting average training hours per employee bar graph ppt design. This is a average training hours per employee bar graph ppt design. This is a four stage process. The stages in this process are training hours, average training hours, sum of total training hours, total of employees.
-
 Cost per hire formula and bar chart ppt design templates
Presenting cost per hire formula and bar chart ppt design templates. This is a cost per hire formula and bar chart ppt design templates. This is a seven stage process. The stages in this process are cost per hire, campus interview, career fair, requirement vendor, employee referral, web groups, job portals, print media, cost per hire, recruitment cost, compensation cost benefits cost.
-
 Editable bar chart voluntary total employee turnover ppt icon
Presenting editable bar chart voluntary total employee turnover ppt icon. This is a editable bar chart voluntary total employee turnover ppt icon. This is a five stage process. The stages in this process are employee turnover, rate of turn over, voluntary, total.
-
 Staff qualification level bar graph presentation powerpoint
Presenting staff qualification level bar graph presentation powerpoint. This is a staff qualification level bar graph presentation powerpoint. This is a five stage process. The stages in this process are qualification, below bachelor degree, post graduate diploma, bachelor degree, masters degree, doctorate.
-
 Bar graph to show company sales growth powerpoint slide themes
Presenting bar graph to show company sales growth powerpoint slide themes. This is a bar graph to show company sales growth powerpoint slide themes. This is a eight stage process. The stages in this process are business, marketing, bar graph, growth, management.
-
 Quality assurance growth bar graph ppt slides
Presenting quality assurance growth bar graph ppt slides. This is a quality assurance growth bar graph ppt slides. This is a five stage process. The stages in this process are graph, bar chart, chart, business, marketing.
-
 Funnel bar chart for ad campaign results ppt slide
Presenting funnel bar chart for ad campaign results ppt slide. This is a funnel bar chart for ad campaign results ppt slide. This is a two stage process. The stages in this process are brand, leads, sales, loyalty.
-
 Bar chart for media usage preferences powerpoint slide rules
Presenting bar chart for media usage preferences powerpoint slide rules. This is a bar chart for media usage preferences powerpoint slide rules. This is a four stage process. The stages in this process are digital video, mobile video, advanced tv, broad cast cable tv.
-
 Business target evaluation with bar graph powerpoint slide download
Presenting business target evaluation with bar graph powerpoint slide download. This is a business target evaluation with bar graph powerpoint slide download. This is a five stage process. The stages in this process are step.
-
 Bar graph to show sales growth ppt model
Presenting bar graph to show sales growth ppt model. This is a bar graph to show sales growth ppt model. This is a five stage process. The stages in this process are business, marketing, process, success, strategy.
-
 Market size vs growth rate bar graph powerpoint slide images
Presenting market size vs growth rate bar graph powerpoint slide images. This is a market size vs growth rate bar graph powerpoint slide images. This is a eight stage process. The stages in this process are business, marketing, growth, timeline, bar graph.
-
 Five column bar graph vertical presentation design
Presenting five column bar graph vertical presentation design. This is a five column bar graph vertical presentation design. This is a five stage process. The stages in this process are series 1, series 2.
-
 Five staged bar diagram powerpoint template design
Presenting five staged bar diagram powerpoint template design. This is a five staged bar diagram powerpoint template design. This is a five stage process. The stages in this process are staged bar, diagram, growth, success, strategy.
-
 Bar graph with lego blocks for business growth powerpoint slide show
Presenting bar graph with lego blocks for business growth powerpoint slide show. This is a bar graph with lego blocks for business growth powerpoint slide show. This is a five stage process. The stages in this process are lego, business, growth, strategy, success.
-
 Project performance bar graph powerpoint slide designs download
Presenting project performance bar graph powerpoint slide designs download. This is a project performance bar graph powerpoint slide designs download. This is a four stage process. The stages in this process are bar graph, business, growth, years, success.
-
 Sales growth analysis bar graph ppt slide themes
Presenting sales growth analysis bar graph ppt slide themes. This is a sales growth analysis bar graph ppt slide themes. This is a four stage process. The stages in this process are bar graph, analysis, measure, growth, sales.
-
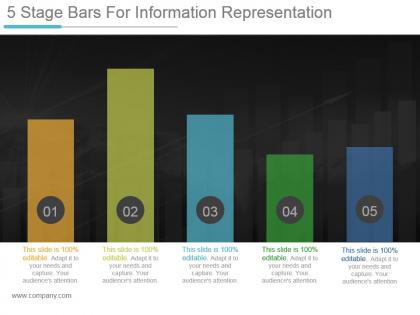 5 stage bars for information representation powerpoint templates
Presenting 5 stage bars for information representation powerpoint templates. This is a 5 stage bars for information representation powerpoint templates. This is a five stage process. The stages in this process are bar graph, growth, success, business, marketing.
-
 Financial crisis bar graphs powerpoint slide clipart
Presenting financial crisis bar graphs powerpoint slide clipart. This is a financial crisis bar graphs powerpoint slide clipart. This is a twelve stage process. The stages in this process are business, financial, strategy, marketing, investment, success.
-
 Improving business revenue bar graph ppt diagrams
Presenting improving business revenue bar graph ppt diagrams. This is a improving business revenue bar graph ppt diagrams. This is a six stage process. The stages in this process are business, finance, percentage, marketing, strategy, success, analysis.
-
 Three bars with percentage values for asset management ppt slide
Presenting three bars with percentage values for asset management ppt slide. This is a three bars with percentage values for asset management ppt slide. This is a three stage process. The stages in this process are business, marketing, financial, percentage, bar.
-
 Venn diagram with arrow bars for business concepts ppt visual
Presenting venn diagram with arrow bars for business concepts ppt visual. This is a venn diagram with arrow bars for business concepts ppt visual. This is a four stage process. The stages in this process are arrow, flow, process, circle, venn.
-
 Bar graph showing business success ppt visual
Presenting bar graph showing business success ppt visual. This is a bar graph showing business success ppt visual. This is a five stage process. The stages in this process are business, success, marketing, management, strategy.
-
 Bar graph for analyzing corporate growth presentation template
Presenting bar graph for analyzing corporate growth presentation template. Presenting bar graph for analyzing corporate growth presentation template. This is a bar graph for analyzing corporate growth presentation template. This is a five stage process. The stages in this process are bar graph, analyzing, corporate, growth, presentation, strategy.
-
 Bar graph for internet marketing growth ppt samples
Presenting bar graph for internet marketing growth ppt samples. This is a bar graph for internet marketing growth ppt samples. This is a six stage process. The stages in this process are business, graph, growth, marketing, success.
-
 Bar graph for marketing growth over the years ppt slide styles
Introducing marketing growth over years PowerPoint slides. Contemporary styled PowerPoint visuals of tremendous quality and graphics. Easily exportable to PDF or JPG file compositions. Abundant space option to insert company emblem or trademark with the Presentation diagrams. 100% rebuild able visuals, symbols, texts, pictures etc. Easy to project on large screen with an immense quality Presentation graphics. Option to insert title and subtitle accordingly. Versant with all Google Slides.
-
 Market growth bar graph ppt template
Presenting market growth bar graph ppt template. This is a market growth bar graph ppt template. This is a eight stage process. The stages in this process are market size, growth rate.
-
 World market trends bar graph powerpoint template
Presenting world market trends bar graph powerpoint template. This is a world market trends bar graph powerpoint template. This is a seven stage process. The stages in this process are in percentage, western europe, asia, north america, eastern europe, latin america, middle east, africa.
-
 Company market growth rate bar graph ppt slide
Presenting company market growth rate bar graph ppt slide. This is a company market growth rate bar graph ppt slide. This is a eight stage process. The stages in this process are business, growth, marketing, strategy, success.
-
 Bar graph for business success plan presentation diagram
Presenting bar graph for business success plan presentation diagram. This is a bar graph for business success plan presentation diagram. This is a four stage process. The stages in this process are icons, business, marketing, management, presentation.
-
 Opportunities and challenges race hurdle barriers powerpoint slide designs
The best advantage of downloading this opportunities and challenges PPT template is that it is 100% editable. You can modify and customize the slideshow according to your business preferences. The design can be viewed on both normal and full screen design view. You can open presentation template with Google Slides and MS PowerPoint software. Easy and swift downloading available, you can download the design into JPEG and PDF formats.
-
 Risks and mitigation strategies falling barriers powerpoint slide clipart
Presenting risks and mitigation strategies falling barriers powerpoint slide clipart. This is a risks and mitigation strategies falling barriers powerpoint slide clipart. This is a one stage process. The stages in this process are risk management, risk mitigation, risk planning.
-
 Risks and mitigation strategies race hurdle barrier powerpoint slides
Presenting risks and mitigation strategies race hurdle barrier PowerPoint slides PPT slide. This professional slide designed by SlideTeam to describe various risk mitigation strategies. The silhouette design is completely customizable in PowerPoint as well as compatible with Google Slides. A user can also do changes in slide such as font size, font type, color & size of hurdle diagram along with variation in slide's aspect ratios, without any changes in slide's quality. You can insert text in an athlete with hurdle slide according to your requirement.


