Powerpoint Templates and Google slides for Bar graphs
Save Your Time and attract your audience with our fully editable PPT Templates and Slides.
-
 Employee introduction skills comparison using bar graphs
Presenting this set of slides with name - Employee Introduction Skills Comparison Using Bar Graphs. This is a three stage process. The stages in this process are Employee Introduction, Employee Overview, Employee Summary.
-
 Trends arrow image with dollar sign and human holding bar graph
Presenting this set of slides with name - Trends Arrow Image With Dollar Sign And Human Holding Bar Graph. This is a four stage process. The stages in this process are Trends, Upward Arrow, Growth.
-
 Trends image with human silhouettes standing on bar graphs
Presenting this set of slides with name - Trends Image With Human Silhouettes Standing On Bar Graphs. This is a nine stage process. The stages in this process are Trends, Upward Arrow, Growth.
-
 Bar graph ppt icon example topics
Presenting this set of slides with name - Bar Graph Ppt Icon Example Topics. This is a three stage process. The stages in this process are Product, Bar Graph, Growth, Year, Finance.
-
 Cost management icon showing dollar sign with bar graph
Presenting this set of slides with name - Cost Management Icon Showing Dollar Sign With Bar Graph. This is a three stage process. The stages in this process are Cost Management, Budget Framework, Fund Model.
-
 Clustered bar ppt pictures graphic tips
Presenting this set of slides with name - Clustered Bar Ppt Pictures Graphic Tips. This is a four stage process. The stages in this process are Bar, Business, Marketing, Strategy, Planning.
-
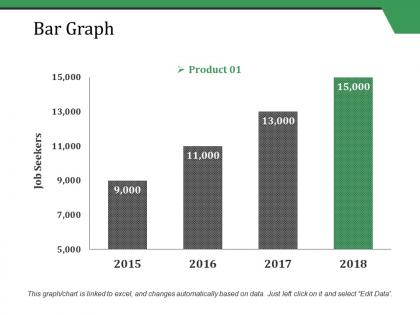 Bar graph ppt styles information
Presenting this set of slides with name - Bar Graph Ppt Styles Information. This is a one stage process. The stages in this process are Job Seekers, Graph, Years, Business, Marketing.
-
 Clustered bar ppt graphics
Presenting Clustered Bar Ppt Graphics PowerPoint slideshow. This is a fully customizable template. Change the color of bars in the stacked chart. The slides are available in both standard screen and widescreen aspect ratios. The templates are compatible with PowerPoint and google slides. You can also change the formulas as per your requirement. Pick our stylish and professionally designed slides for your presentation.
-
 Stacked bar ppt inspiration graphics pictures
Presenting this set of slides with name - Stacked Bar Ppt Inspiration Graphics Pictures. This is a four stage process. The stages in this process are Stacked Bar, Finance, Strategy, Analysis, Business.
-
 Bar graph growth strategic network planning communication strategy
Presenting this set of slides with name - Bar Graph Growth Strategic Network Planning Communication Strategy. This is an editable three stages graphic that deals with topics like Bar Graph, Growth, Strategic Network Planning, Communication Strategy to help convey your message better graphically. This product is a premium product available for immediate download, and is 100 percent editable in Powerpoint. Download this now and use it in your presentations to impress your audience.
-
 Hr metrics showing bar graph clock dollar and man shaking hands
Presenting this set of slides with name - Hr Metrics Showing Bar Graph Clock Dollar And Man Shaking Hands. This is a six stage process. The stages in this process are Hr Metrics, Hr Initiatives, Human Resource Metrics.
-
 Service Offering Bar Graph With Three Bullet Points And Icons
Presenting this set of slides with name - Service Offering Bar Graph With Three Bullet Points And Icons. This is a three stage process. The stages in this process are Service Offering, Service Commitments, Service Management.
-
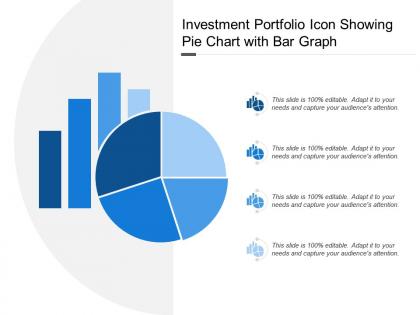 Investment portfolio icon showing pie chart with bar graph
Presenting this set of slides with name - Investment Portfolio Icon Showing Pie Chart With Bar Graph. This is a four stage process. The stages in this process are Investment Portfolio, Funding Portfolio, Expenditure Portfolio.
-
 Mobile analytics having bar graph and arrow upward
Presenting this set of slides with name - Mobile Analytics Having Bar Graph And Arrow Upward. This is a four stage process. The stages in this process are Mobile Analytics, Mobile Tracking, Mobile Web Analytics.
-
 Mobile analytics icon having bar graph
Presenting this set of slides with name - Mobile Analytics Icon Having Bar Graph. This is a one stage process. The stages in this process are Mobile Analytics, Mobile Tracking, Mobile Web Analytics.
-
 Mobile analytics icon having bar graph and arrow upward
Presenting this set of slides with name - Mobile Analytics Icon Having Bar Graph And Arrow Upward. This is a three stage process. The stages in this process are Mobile Analytics, Mobile Tracking, Mobile Web Analytics.
-
 Mobile analytics icon having bar graph and dollar
Presenting this set of slides with name - Mobile Analytics Icon Having Bar Graph And Dollar. This is a four stage process. The stages in this process are Mobile Analytics, Mobile Tracking, Mobile Web Analytics.
-
 Mobile analytics icon showing pie chart bar graph data analytics
Presenting this set of slides with name - Mobile Analytics Icon Showing Pie Chart Bar Graph Data Analytics. This is a one stage process. The stages in this process are Mobile Analytics, Mobile Tracking, Mobile Web Analytics.
-
 Mobile analytics showing target globe and bar graph
Presenting this set of slides with name - Mobile Analytics Showing Target Globe And Bar Graph. This is a seven stage process. The stages in this process are Mobile Analytics, Mobile Tracking, Mobile Web Analytics.
-
 Financial statements icon showcasing euro and bar graph
Presenting this set of slides with name - Financial Statements Icon Showcasing Euro And Bar Graph. This is a three stage process. The stages in this process are Financial Statements Icon, Accounting Ratio Icon, Balance Sheet Icon.
-
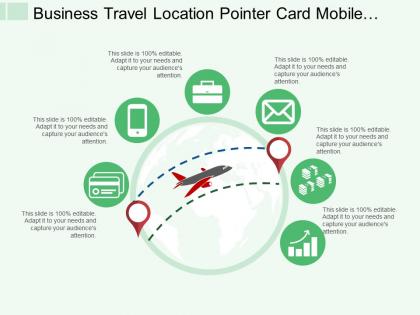 Business travel location pointer card mobile message envelope and bar graph
Presenting this set of slides with name - Business Travel Location Pointer Card Mobile Message Envelope And Bar Graph. This is a six stage process. The stages in this process are Business Travel, Business Tourism, Business Trip.
-
 Employee development bar graph bulb dollar flag and trophy
Presenting this set of slides with name - Employee Development Bar Graph Bulb Dollar Flag And Trophy. This is a four stage process. The stages in this process are Employee Development, Employee Enablement, Employee Growth.
-
 Brand tracking bar graph increasing line chart pie chart
Presenting this set of slides with name - Brand Tracking Bar Graph Increasing Line Chart Pie Chart. This is a six stage process. The stages in this process are Brand Tracking, Brand Valuation, Brand Analysis.
-
 Data visualization icon bar graph in hexagonal shaped
Presenting this set of slides with name - Data Visualization Icon Bar Graph In Hexagonal Shaped. This is a one stage process. The stages in this process are Data Visualization Icon, Data Management Icon.
-
 Data visualization icon four pie chart bar graph upward lines
Presenting this set of slides with name - Data Visualization Icon Four Pie Chart Bar Graph Upward Lines. This is a one stage process. The stages in this process are Data Visualization Icon, Data Management Icon.
-
 Business results info graphics with bar chart and graph
Presenting this set of slides with name - Business Results Info Graphics With Bar Chart And Graph. This is a three stage process. The stages in this process are Business Results, Business Outcomes, Business Output.
-
 Quantitative icon showing bar graph chart
Presenting this set of slides with name - Quantitative Icon Showing Bar Graph Chart. This is a four stage process. The stages in this process are Quantitative, Financial Analysis, Statistical Modelling.
-
 Cluster circles target innovation bar graph hand shake
Presenting this set of slides with name - Cluster Circles Target Innovation Bar Graph Hand Shake. This is a four stage process. The stages in this process are Circle Cluster, Cyclic Cluster, Circular Cluster.
-
 Expanding icon showing bar graphs with upward arrow
Presenting this set of slides with name - Expanding Icon Showing Bar Graphs With Upward Arrow. This is a two stage process. The stages in this process are Expanding, Business Expansion, Business Development.
-
 Kpi icon showing bar graph and upward arrow
Presenting this set of slides with name - Kpi Icon Showing Bar Graph And Upward Arrow. This is a three stage process. The stages in this process are Kpi Icon, Metircs Icon, Dashboard Icon.
-
 Kpi icon showing magnifying glass bar graph and pie chart
Presenting this set of slides with name - Kpi Icon Showing Magnifying Glass Bar Graph And Pie Chart. This is a four stage process. The stages in this process are Kpi Icon, Metircs Icon, Dashboard Icon.
-
 Kpi icon showing pie chart and bar graph in monitor
Presenting this set of slides with name - Kpi Icon Showing Pie Chart And Bar Graph In Monitor. This is a four stage process. The stages in this process are Kpi Icon, Metircs Icon, Dashboard Icon.
-
 Kpi icon showing upward arrow and bar graph
Presenting this set of slides with name - Kpi Icon Showing Upward Arrow And Bar Graph. This is a three stage process. The stages in this process are Kpi Icon, Metircs Icon, Dashboard Icon.
-
 Kpi icons showing magnifying glass and bar graph in circle
Presenting this set of slides with name - Kpi Icons Showing Magnifying Glass And Bar Graph In Circle. This is a three stage process. The stages in this process are Kpi Icon, Metircs Icon, Dashboard Icon.
-
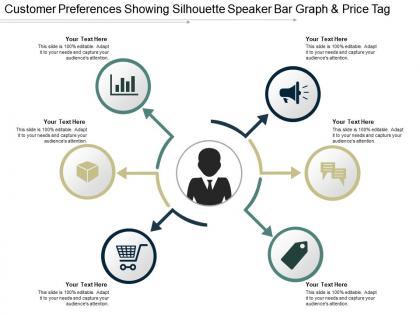 Customer preferences showing silhouette speaker bar graph and price tag
Presenting this set of slides with name - Customer Preferences Showing Silhouette Speaker Bar Graph And Price Tag. This is a six stage process. The stages in this process are Customer Preferences, Customer Behaviour, Customer Needs.
-
 Decision point showing bar graph and three gears
Presenting this set of slides with name - Decision Point Showing Bar Graph And Three Gears. This is a two stage process. The stages in this process are Decision Point, Choice, Decision Making.
-
 Decision point showing gears bar graph recycle and hour glass
Presenting this set of slides with name - Decision Point Showing Gears Bar Graph Recycle And Hour Glass. This is a three stage process. The stages in this process are Decision Point, Choice, Decision Making.
-
 Analysis icon with silhouettes bar graph notice board
Presenting analysis icon with silhouettes bar graph notice board. This is a analysis icon with silhouettes bar graph notice board. This is a three stage process. The stages in this process are analysis, audit, investigation.
-
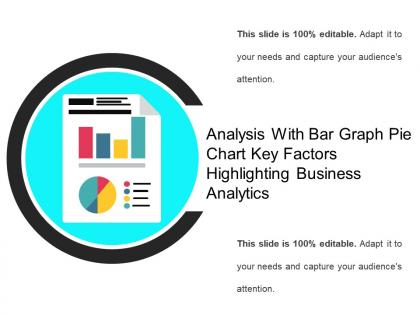 Analysis with bar graph pie chart key factors highlighting business analytics
Presenting analysis with bar graph pie chart key factors highlighting business analytics. This is a analysis with bar graph pie chart key factors highlighting business analytics. This is a two stage process. The stages in this process are analysis, audit, investigation.
-
 Analysis with magnifying glass bar graph chart highlighting business analytics
Presenting analysis with magnifying glass bar graph chart highlighting business analytics. This is a analysis with magnifying glass bar graph chart highlighting business analytics. This is a three stage process. The stages in this process are analysis, audit, investigation.
-
 Business analysis with bar graph magnifying glass dollar sign
Presenting business analysis with bar graph magnifying glass dollar sign. This is a business analysis with bar graph magnifying glass dollar sign. This is a two stage process. The stages in this process are analysis, audit, investigation.
-
 Business analysis with bar graph pie chart upward moving arrow
Presenting business analysis with bar graph pie chart upward moving arrow. This is a business analysis with bar graph pie chart upward moving arrow. This is a three stage process. The stages in this process are analysis, audit, investigation.
-
 Service innovation showing bulb bar graph and dollar
Presenting service innovation showing bulb bar graph and dollar. This is a service innovation showing bulb bar graph and dollar. This is a six stage process. The stages in this process are service innovation, service management, service design.
-
 Assessment icon showcasing bar graph
Presenting assessment icon showcasing bar graph. This is a assessment icon showcasing bar graph. This is a three stage process. The stages in this process are feedback loop icon, evaluation icon, assessment icon.
-
 Assessment icon with magnifying glass bar graph silhouettes document
Presenting assessment icon with magnifying glass bar graph silhouettes document. This is a assessment icon with magnifying glass bar graph silhouettes document. This is a three stage process. The stages in this process are feedback loop icon, evaluation icon, assessment icon.
-
 Assessment icon with magnifying glass showcasing bar graph
Presenting assessment icon with magnifying glass showcasing bar graph. This is a assessment icon with magnifying glass showcasing bar graph. This is a two stage process. The stages in this process are feedback loop icon, evaluation icon, assessment icon.
-
 Efficiency icon represented by two overlapping gears and bar graph performance
Presenting efficiency icon represented by two overlapping gears and bar graph performance. This is a efficiency icon represented by two overlapping gears and bar graph performance. This is a three stage process. The stages in this process are efficiency icon, ability icon, effectiveness icon.
-
 Bar chart powerpoint graphics 1
Presenting bar chart powerpoint graphics 1. This is a bar chart powerpoint graphics 1. This is a one stage process. The stages in this process are financial years, graph, business, marketing, strategy.
-
 Data analytic bar graph magnifying glass
Presenting data analytic bar graph magnifying glass. This is a data analytic bar graph magnifying glass. This is a four stage process. The stages in this process are data analytics icons, information analytics icons, content analytics icons.
-
 Data analytic icon bar graph
Presenting Data Analytic Icon Bar Graph template. The slide is compatible with Google Slides which makes it accessible at once. The slide is completely editable. It can be saved in various document formats such as JPEG, PNG, or PDF. Moreover, both standard screen(4:3) and widescreen(16:9) aspect ratios are supported. High-quality graphics ensure that distortion does not occur.
-
 Data analytic icon computer screen bar graph
Presenting data analytic icon computer screen bar graph. This is a data analytic icon computer screen bar graph. This is a one stage process. The stages in this process are data analytics icons, information analytics icons, content analytics icons.
-
 Data analytic icon improved bar graph
Presenting data analytic icon improved bar graph. This is a data analytic icon improved bar graph. This is a three stage process. The stages in this process are data analytics icons, information analytics icons, content analytics icons.
-
 Data analytic magnifying glass bar graph
Presenting data analytic magnifying glass bar graph. This is a data analytic magnifying glass bar graph. This is a one stage process. The stages in this process are data analytics icons, information analytics icons, content analytics icons.
-
 Data analytic magnifying glass pie chart bar graph
Presenting data analytic magnifying glass pie chart bar graph. This is a data analytic magnifying glass pie chart bar graph. This is a four stage process. The stages in this process are data analytics icons, information analytics icons, content analytics icons.
-
 Data analytic screen growth improvement bar graph
Presenting data analytic screen growth improvement bar graph. This is a data analytic screen growth improvement bar graph. This is a two stage process. The stages in this process are data analytics icons, information analytics icons, content analytics icons.
-
 Online reputation management target board smile bubble bar graph chess
Presenting online reputation management target board smile bubble bar graph chess. This is a online reputation management target board smile bubble bar graph chess. This is a five stage process. The stages in this process are online reputation management, orm, reputation marketing.
-
 Procurement process with five steps circular and bar graph arrow
Presenting procurement process with five steps circular and bar graph arrow. This is a procurement process with five steps circular and bar graph arrow. This is a five stage process. The stages in this process are procurement process, purchasing process, buying cycle.
-
 Procurement process with four steps circular and bar graph arrow
Presenting procurement process with four steps circular and bar graph arrow. This is a procurement process with four steps circular and bar graph arrow. This is a four stage process. The stages in this process are procurement process, purchasing process, buying cycle.
-
 Procurement process with seven steps circular and bar graph arrow
Presenting procurement process with seven steps circular and bar graph arrow. This is a procurement process with seven steps circular and bar graph arrow. This is a seven stage process. The stages in this process are procurement process, purchasing process, buying cycle.
-
 Procurement process with six steps circular and bar graph arrow
Presenting procurement process with six steps circular and bar graph arrow. This is a procurement process with six steps circular and bar graph arrow. This is a six stage process. The stages in this process are procurement process, purchasing process, buying cycle.


