Powerpoint Templates and Google slides for Average Performance
Save Your Time and attract your audience with our fully editable PPT Templates and Slides.
-
 Performance management kpi revenue opportunities product target average
Deliver a lucid presentation by utilizing this Performance Management KPI Revenue Opportunities Product Target Average Assets. Use it to present an overview of the topic with the right visuals, themes, shapes, and graphics. This is an expertly designed complete deck that reinforces positive thoughts and actions. Use it to provide visual cues to your audience and help them make informed decisions. A wide variety of discussion topics can be covered with this creative bundle such as Revenue Opportunities, Product Target, Average Assets. All the thirteen slides are available for immediate download and use. They can be edited and modified to add a personal touch to the presentation. This helps in creating a unique presentation every time. Not only that, with a host of editable features, this presentation can be used by any industry or business vertical depending on their needs and requirements. The compatibility with Google Slides is another feature to look out for in the PPT slideshow.
-
 Average Performance In Powerpoint And Google Slides Cpb
Presenting our Average Performance In Powerpoint And Google Slides Cpb PowerPoint template design. This PowerPoint slide showcases six stages. It is useful to share insightful information on Average Performance This PPT slide can be easily accessed in standard screen and widescreen aspect ratios. It is also available in various formats like PDF, PNG, and JPG. Not only this, the PowerPoint slideshow is completely editable and you can effortlessly modify the font size, font type, and shapes according to your wish. Our PPT layout is compatible with Google Slides as well, so download and edit it as per your knowledge.
-
 Dollar Cost Averaging Performance Tracking Icon
Introducing our premium set of slides with name Dollar Cost Averaging Performance Tracking Icon. Ellicudate the three stages and present information using this PPT slide. This is a completely adaptable PowerPoint template design that can be used to interpret topics like Dollar Cost Averaging Performance Tracking Icon. So download instantly and tailor it with your information.
-
 Hospital performance data scorecard with average treatment cost
Deliver an outstanding presentation on the topic using this Hospital Performance Data Scorecard With Average Treatment Cost. Dispense information and present a thorough explanation of Scorecard, Treatment, Performance using the slides given. This template can be altered and personalized to fit your needs. It is also available for immediate download. So grab it now.
-
 Average Reduction In Injuries After Safety Performance Check
This slide covers the 7 year chart that is showing the number of injuries reduced during the timeframe by taking some measures or training employees on the usage of equipment they are using. Introducing our Average Reduction In Injuries After Safety Performance Check set of slides. The topics discussed in these slides are Performance, Equipment, Reduction, Timeframe. This is an immediately available PowerPoint presentation that can be conveniently customized. Download it and convince your audience.
-
 Analysis Of Average Wait Time At Retail Store Retail Store Operations Performance Assessment
The slide visually provides information regarding the average time customer spent at the checkout counter of retail store. It also provides details regarding waiting timings of competitors. Present the topic in a bit more detail with this Analysis Of Average Wait Time At Retail Store Retail Store Operations Performance Assessment. Use it as a tool for discussion and navigation on Analysis, Information, Competitors. This template is free to edit as deemed fit for your organization. Therefore download it now.
-
 Call Center Action Plan Dashboard Highlighting Average Answer Call Center Performance Improvement Action
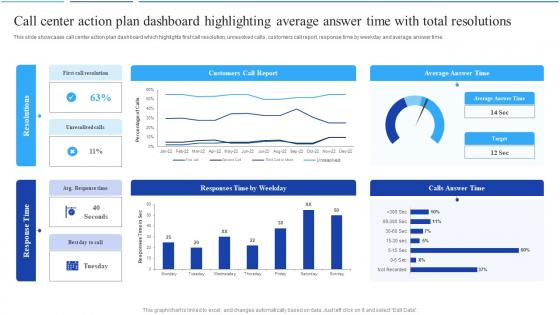
This slide showcases call center action plan dashboard which highlights first call resolution, unresolved calls, customers call report, response time by weekday and average answer time. Deliver an outstanding presentation on the topic using this Call Center Action Plan Dashboard Highlighting Average Answer Call Center Performance Improvement Action. Dispense information and present a thorough explanation of Dashboard, Highlighting, Resolutions using the slides given. This template can be altered and personalized to fit your needs. It is also available for immediate download. So grab it now.
-
 Retail Store Performance Analysis Of Average Wait Time At Retail Store Checkout
The slide visually provides information regarding the average time customer spent at the checkout counter of retail store. It also provides details regarding waiting timings of competitors. Deliver an outstanding presentation on the topic using this Retail Store Performance Analysis Of Average Wait Time At Retail Store Checkout. Dispense information and present a thorough explanation of Checkout Counter, Reflecting Slow Service, Customer Spend using the slides given. This template can be altered and personalized to fit your needs. It is also available for immediate download. So grab it now.
-
 Call Center Agent Performance Call Center Action Plan Dashboard Highlighting Average Answer Time
This slide showcases call center action plan dashboard which highlights first call resolution, unresolved calls, customers call report, response time by weekday and average answer time. Deliver an outstanding presentation on the topic using this Call Center Agent Performance Call Center Action Plan Dashboard Highlighting Average Answer Time. Dispense information and present a thorough explanation of Customers Call Report, Average Answer Time, Calls Answer Time using the slides given. This template can be altered and personalized to fit your needs. It is also available for immediate download. So grab it now.
-
 Sales Performance Dashboard With Average Lead Response Time
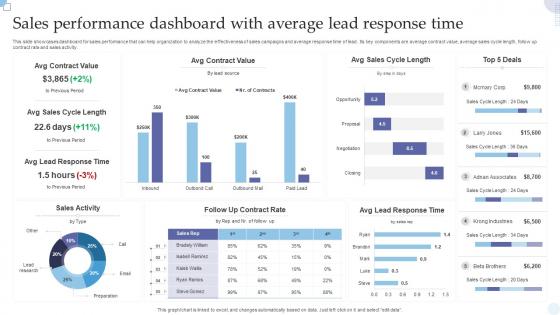
This slide showcases dashboard for sales performance that can help organization to analyze the effectiveness of sales campaigns and average response time of lead. Its key components are average contract value, average sales cycle length, follow up contract rate and sales activity. Presenting our well structured Sales Performance Dashboard With Average Lead Response Time. The topics discussed in this slide are Sales Activity, Avg Lead Response Time. This is an instantly available PowerPoint presentation that can be edited conveniently. Download it right away and captivate your audience.
-
 Call Center Action Plan Dashboard Highlighting Average Bpo Performance Improvement Action Plan
This slide showcases call center action plan dashboard which highlights first call resolution, unresolved calls, customers call report, response time by weekday and average answer time. Present the topic in a bit more detail with this Call Center Action Plan Dashboard Highlighting Average Bpo Performance Improvement Action Plan. Use it as a tool for discussion and navigation on Resolutions, Dashboard, Response. This template is free to edit as deemed fit for your organization. Therefore download it now.
-
 Financial performance kpi dashboard showing sales growth average purchase value
Presenting this set of slides with name - Financial Performance Kpi Dashboard Showing Sales Growth Average Purchase Value. This is a three stage process. The stages in this process are Financial Performance, Financial Report, Financial Review.
-
 Business performance dashboards with average revenue and customer lifetime value
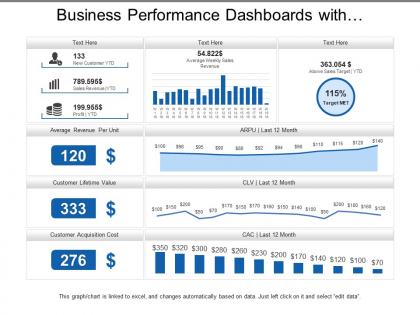
Presenting, our business performance dashboards with average revenue and customer lifetime value PPT template. You can download this engaging PPT template and take a report of the full version of this PPT deck which includes editing the text, adjusting the colors according to your liking, watermark gets expelled, include your company's logo and get slides in widescreen version.
-
 High Performers Vs Average Performers Ppt Powerpoint Presentation Icon Brochure Cpb
Presenting our High Performers Vs Average Performers Ppt Powerpoint Presentation Icon Brochure Cpb PowerPoint template design. This PowerPoint slide showcases nine stages. It is useful to share insightful information on High Performers Vs Average Performers This PPT slide can be easily accessed in standard screen and widescreen aspect ratios. It is also available in various formats like PDF, PNG, and JPG. Not only this, the PowerPoint slideshow is completely editable and you can effortlessly modify the font size, font type, and shapes according to your wish. Our PPT layout is compatible with Google Slides as well, so download and edit it as per your knowledge.
-
 Average Performance Bonus In Powerpoint And Google Slides Cpb
Presenting Average Performance Bonus In Powerpoint And Google Slides Cpb slide which is completely adaptable. The graphics in this PowerPoint slide showcase four stages that will help you succinctly convey the information. In addition, you can alternate the color, font size, font type, and shapes of this PPT layout according to your content. This PPT presentation can be accessed with Google Slides and is available in both standard screen and widescreen aspect ratios. It is also a useful set to elucidate topics like Average Performance Bonus. This well structured design can be downloaded in different formats like PDF, JPG, and PNG. So, without any delay, click on the download button now.
-
 Top performers vs average performers ppt samples
This top performer vs. average performers PPT template allows full editing. Resize or reshape the design according to your business preferences. PPT can be downloaded and converted into JPEG and PDF formats. Both standard and wide screen views are available. Slideshow can be opened with Google Slides and MS PowerPoint software. PPT can be easily updated by anyone by following the instructions provided on SlideTeam’s web page.
-
 Promotion mix product evolution achieving above average performance excellence
Presenting this set of slides with name - Promotion Mix Product Evolution Achieving Above Average Performance Excellence. This is an editable three stages graphic that deals with topics like Promotion Mix, Product Evolution, Achieving Above Average, Performance Excellence to help convey your message better graphically. This product is a premium product available for immediate download, and is 100 percent editable in Powerpoint. Download this now and use it in your presentations to impress your audience.
-
 Non performers average and top performers bell curve for appraisal
Presenting Non Performers Average And Top Performers Bell Curve For Appraisal that has been designed by our professionals for your convenience. The template can be opened and saved into various formats like PDF, JPG, and PNG. It is readily available in both standard and widescreen format. You can change the colors, fonts, font size, and font types of the presentation as per your needs. It is compatible with Google Slides which makes it easily accessible at once.
-
 Best better good average bad and worse performance testing meter
Presenting this set of slides with name - Best Better Good Average Bad And Worse Performance Testing Meter. This is a six stage process. The stages in this process are Performance Testing, Performance Analysis, Performance Monitoring.
-
 Benchmarking industry average past performance ppt powerpoint presentation file graphics template
Presenting this set of slides with name Benchmarking Industry Average Past Performance Ppt Powerpoint Presentation File Graphics Template. This is a four stage process. The stages in this process are Benchmarking, Past Performance, Industry Average, Best Practices, Growth, Management. This is a completely editable PowerPoint presentation and is available for immediate download. Download now and impress your audience.
-
 Benchmarking performance industry average ppt powerpoint presentation icon graphic images
Presenting this set of slides with name Benchmarking Performance Industry Average Ppt Powerpoint Presentation Icon Graphic Images. This is a four stage process. The stages in this process are Technology, Marketing, Planning, Business, Management. This is a completely editable PowerPoint presentation and is available for immediate download. Download now and impress your audience.
-
 Employee performance tracker average ppt powerpoint presentation model guide
Presenting this set of slides with name Employee Performance Tracker Average Ppt Powerpoint Presentation Model Guide. The topics discussed in these slides are Performers, Employee, Average. This is a completely editable PowerPoint presentation and is available for immediate download. Download now and impress your audience.
-
 Evaluating nominators performance average ppt powerpoint presentation ideas templates
The purpose of this slide is to provide a glimpse of the factors which will help to evaluate employees performance on the basis of which the best performer will be chosen. Presenting this set of slides with name Evaluating Nominators Performance Average Ppt Powerpoint Presentation Ideas Templates. The topics discussed in these slides are Problem Solving, Employees, Performance, Average, Evaluating. This is a completely editable PowerPoint presentation and is available for immediate download. Download now and impress your audience.
-
 Performance coaching average performer ppt powerpoint presentation shapes
Presenting this set of slides with name Performance Coaching Average Performer Ppt Powerpoint Presentation Shapes. The topics discussed in these slides are Type Of Employee, Training Time Allotment, Coaching Time Allotment, Trainer, Proposed Training. This is a completely editable PowerPoint presentation and is available for immediate download. Download now and impress your audience.
-
 Performance coaching average ppt powerpoint presentation microsoft
Presenting this set of slides with name Performance Coaching Average Ppt Powerpoint Presentation Microsoft. The topics discussed in these slides are Performance, Coaching, Average. This is a completely editable PowerPoint presentation and is available for immediate download. Download now and impress your audience.
-
 Regional performance of average customer satisfaction score
Presenting this set of slides with name Regional Performance Of Average Customer Satisfaction Score. The topics discussed in these slides are Regional Performance Of Average Customer Satisfaction Score. This is a completely editable PowerPoint presentation and is available for immediate download. Download now and impress your audience.
-
 Dashboard of investment portfolio performance with average assets per client powerpoint template
This slide Showcases the Graphical Representation of portfolio performance of investment. Data covered in this dashboard includes Asset Management by Manager, Top 10 clients by Assets, Top 10 Assets owned with Portfolio performance. This is a Dashboard Of Investment Portfolio Performance With Average Assets Per Client Powerpoint Template drafted with a diverse set of graphics, that can be reformulated and edited as per your needs and requirements. Just download it in your system and make use of it in PowerPoint or Google Slides, depending upon your presentation preferences.
-
 Forecasted employee efficiency and average productivity performance coaching to improve
This slide shows the forecasted data of average production per employee in tonne and employee efficiency in percentage for the next five years 2022 to 2026 Present the topic in a bit more detail with this Forecasted Employee Efficiency And Average Productivity Performance Coaching To Improve. Use it as a tool for discussion and navigation on Forecasted Employee Efficiency And Average Productivity. This template is free to edit as deemed fit for your organization. Therefore download it now.
-
 Application performance monitor with average latency
Presenting our well structured Application Performance Monitor With Average Latency. The topics discussed in this slide are Application Performance Monitor With Average Latency. This is an instantly available PowerPoint presentation that can be edited conveniently. Download it right away and captivate your audience.
-
 Application performance monitor with average wait time
Introducing our Application Performance Monitor With Average Wait Time set of slides. The topics discussed in these slides are Application Performance Monitor With Average Wait Time. This is an immediately available PowerPoint presentation that can be conveniently customized. Download it and convince your audience.
-
 Vendor performance evaluation form average company information ppt grid
This slide shows vendor performance evaluation form. Evaluation is based on various criterias namely adherence to RFP instructions, company information and project understanding. Introducing Vendor Performance Evaluation Form Average Company Information Ppt Grid to increase your presentation threshold. Encompassed with one stages, this template is a great option to educate and entice your audience. Dispence information on Business Requirement, Organizational Structure, Financial Viability, Level Of Professionalism, using this template. Grab it now to reap its full benefits.
-
 Key performance indicators target average ppt model background
The slide shows the key Performance Indicator KPI s which will help the company to track the success rate of implemented strategies. Major KPIs include number of sims sold, number of subscribers, number of towers, 5G technology users, ARPU, customer satisfaction level etc. Present the topic in a bit more detail with this Key Performance Indicators Target Average Ppt Model Background. Use it as a tool for discussion and navigation on Technology Users, Average Revenue, Target, Performance Indicator. This template is free to edit as deemed fit for your organization. Therefore download it now.


